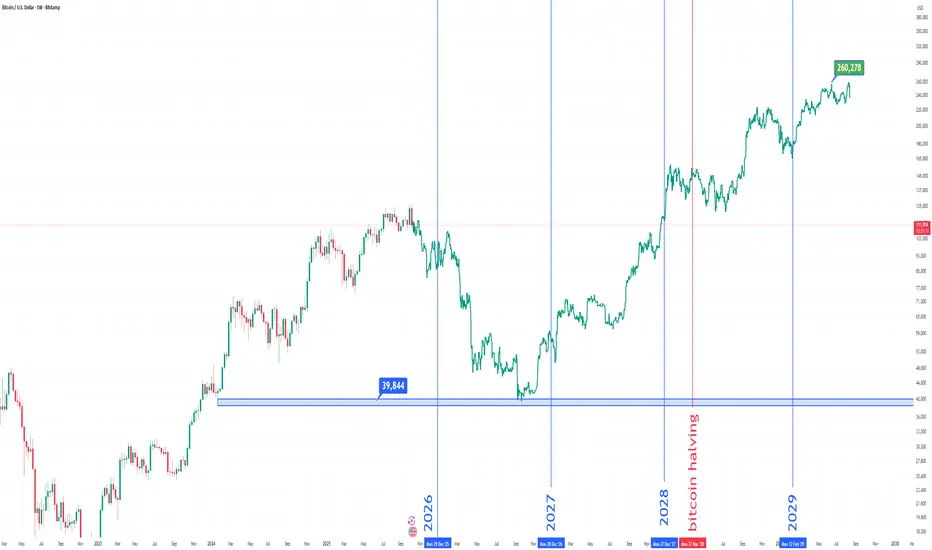
Bitcoin Roadmap Until 2029 | Halving Cycle ProjectionThis analysis illustrates Bitcoin’s potential price trajectory through the upcoming halving cycle.
Key Support Zone: 39,800 – 40,000 USD
Halving Date: 2028
Projection: Historical cycle patterns suggest a potential continuation toward 250K–300K USD range before the next major correction.
Mid-term Correction Expectation: Around late 2026 to 2027 before the next bullish expansion.
🔹 Based on past halvings, each cycle tends to follow a 12-18 month accumulation, parabolic rise, and correction phase.
🔹 Long-term investors might focus on accumulation near the blue support zone.
#Bitcoin #BTCUSDT #CryptoAnalysis #HalvingCycle #SmartMoneyConcepts
روند احتمالی بیتکوین تا سال ۲۰۲۹
در این تحلیل، چرخهی بعدی هاوینگ بیتکوین در سال ۲۰۲۸ و ناحیهی حمایتی مهم در محدودهی ۳۹٬۸۴۴ دلار مشخص شده است.
بر اساس الگوهای تاریخی، انتظار میرود پس از اصلاح میانمدت بین سالهای ۲۰۲۶ تا ۲۰۲۷، روند صعودی بزرگ بعدی آغاز شود که میتواند بیتکوین را به محدودهی ۲۵۰ تا ۳۰۰ هزار دلار برساند.
🔹 دورهی هاوینگ معمولاً با فازهای زیر همراه است:
۱️⃣ انباشت (۱۲ تا ۱۸ ماه قبل از هاوینگ)
۲️⃣ رشد پارابولیک
۳️⃣ اصلاح چرخهای
#Bitcoin #BTC #تحلیل_بیتکوین #Crypto #Halving #TradingView #farhadlotfizad
Fractal
Gold Complete Deep Pull back and is likely to retest 4025Gold Complete Deep Pull back and is likely
to retest 4025
After a quick drop to the demand zone 3950
Gole formed a Pin bar and now is forming
an Inside bar
Trading Plan:
Long gold now, Sl below the Pin
Aim 4025
Apply 2% risk rule, and close half position
when Reward Risk Ratio hit 2:!
All the bset!

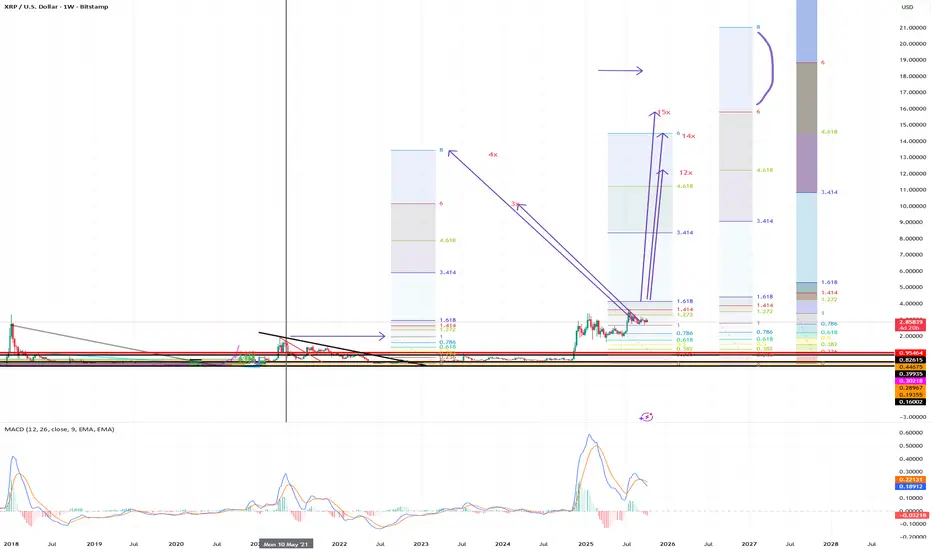
XRP/USD - Déjà vu... 2017 Are we in front of something that we lived in 2017?
Will it develop in a similar way?
ETFs incoming
Clarity Act
Institutional interest
XRPL kicking on
and more...
Share and keep your eyes peeled... and over all, stay strong and hodl!

DKNG Update | Crash AheadOne of the best fractal overlays I've seen with some Elliott Waves to go with it.
Price is still in a uptrend but with growing sellers It'll come to an end similar to the last fractal.
During the 3rd wave in the last pattern price experienced its first pullback at (B), and its second at correction wave 4 and the third after the last wave before we witnessed the last push in buyers.
This current cycle price is in a similar stage with a swing low at (b) meaning that we could see another run-up towards major resistance ($63).
This would be the final blow-off-top in general markets. TVC:RUT is already showing signs of weakness which works well with this TA example.
When the time is right I'll do another TA for the downfall. For now I'm bullish but for the horizon I'm very bearish.

Bitcoin 130,000 – Correction AheadBitcoin
Around the $130,000 level, there is a possibility of a deep correction toward the $74,000 zone.
Do not panic, and do not get carried away by emotions.
This is the market — it plays with your psychology.
The market is geometric. BYBIT:BTCUSDT

SEIC / SEI Investment / Fractal inspired seasonal LONG ScenarioRoundabout 21th of september SEIC should show upside.
My fractal analysis suggests a ling entry from that marked area of price.
From there I suggest to take at least partial profit when 9-10% are reached or time reached 5th or deceber.
Some weakness end of october until early november may give a change to add to the position.

RENEWED US-CHINA TRADE TENSIONS COULD DRAG S&P500 TO ITS MEANWith renewed trade tensions between the US and China creating market uncertainty, the S&P 500 could be pushed significantly lower. The key support level to watch is the 6255 - 6468 range (1), which may act as a buffer. A break below this level could accelerate the move down toward the Feb - Apr 2025 monthly pullback zone (2). In either scenario, this volatility could cause a repricing of many stocks toward their perceived fundamental values.
N.B!
- ES! price might not follow the drawn lines . Actual price movements may likely differ from the forecast.
- Let emotions and sentiments work for you
- ALWAYS Use Proper Risk Management In Your Trades
#S&P500
#nasdaq
#nyse

XAU/USD 10 October 2025 Intraday AnalysisH4 Analysis:
-> Swing: Bullish.
-> Internal: Bullish.
Price printed according to yesterday's analysis where I mentioned price to indicate bearish pullback phase initiation by printing bearish CHoCH.
Price is currently trading within an established internal range.
Intraday Expectation:
Price to continue bearish, react at either discount of 50% EQ or H4 supply zone before targeting weak internal high priced at 4059.350
Note:
The Federal Reserve’s sustained dovish stance, coupled with ongoing geopolitical uncertainties, is likely to prolong heightened volatility in the gold market. Given this elevated risk environment, traders should exercise caution and recalibrate risk management strategies to navigate potential price fluctuations effectively.
Additionally, gold pricing remains sensitive to broader macroeconomic developments, including policy decisions under President Trump. Shifts in geopolitical strategy and economic directives could further amplify uncertainty, contributing to market repricing dynamics.
H4 Chart:
M15 Analysis:
-> Swing: Bullish.
-> Internal: Bullish.
Analysis and bias remains the same as yesterday's analysis dated 09 October 2025.
Price continued bullish, printing further ATH's.
Price has printed a bearish CHoCH, however, as mentioned in yesterday's analysis, I will be monitoring depth of pullback. Pullback is insignificant, therefore, I will again apply discretion and not classify as such. I have however marked this in red.
Price has since printed a further bearish CHOCH which means that price is now trading within an established internal range. However, I shall, again, be monitoring depth of pullback.
Intraday expectation: Price to trade down to either discount of 50% EQ, or M15 supply zone before targeting weak internal high priced at 4,059.350.
Alternative Scenario: Price could potentially target strong internal low as H4 TF enters it's bearish pullback phase.
Note:
Gold remains highly volatile amid the Federal Reserve's continued dovish stance, persistent and escalating geopolitical uncertainties. Traders should implement robust risk management strategies and remain vigilant, as price swings may become more pronounced in this elevated volatility environment.
Additionally, President Trump’s tariff announcements are expected to further amplify market turbulence, potentially triggering sharp price fluctuations and whipsaws.
M15 Chart:

FDS / Factset / Seasonality and FractalFrom the End of October Factset should be lifted with the general goo d market conditions in PE+1 year.
The fractal analysis suggests a move of nearly 40%.
Good risk to reward with a 6% stopploss.
This is not a trade call nor financial advice.
Cheers

Bitcoin (BTC), End of Cycle Season Based on Cycle DurationBINANCE:BTCUSDT
Bitcoin appears to have already formed its peak within the current bullish cycle and may now be preparing for a correction.
Alternatively, if BTC makes another attempt to reach a new all-time high within October, that period could mark the final peak of this cycle.
Looking at historical data, Bitcoin has shown a repeating pattern —
an uptrend lasting approximately 3 years and 11 months (1,065 days) from the bottom,
followed by a downtrend of about 1 year (365 days) from the peak.
During down cycles, the cycle low has typically formed between the EMA 50 and EMA 100.
Backtesting monthly charts shows that Bitcoin often breaks below the EMA 50, finds support above the EMA 100, and then breaks through the Ichimoku Cloud, signaling the start of a new bullish cycle.
Become an early follower and be part of the journey.🚀
I am Korean and I used Google Translate.

XAU/USD 09 September 2025 Intraday AnalysisH4 Analysis:
-> Swing: Bullish.
-> Internal: Bullish.
Price has continued with it's bullish trajectory, printing further ATH's, breaching the $4000 mark for the first time.
Price is currently trading within an internal low and fractal high. CHoCH positioning is denoted with a horizontal blue dotted line
Intraday Expectation:
Price to indicate bearish pullback phase initiation by printing bearish CHoCH.
Note:
The Federal Reserve’s sustained dovish stance, coupled with ongoing geopolitical uncertainties, is likely to prolong heightened volatility in the gold market. Given this elevated risk environment, traders should exercise caution and recalibrate risk management strategies to navigate potential price fluctuations effectively.
Additionally, gold pricing remains sensitive to broader macroeconomic developments, including policy decisions under President Trump. Shifts in geopolitical strategy and economic directives could further amplify uncertainty, contributing to market repricing dynamics.
H4 Chart:
M15 Analysis:
-> Swing: Bullish.
-> Internal: Bullish.
Price continued bullish, printing further ATH's.
Price has printed a bearish CHoCH, however, as mentioned in yesterday's analysis, I will be monitoring depth of pullback. Pullback is insignificant, therefore, I will again apply discretion and not classify as such. I have however marked this in red.
Price has since printed a further bearish CHOCH which means that price is now trading within an established internal range. However, I shall, again, be monitoring depth of pullback.
Intraday expectation: Price to trade down to either discount of 50% EQ, or M15 supply zone before targeting weak internal high priced at 4,059.350.
Alternative Scenario: Price could potentially target strong internal low as H4 TF enters it's bearish pullback phase.
Note:
Gold remains highly volatile amid the Federal Reserve's continued dovish stance, persistent and escalating geopolitical uncertainties. Traders should implement robust risk management strategies and remain vigilant, as price swings may become more pronounced in this elevated volatility environment.
Additionally, President Trump’s tariff announcements are expected to further amplify market turbulence, potentially triggering sharp price fluctuations and whipsaws.
M15 Chart:

BTC to 30k Upward trend, leads to sales, takes liquidity from buyers to continue.
See its execution pattern in shorter time frames.

XAU/USD 08 October 2025 Intraday AnalysisH4 Analysis:
-> Swing: Bullish.
-> Internal: Bullish.
Price has again printed a bearish CHoCH. However, I will apply discretion and not classify as such due to insignificant depth of pullback, relative to recent price action. I have however marked this in red once again.
Intraday Expectation:
Allow price to continue with it bullish trajectory and to show signs of bearish pullback phase initiation. This would typically be the printing of a bearish CHoCH, which would indicate bearish pullback phase initiation. Current CHoCH positioning is denoted with a blue horizontal dotted line.
Note:
The Federal Reserve’s sustained dovish stance, coupled with ongoing geopolitical uncertainties, is likely to prolong heightened volatility in the gold market. Given this elevated risk environment, traders should exercise caution and recalibrate risk management strategies to navigate potential price fluctuations effectively.
Additionally, gold pricing remains sensitive to broader macroeconomic developments, including policy decisions under President Trump. Shifts in geopolitical strategy and economic directives could further amplify uncertainty, contributing to market repricing dynamics.
H4 Chart:
M15 Analysis:
-> Swing: Bullish.
-> Internal: Bullish.
Price continued bullish, printing further ATH's.
Price has printed several bearish CHoCH's, however, as mentioned in yesterday's analysis, I would be watching depth of pullback. Pullback on all bearish CHoCH's was insignificant, therefore, I will apply discretion and not classify as such. I have however marked them in red.
Intraday expectation: Allow price to show more definitive signs of bearish pullback phase initiation. This would be for price to trade down to either discount of 50% EQ, or M15 supply zone.
Alternative Scenario: Price could potentially target strong internal low as H4 TF enters it's bearish pullback phase.
Note:
Gold remains highly volatile amid the Federal Reserve's continued dovish stance, persistent and escalating geopolitical uncertainties. Traders should implement robust risk management strategies and remain vigilant, as price swings may become more pronounced in this elevated volatility environment.
Additionally, President Trump’s tariff announcements are expected to further amplify market turbulence, potentially triggering sharp price fluctuations and whipsaws.
M15 Chart:

doge 1.50 2.60If doge can do this again, it maybe could go even higher, anyway , these are our targets.


BTC 167.000 240.000 how bullish?Don´t have an idea , maybe 167k or 240k. Major probability = 200-240k range

xrp 14 18 24Although we could expect 24 or more, it is possible that the very strong setback, in March 2025, could just let us get 10usd-12usd. If something goes wrong, only 6usd

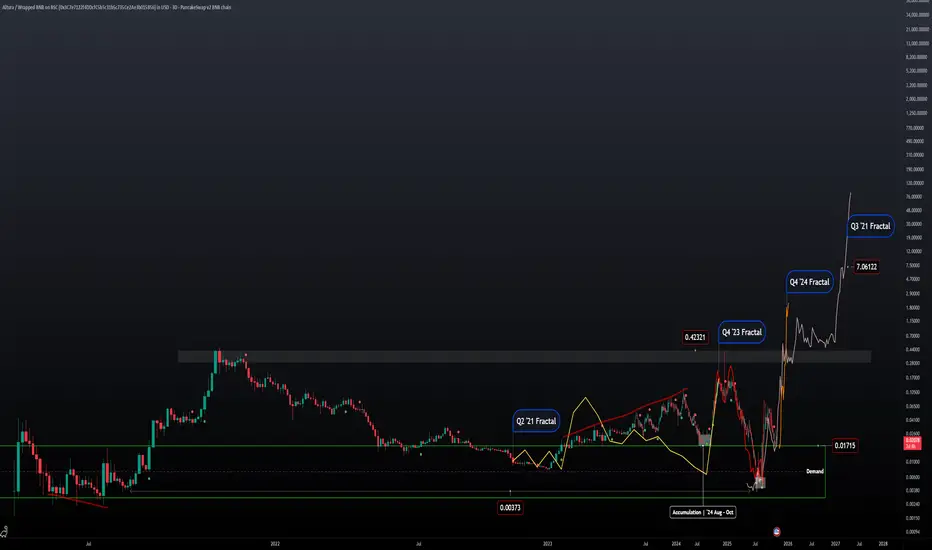
ALU | '21 Fractals | Price Projection Four different fractals with similar results. Q2 '21 price was in convergence and took off in July similarly to price action in '23 -'24. Except price was in divergence and stopped selling off in July and took off in November leaving the middle months for accumulation.
After the expansion phase of the market in '24 price action got tossed into the distribution phase and price was bound to fall to these lows today.
Looking at Q4 '23 Fractal it fits perfectly with what we saw early this year when price was distributing.
Regardless what the news and fundamentals where saying price was able to repeat the same fractal by using the lows of '21.
Q4 '24 Fractal is the most recent pattern that we can reference with todays price action to get a projected estimate.
Current price action has also stopped selling in July and has been accumulating since then
Would like to see price action close at ATHs going into the next year and into the next distribution phase.
XAU/USD 07 October 2025 Intraday AnalysisH4 Analysis:
-> Swing: Bullish.
-> Internal: Bullish.
Price had printed a bearish CHoCH. Where we were trading within an established internal range, however, bearish pullback was insignificant relative to recent price action, therefore, I will not classify the bullish, I have however marked this in red again.
Price has continued bullish printing further ATH's. Price has since printed a bearish CHoCH, which is the first indication, but not confirmation, of bearish pullback phase initiation, however, I will continue to monitor price with respect to dept of pullback.
Price is currently trading within and established internal range.
Intraday Expectation:
Price to trade down to either discount of internal 50% EQ, or H4 supply zone before targeting weak internal high priced at 3,977.400.
Alternative scenario: Price could potentially print higher-highs.
Note:
The Federal Reserve’s sustained dovish stance, coupled with ongoing geopolitical uncertainties, is likely to prolong heightened volatility in the gold market. Given this elevated risk environment, traders should exercise caution and recalibrate risk management strategies to navigate potential price fluctuations effectively.
Additionally, gold pricing remains sensitive to broader macroeconomic developments, including policy decisions under President Trump. Shifts in geopolitical strategy and economic directives could further amplify uncertainty, contributing to market repricing dynamics.
H4 Chart:
M15 Analysis:
-> Swing: Bullish.
-> Internal: Bullish.
Price continued bullish, printing further ATH's.
Price has printed a bearish CHoCH which indicates, but does not confirm, bearish pullback phase initiation. We are now confined with an establish internal range, however, I shall continue to monitor price with respect to depth of pullback.
Intraday expectation: Price to trade down to either M15 supply zone, or discount of 50% EQ before targeting internal high priced at 3,977.400
Alternative Scenario: Price could potentially target strong internal low as H4 TF enters it's bearish pullback phase.
Note:
Gold remains highly volatile amid the Federal Reserve's continued dovish stance, persistent and escalating geopolitical uncertainties. Traders should implement robust risk management strategies and remain vigilant, as price swings may become more pronounced in this elevated volatility environment.
Additionally, President Trump’s tariff announcements are expected to further amplify market turbulence, potentially triggering sharp price fluctuations and whipsaws.
M15 Chart:

BTCUSD | Daily Structure Analysis
Overview :
After breaking the last daily resistance and completing a correction on the weekly timeframe, Bitcoin is now trading below the 124,000 level.
If the price manages to break above 124,500, it could continue its bullish wave toward 127,500, and later 132,700, completing the upward structure.
📈 Resistance Levels:
🔺 124,500 — Key Level
🔺 127,500
🔺 132,500
📉 Support Levels:
🟩 117,700
🟩 114,500
🟩 107,300 — Key Level
🧠 Analytical Note:
A breakout and retest (pullback) of any key level could define the next directional move — whether bullish or bearish.
Currently, the market is testing a strong resistance area, and the reaction here will likely determine next week’s direction.
💬 What’s your outlook on Bitcoin?
Do you think BTC needs a short-term correction before continuing higher?
مرور کلی:
قیمت بیت کوین پس از شکست آخرین مقاومت در تایم فریم روزانه و تکمیل اصلاح در تایم فریم هفتگی، اکنون زیر سقف 124,000 دلار قرار دارد.
در صورتی که قیمت بتواند مقاومت 124,500 را با قدرت بشکند، احتمال حرکت صعودی تا نواحی 127,500 و سپس 132,700 وجود دارد و میتواند موج صعودی فعلی خود را تکمیل کند.
📈 نواحی مقاومت (Resistance Levels):
🔻 124,500 — Key Level
🔻 127,500
🔻 132,500
📉 نواحی حمایت (Support Levels):
🔰 117,700
🔰 114,500
🔰 107,300 — Key Level
🧠 نکته تحلیلی:
شکست هر یک از نواحی کلیدی و بازگشت (پولبک) به آن ها میتواند مسیر حرکت بعدی بازار را مشخص کند؛ چه در جهت صعودی و چه نزولی.
در حال حاضر بازار زیر ناحیهی مقاومتی کلیدی قرار دارد و واکنش قیمت به این سطح میتواند جهت هفته ی آینده را تعیین کند.
💬 نظر شما چیست؟
به نظر شما بیتکوین پیش از ادامه ی حرکت، نیاز به یک استراحت کوتاه ندارد؟

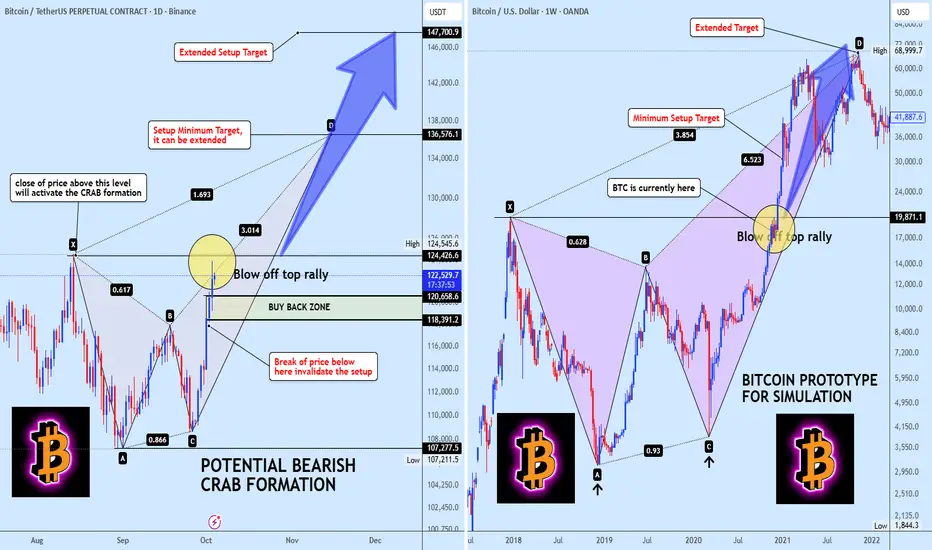
BTC's 2021 Playbook is Back Are You Ready for the Final Rally?History doesn't repeat itself, but it often rhymes. And right now, Bitcoin is composing a symphony we've heard before, one that ended in a PARABOLIC EXPLOSION.
We're looking at a potential BEARISH CRAB PATTERN on the daily chart, and it's a near perfect mirror of the 2017-2021 prototype that launched us to the last cycle top. Buckle up.
The Simple Breakdown:
1. THE ACTIVATION TRIGGER: A daily close ABOVE $124,545. This is the launch button.
2. THE BUY THE DIP ZONE: $118k to $120k. Any dip here could be a gift before the rip.
3. THE FAIL SAFE: A daily close BELOW $107k invalidates the setup. This is our line in the sand.
THE TARGETS:
1. Minimum Target: $136,576
2. Extended Target: $147,700-$160k
The Ghost of Cycles Past (Right Chart):
Look at the 2017-2021 prototype. The C to D leg wasn't just a rally; it was a BLOW OFF TOP of historic proportions. It delivered the targets and then some before exhaustion set in.
The current structure is screaming that we could be at the same inflection point.
This isn't just another pattern. This is a cyclical blueprint suggesting Bitcoin is gearing up for the FINAL, EXPLOSIVE LEG of this cycle.
If this Crab confirms, we are targeting the $136K to $147K+ zone as the potential cycle peak. This is where liquidity floods in and volatility goes vertical.
A Word of Caution:
Always trade with a plan. The invalidation level at $107K is crucial. A break below there means the setup is broken, and we must re-assess.
The takeaway? All eyes on the $124.5K breakout. This could be the start of the grand finale.