BTCUSDOur analysis is based on the weekly candle close. it closes below 107265, we can correct to the range below 92, then the power will return to the buyers.
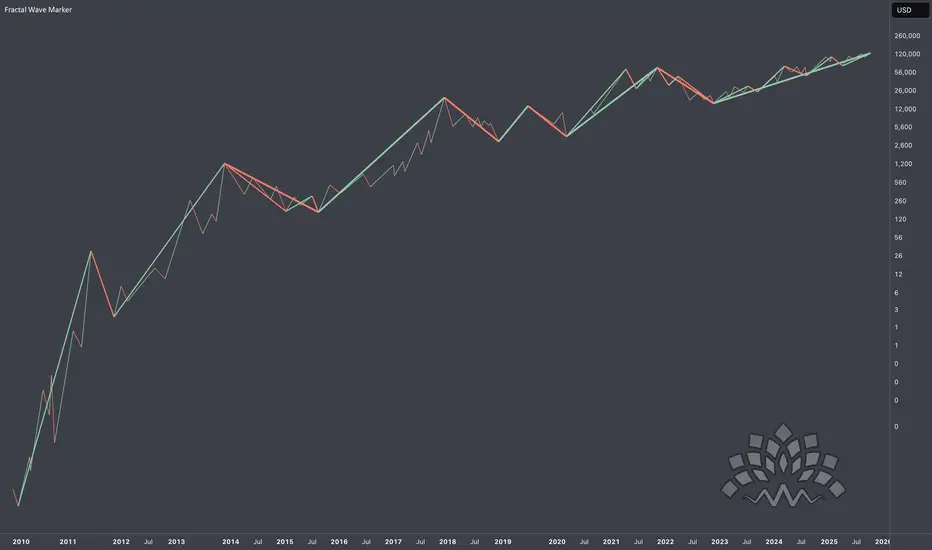
Fractal

EURUSD could dropA downward move in EURUSD could initiate from its current price range,
or from either the 1.16284 or 1.64500 levels. CMCMARKETS:EURUSD

XAU/USD 14 November 2025 Intraday AnalysisH4 Analysis:
-> Swing: Bullish.
-> Internal: Bullish.
Analysis and bias remains the same as analysis dated 20 October 2025.
Price has printed as per previous intraday expectation by printing a bearish CHoCH which indicates, but not confirms, bullish pullback phase initiation.
Price is currently trading within an established internal range, however, I will continue to monitor price with regards to depth of pullback.
Intraday expectation:
Price to continue bearish, react at either discount of 50% internal EQ, or H4 supply zone before targeting weak internal high priced at 4,380.990.
Note:
The Federal Reserve’s sustained dovish stance, coupled with ongoing geopolitical uncertainties, is likely to prolong heightened volatility in the gold market. Given this elevated risk environment, traders should exercise caution and recalibrate risk management strategies to navigate potential price fluctuations effectively.
Additionally, gold pricing remains sensitive to broader macroeconomic developments, including policy decisions under President Trump. Shifts in geopolitical strategy and economic directives could further amplify uncertainty, contributing to market repricing dynamics.
H4 Chart:
M15 Analysis:
-> Swing: Bullish.
-> Internal: Bullish.
As per yesterday's analysis, price has printed a bearish CHoCH to indicate, but not confirm bearish pullback phase initiation.
Price is currently trading within an established internal range.
Intraday expectation:
Price to trade down to either discount of 50% internal EQ, or M15 demand zone before targeting weak internal high, priced at 4,245.195
Note:
Gold remains highly volatile amid the Federal Reserve's continued dovish stance, persistent and escalating geopolitical uncertainties. Traders should implement robust risk management strategies and remain vigilant, as price swings may become more pronounced in this elevated volatility environment.
Additionally, President Trump’s tariff announcements, particularly against China, are expected to further amplify market turbulence, potentially triggering sharp price fluctuations and whipsaws.
M15 Chart:

USD/CHF – Building the LaunchpadAfter a clean impulse higher, USD/CHF is dipping right into the zone where demand was born — the BC + WCL overlap , sitting on top of the daily imbalance .
This area (around 0.7975 ) feels like the kind of zone where price takes a breath before the next leg.
As long as 0.7923 holds, I’m hunting for longs toward 0.8270–0.8300 .
That’s the HTF target and the last unmitigated supply area above.
If the zone cracks, I’ll let it go — no need to fight the flow.
Solid structure, clean logic, fair R:R. Let’s see if the launchpad fires.
Disclaimer: This post is for educational purposes only and does not constitute financial advice.

EUR/USD – The Rhythm ResetsPrice formed a clean A–B–C correction and tapped into the BC zone around 1.1570–1.1550 .
I’m watching this area for a possible reload — structure still bullish while 1.1539 holds.
Targeting the C extension near 1.1640 if momentum confirms.
If it breaks, I’ll wait for the next rhythm — no chase.
Disclaimer: This post is for educational purposes only and does not constitute financial advice.

BTC is going up BTC has the potential to rise from this its curent price of 98292
to 116551 , A key suport level to watch is at 92278. BINANCE:BTCUSDT

Corn butterfly Been bullish on corn 🌽 for a good while. This is long term harmonic pattern that made me that way. The bottom which recently occurred was marked by three distinct doji type candles. Really believe commodity supercycle is very close. Oil, corn , metals obviously 🙄.

XAU/USD 13 November 2025 Intraday AnalysisH4 Analysis:
-> Swing: Bullish.
-> Internal: Bullish.
Analysis and bias remains the same as analysis dated 20 October 2025.
Price has printed as per previous intraday expectation by printing a bearish CHoCH which indicates, but not confirms, bullish pullback phase initiation.
Price is currently trading within an established internal range, however, I will continue to monitor price with regards to depth of pullback.
Intraday expectation:
Price to continue bearish, react at either discount of 50% internal EQ, or H4 supply zone before targeting weak internal high priced at 4,380.990.
Note:
The Federal Reserve’s sustained dovish stance, coupled with ongoing geopolitical uncertainties, is likely to prolong heightened volatility in the gold market. Given this elevated risk environment, traders should exercise caution and recalibrate risk management strategies to navigate potential price fluctuations effectively.
Additionally, gold pricing remains sensitive to broader macroeconomic developments, including policy decisions under President Trump. Shifts in geopolitical strategy and economic directives could further amplify uncertainty, contributing to market repricing dynamics.
H4 Chart:
M15 Analysis:
-> Swing: Bullish.
-> Internal: Bullish.
Price did not print according to my analysis. Price instead targeted strong internal high by printing a bullish iBOS.
This could potentially indicate H4 bearish pullback phase is complete.
Price has since printed a couple of bearish CHoCH's, however, I will not mark them as such due to very insignificant depth of pullback.
Intraday expectation:
Price to indicate bearish pullback phase initiation by printing a bearish CHoCH. CHoCH positioning is demoted with a blue horizontal dotted line.
Note:
Gold remains highly volatile amid the Federal Reserve's continued dovish stance, persistent and escalating geopolitical uncertainties. Traders should implement robust risk management strategies and remain vigilant, as price swings may become more pronounced in this elevated volatility environment.
Additionally, President Trump’s tariff announcements, particularly against China, are expected to further amplify market turbulence, potentially triggering sharp price fluctuations and whipsaws.
M15 Chart:

AUD/USD – Looking for buys off the 4H BC zoneAfter completing a clean bearish correction, price shifted bullish on the 4H.
I’m waiting for a retrace into the BC + Order Block zone (0.6490) to go long.
Targeting 0.6560 , stop below 0.6463 .
If 0.6460 breaks cleanly, setup’s invalid.
R:R ≈ 1:2.6 — let’s see if demand holds 👀
Disclaimer: This post is for educational purposes only and does not constitute financial advice.

Fractal Dimension VisualizedThere are plenty of times where fractals are mentioned across TA, from indicators like FRAMA, Williams Fractals, concepts like Elliott waves - all the way to my own way of breaking cycles through Fibonacci Channels. Pretty much most of them are about self-similar behavior of the market which is often invisible to unweponized eye.
In this piece I’m going to the core - fractal dimension . Don’t fixate on numbers! Instead, visualize the scaling process: how structures fills space as you zoom in and out.
Regular Dimensions
The most fundamental question is: How many copies (N) do we get with each magnification (R).
Line (1D): A line has only one length. If I magnify length by a factor R, the number of smaller copies that fit is N=R. (Double the length → 2 copies; in general N = R^1.)
Square (2D): Magnify side length by R: the big square splits into a grid of R x R old squares, so N=R^2.
Cube (3D): Magnify edge length by R: the big cube contains R x R x R small cubes, so N=R^3.
So in D dimensions, when you scale length by R, the count of self-similar copies is N = R^D
Hence, we can extract dimension: D = log N / log R
This is the similarity dimension formula when the object breaks into N exact copies, each scaled by 1/R in length.
Application to Fractals
Sierpinski Triangle
We actually start with a solid 2D equilateral triangle. Then we remove the central upside-down triangle to leave three smaller solid triangles. Now we repeat that step inside every remaining triangle, forever. As this process continues, any patch of solid area that survives will eventually be removed, so the total area shrinks toward zero while the number of pieces explodes. The limit is the Sierpiński triangle: not “just lines,” but a fractal set with no area and a non-integer dimension between 1 and 2
At each step you get N=3 copies, each scaled by 1/2 (so R=2).
D = log 3 / log 2 = 1.5850
How to work out D in practice
Identify the scaling length: by what factor R must you magnify so the large figure looks like a collage of smaller identical copies?
Count those copies N.
Plug into D = log N / log R.
This is highly important for perceiving scaling laws not just for self-similar shapes but also other patterns.
DKNG Update | $10Video contains a update on DKNG price action
Looking to see a move to $10 in the long term view
First we need to see a pullback which we are going through currently
Before $10 we will look to hit $20 first. Any rejection under liquidity grab will validate the next move.
Watch video for more details.
Ps
TradingView needs to allow shorter descriptions again😕

XRPUSDT 30min Longs 🔵 Market Structure
Break of Structure (BOS): Above 2.4283 confirmed
Liquidity Sweep: Below 2.4019 before push upward
🟡 ICT Concepts
⚡ Trade Setup
Long Entry: 2.4150-2.4200 (current pullback)
Stop Loss: Below 2.3980 (FVG break)
Targets :
TP1: 2.4500-2.4750
TP1:2.5200-2.5700
Bullish structure intact - buying dips for liquidity grab above
#XRP #SMC #ICT #TradingView #Bullish

SOLUSDT 30min | Bullish 🔵 Alligator Positioning
Lips: 156.52 | Teeth: 156.15 | Jaws: 156.38
Price trading ABOVE all 3 lines → bullish alignment
Tight coil suggests imminent expansion
Market Structure
Sell-side Liquidity: Swept below 157.78
🎯 Optimal Trade Entry
Primary Long: 157.80-158.00 (current zone)
Secondary Long: 157.15-157.40 (OB retest)
Stop Loss: Below 156.10 (Alligator cluster break)
💰 Profit Targets
TP1: 160.00 (immediate resistance)
TP2: 162.50-165.00 (momentum zone)
TP3: 170.00-171.63 (liquidity target)
Bullish alignment intact - buying Alligator support for push toward liquidity above
#SOL #TradingView #ICT #Alligator #Bullish

XAUUSD XAU/USD – Gold Analysis
After reaching previous highs, gold entered a multi-week range, consolidating within well-defined support and resistance levels. Now, price is approaching the upper boundary of that range, showing clear accumulation just below resistance, forming a cup-shaped pattern — a classic bullish continuation setup.
If gold breaks above this resistance, I expect a retest of the breakout zone followed by a potential move toward 4,195 as the first target.
Fundamentally, gold remains supported by expectations of stable U.S. interest rates, ongoing geopolitical uncertainty, and safe-haven demand, all of which continue to reinforce the metal’s bullish medium-term outlook.

XAU/USD 12 October 2025 Intraday AnalysisH4 Analysis:
-> Swing: Bullish.
-> Internal: Bullish.
Analysis and bias remains the same as analysis dated 20 October 2025.
Price has printed as per previous intraday expectation by printing a bearish CHoCH which indicates, but not confirms, bullish pullback phase initiation.
Price is currently trading within an established internal range, however, I will continue to monitor price with regards to depth of pullback.
Intraday expectation:
Price to continue bearish, react at either discount of 50% internal EQ, or H4 supply zone before targeting weak internal high priced at 4,380.990.
Note:
The Federal Reserve’s sustained dovish stance, coupled with ongoing geopolitical uncertainties, is likely to prolong heightened volatility in the gold market. Given this elevated risk environment, traders should exercise caution and recalibrate risk management strategies to navigate potential price fluctuations effectively.
Additionally, gold pricing remains sensitive to broader macroeconomic developments, including policy decisions under President Trump. Shifts in geopolitical strategy and economic directives could further amplify uncertainty, contributing to market repricing dynamics.
H4 Chart:
M15 Analysis:
-> Swing: Bullish.
-> Internal: Bearish.
You will note how price remains contained in consolidation between a supply and demand zone. The rest of my analysis and bias remains the same as bias date 29 October 2025.
As expected, price has printed a bullish CHoCH to indicate bullish pullback phase initiation.
Price is now trading within an established internal range.
Intraday expectation:
Price to continue bullish, react at either premium of internal 50% EQ or M15 demand zone before targeting weak internal low, priced at 3,886.465.
Note:
Gold remains highly volatile amid the Federal Reserve's continued dovish stance, persistent and escalating geopolitical uncertainties. Traders should implement robust risk management strategies and remain vigilant, as price swings may become more pronounced in this elevated volatility environment.
Additionally, President Trump’s tariff announcements, particularly against China, are expected to further amplify market turbulence, potentially triggering sharp price fluctuations and whipsaws.
M15 Chart:

Brent crude againThe max bat is playing out in real time.
Brent is going to keep going up.
Will link idea from Pico bottom.

BTC HARMONICSBtc 1M fractal close. 102400 ish.
Two harmonics one up one down.
See how price reacts see which is victorious.
112500 upper target if we go up.

Good zones o work with, nasdaq 11-11-25Low volume nodes and gaps, usually are good zones to work with.

BTC Wyckoff DistributionFor all the WyCkOfF nEvEr WoRkS bros - publishing on Nov 11 and will come back to this in a few days/weeks (depending on which phase we're in). We're likely either in phase D and might see another quick drive past the SOW (Signs of Weakness) or even the AR (Automatic Reaction), followed by a sharp decline. Or we're in phase E and we're about to get a brutal decline in the coming days. 🍿
My thesis on why the accumulation and distribution cycles seem a lot more visible this cycle is because of etfs and large institutional involvement.

XVGUSD Livermore Accumulation Cylinder - VERGEVerge is currently ranging through a Livermore Accumulation Cylinder pattern. A breakout is expected soon.
In my opinion, as the fractal projection suggests, the future bottom will be at the level of the current ATH, $0.25.
This is not a financial advice. Do you own research.

Privacy is Pricy Again — How Zcash Got Back in the GameA significant shift is recently observed in the cryptocurrency space, indicating a resurgence of interest in privacy. The sharp rise of Zcash (ZEC) — over 46% in the week following Galaxy Research's analysis — is a clear example of this trend, reflecting the market's demand for untraceable funds.
Zcash, after years on the sidelines, has returned to the forefront, confirming that the fundamental cypherpunk ideals of privacy hold high value in the modern financial system.
1. Technological Breakthroughs and Zcash’s Fundamental Growth
The Zcash rally is driven not only by speculation but also by major improvements that have made privacy both more accessible and more effective:
Removing Barriers (Zashi & NEAR Intents): The use of zk-SNARKs (zero-knowledge proofs) has become more user-friendly. Enhanced user experience (UX) in new wallets (like Zashi) and integration with cross-chain mechanisms like NEAR Intents have removed the technical friction associated with "shielding" transactions.
Strengthening Anonymity: The most crucial network metric for Zcash is the increase of shielded coins in the Orchard pool to over 30% of the total supply. The more coins are "hidden," the larger the anonymity set becomes, which mathematically increases the difficulty of tracing transactions.
Technological Edge: Zcash, unlike some competitors, offers quantum-resistant cryptography and a stronger privacy mechanism via zk-SNARKs, which allows transaction validation without revealing the amount, sender, or receiver.
2. Zcash as a Counter-Trend to Transparency
The sharp price increase of ZEC after years of stagnation reflects a broader market narrative:
Reaction to Institutionalization: Against the backdrop of Bitcoin's growing transparency and institutionalization (ETFs, centralized custodians), Zcash is positioning itself as “encrypted Bitcoin”—an asset that refocuses attention on the decentralized and private nature of crypto assets.
Regulatory Balance: Zcash utilizes optional privacy, which, according to analysts, may provide the project with greater regulatory resilience compared to coins where privacy is mandatory by default.
Repricing Privacy: The market has demonstrated that the demand for confidentiality has not disappeared. The Zcash rally has forced investors to re-evaluate all privacy-focused projects, proving that, amid increasing online surveillance, the ability to transact privately has once again become a highly valuable feature.
Summary: Zcash is back in the game, bolstered by strong technological improvements that have made its privacy accessible and effective. The sustained nature of this growth will depend on whether the project can convert this speculative momentum into stable growth in user and network activity.

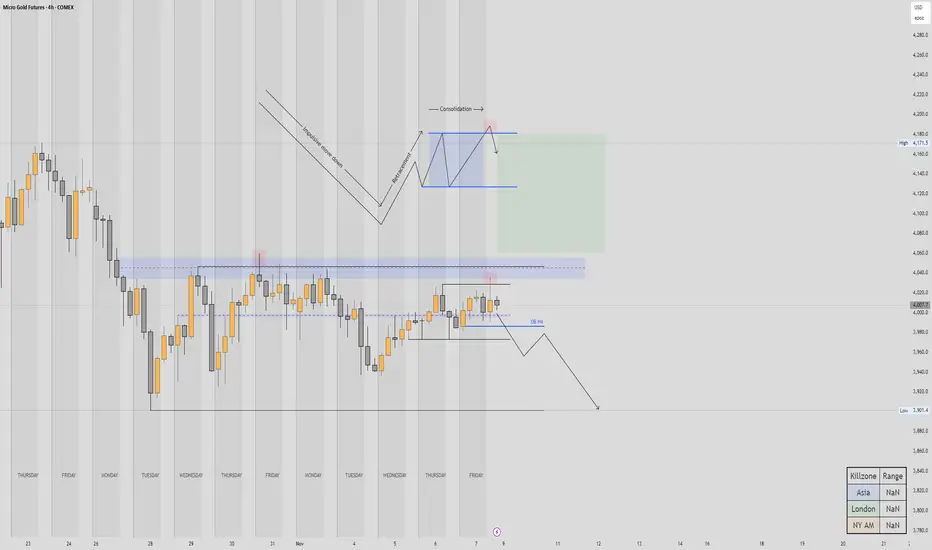
Gold futures to break back down the 4000?As we all know Gold has had an incredible rally this year,
Though, it's been consolidating for the last two weeks, and as far as the structure of the consolidation, some of the liquidity has been taken from the daily FVG on Oct the 30th, leaving a permanent high on the H4 chart with a nice bearish candle
Then it consolidated again for a bit, got an impulse to the downside, retraced with difficulty back to the H4 order block, to consolidate again last 2 days of last week. Finally , it printed what could be more of a permanent high on friday afternoon.
The combination of this, plus the last two day's candles looking bearish, starts to advocate for a bearish bias.
Therefore I'd like to see the price go and reach for the low of the range, after it's breaking the H4 structure
Of course this idea could be invalidated, if Gold was to break above the recent high and the Daily FVG, then we'd reasses the situation.
Still, I would be cautious for longs, Gold has been very extended for a very long time, needs to cool off a bit so we can go buy some coins again!
Cheers!
GBPUSD Retracement then back down GBPUSD kind of the same as EU
Very mean push down last week as expected, but, also it printed a quiet agressive reversal Weekly candle, therefore, I would like to see the price open low, reach into last week's wick, then back into the range, if it was to go and grab some liquidity into the FVG first, that would make a very good candidate for a short term long,
There is always the possibility for the price to open higher and trade higher then we'd adjust but, prefered scenario, trade lower, then back to previous week high,
If it does that, I'm not sure we'll have the reversal back to resume the downtrend this week, we left a lot of liquidity on the upside, I don't see the price just shooting down, it's possible, but less probable,
So for this week, looking at the continuation of the retracement up, then will start looking for sign or reversals back to the south. This 0.62/0.79 zone looks very appealing!
Good week and happy trading!
