DOT ; Boring movementsHello friends
According to the decline we have, you can see that the price has created an ascending channel and is slowly rising.
But there is an important resistance in its way, which it has hit once and caused a price correction, and the price is gathering strength to rise again.
Now, if this resistance is reliably broken and the price stabilizes above it, the price can move to the specified targets.
*Trade safely with us*
Freesignals

TRUMP!!!Hello friends
Considering the good growth we had, you can see that the price could not continue the growth of the hood and it has fallen. Now it is suspected of a head and shoulders pattern. I repeat, it is suspected of a head and shoulders pattern. The pattern has not yet formed.
If the price breaks the designated resistance, the price can move to the specified targets and if the resistance is broken, I will update it for you.
*Trade safely with us*

SPX BUY MARKETHello friends
Given the decline we had, the price was well supported in the support range and broke its resistance with a strong wedge, showing that buyers entered and it can move to the specified targets.
Observe risk and capital management.
*Trade safely with us*

LTC SUPPORT AND RESISTACEHello friends
Due to the rise we had, the price is in a correction phase and now we have identified the support areas for you that can move to the set targets if they stabilize in these areas and the specified resistance is broken.
*Trade safely with us*

EUR/USD ; SHORT!Hello friends
Well, you see that the price is moving in a channel regularly and in this area, the ceiling of the channel, we are waiting for a price correction at the bottom of the channel.
If the channel breaks validly from above, the price can grow well.
*Trade safely with us*

DOT; BUY OR SELL?Hello friends
Given the good growth we had, the price has formed a triangle, and if the triangle breaks, the price can move to the specified targets.
If the price falls, we have two excellent support areas that the price will definitely react to.
*Trade safely with us*

TREE Stock Long Position Confirmed Monday 8/4/25Hello,
Ayrfolio trade ideas are based on weekly charts and momentum, so remember to be patient! No day trades here unless the stock soars up intraday! Today we’re covering:
STOCK SYMBOL: TREE
POSITION: Long
TP1 Risk-Reward Ratio: 1.39
TP2 Risk-Reward Ratio: 2.79
Stop Loss: must wait AFTER daily candle closes to exit trade (regular candle, NOT Heiken Ashi)
Ultimate Stop Loss: can exit IMMEDIATELY if price reaches this level during any trading hours
EXPLANATION: Weekly momentum increased and confirmed on Monday 8/4/25 at $54.17/share. Although the stop losses are listed on the chart, if momentum has been lost then we can exit before the price reaches the stop loss.
DISCLAIMER: Please do your own due diligence before making any decisions.
P.S. - Stocks can soar. YOU can soar. Soaring is possible!
-Ayrfolio

GBPJPYHello friends
Given the upward trend we are having, you can see that the price is stuck in this resistance area and every time it hits it, the price corrects itself. Now that the price has risen from the strong bottom, we need to see if it can finally break the resistance or not?
In case of a valid resistance break, the price can move to the specified targets.
But if this time the price fails to break the resistance and corrects, we will have to see how the indicated support will work.
*Trade safely with us*

ETHFI ; Has purchase confirmation been given?Hello friends
Given the decline we had, the price has been in a good support and then managed to break through its resistance and now in the pullback we need to see the reaction of the buyers. If the Fibonacci support is maintained, the price can move to the specified Fibonacci steps, which has been specified.
Don't forget capital and risk management.
*Trade safely with us*

ENA ; SIGNALHello friends
Given the good growth we had, now the price can move to the set targets if it is fixed in the specified support areas.
*Trade safely with us*

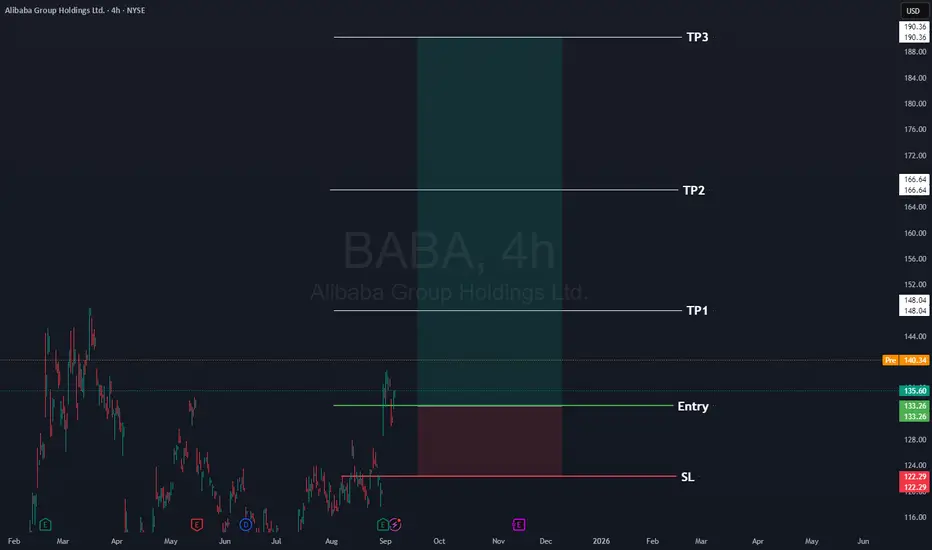
Alibaba Long $BABAHere's a free stock signal for you. Occasionally we like to give a free signal. This was posted to our subscribers
Stock: Alibaba
Stock Code NYSE:BABA
📈Entry: 133.26
⚠️SL: 122.29
✔️TP1: 148.04
✔️TP2: 166.64
✔️TP3: 190.36
Hope you earn lots of money
Sarah
CEO ETAforex
SNX ; BEARISH!!!Hello friends
Given the growth we had, you can now see that the price ended the trend at the ceiling of a large candle and the sellers covered it with another large candle.
Now we have a resistance area in the middle of this candle from which the price is expected to correct and move to the specified targets.
*Trade safely with us*

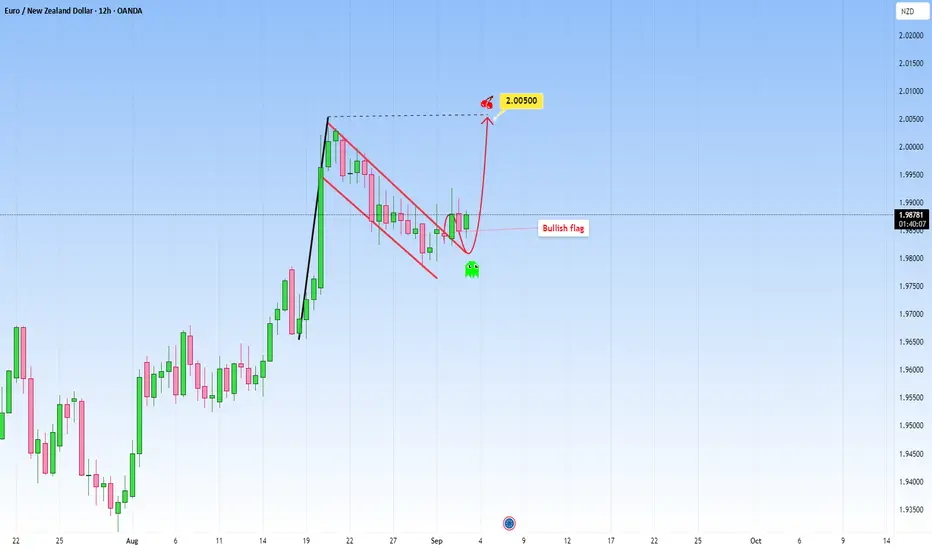
EURNZD: Rose steadily and created a Bullish FlagEURNZD looks quite interesting at the moment. Price rose to the upside steadily and now seems to have created a well known pattern: a bullish flag.
My expectation is for the price to continue, but first I would wait for a full strong candle to confirm the signal. I would target 2.00500.
If, on the other hand, price will decline below the flag, that would invalidate the continuation, and we can expect a short-term pullback incoming.
What do you think?
Tag / usdtGATEIO:TAGUSDT
You can see the support and next resis Level.
Disclaimer : Not Financial Advice.

COFFEE could turn around big timePrice on COFFEE looks very interesting at the moment, this latest move broke the narrative of a downtrend.
The most recent interaction with the downtrend is particularly interesting, because it's already showing early signs of consolidation, decreased bearish momentum. What may follow: retest of trendline, low-volume candles suggesting exhaustion, all aligning for potential upwards.
My target would be toward 350$ where we have a clear zone. If this move plays out, it will make a beautiful switch of a narrative that’s we've been seeing for COFFEE. This is what makes the setup so compelling. It’s a "story being shown".
Though a scenario for more downside is possible. Still, I am taking the side for more upside because such decrease is not sustainable long without a correction.
Disclosure: I am part of Trade Nation's Influencer program and receive a monthly fee for using their TradingView charts in my analysis.

TONCOIN ; Will the pump price finally be fixed?Hello friends
Well, you see that after the decline we had, the price has reached the range that we have specified for you.
In this range, the price once attacked the ceiling of the range, but the failure was fake, which we have also specified.
Now, in this movement, the buyers must see again whether the range will finally be broken or not?
In the event of a valid failure of the trading range, the price can easily move to the specified resistances.
*Trade safely with us*

Rion / UsdtGATEIO:RIONUSDT
This Mf will Explode soon..
Disclaimer : Disclaimer : Not Financial Advice

AVAX: GOOD PRICE!!!Hello friends
Given the arrival of buyers and the good price growth, now that we are in a price correction, there is a good opportunity to buy in steps in the specified areas with risk and capital management and move towards the specified goals.
*Trade safely with us*

SUI : Heavy fall or stunning growth!Hello friends
Given the good growth we had, the price has pulled back well and has managed to hold itself well in the specified support area.
Now, given the lack of decline and weakening of sellers, we must wait for the reaction of buyers to see whether they will support the price in the support areas or not?
Given the good conditions of the currency pair, I buy in steps in the support areas and move with it to the specified goals, with capital and risk management.
*Trade safely with us*

SOL : I want to shop in these areas.Hello friends
Well friends, after a few hunts for the channel, the buyers finally broke the channel and the task was clear.
Now, with the price growth and correction we had in the areas identified as channel price pivots, I want to buy and move with it to the specified targets.
*Trade safely with us*

XRP *UPDATE*Hello friends
After the drop we had, the price was supported by buyers in the support area marked with Fibonacci and is now near an important resistance that if this resistance is broken, the price can grow to the specified limits.
The specified support areas are good points where you can buy in steps and with risk capital management.
*Trade safely with us*

ADA : BUY OR SELL?Hello friends
Well, after the decline we had, the price was able to create a small channel in the specified support area, which indicates the accumulation of the price, and if the support is maintained and the channel is broken, the price can move to the specified targets.
Otherwise, and if the support is broken, the decline will continue with a valid formation...
*Trade safely with us*

DOGE IN SHORT TIME Hello friends
After the good growth we had, you can see that the price has dropped the same amount and has not broken the support range validly, and it just wanted to collect the liquidity below this support and then formed an ascending channel, which if the price channel breaks, can move to the specified targets.
*Trade safely with us*
