🇪🇺 EUR/USD — Fundamental Outlook: Constructive / Bullish BiasThe euro continues to benefit from the shift in relative monetary policy. While the Fed is preparing to ease, the ECB remains on hold near 2%, with little pressure to act as Eurozone inflation gradually normalizes. Although growth remains subdued, the ECB is expected to maintain restrictive settings to anchor inflation expectations, providing relative yield support to the EUR.
JPMorgan and Goldman Sachs have reiterated their bullish EUR/USD forecasts, projecting levels between 1.18–1.20 in the next 12 months, citing policy convergence, diversification flows out of U.S. assets, and the euro’s undervaluation. September’s flash HICP (due Sep 2) will be crucial: a stable reading should reinforce the ECB’s stance and underpin EUR/USD.
➡️ Bias: EUR/USD remains a buy-on-dips candidate, with the Fed’s dovish pivot and steady ECB policy driving upside.
Fundamental-analysis

DX1! (US Dollar Index) — Fundamental Outlook: Bearish BiasThe U.S. dollar remains under sustained pressure as markets move into September. The Federal Reserve has signaled readiness to deliver its first rate cut in September, following confirmation that July PCE inflation remained steady at 2.6% y/y, while consumer spending continued to soften. This combination supports the case for monetary easing to protect the labor market and broader economic momentum.
Positioning data show that the market is already heavily short USD, creating short-term risk of squeezes on stronger-than-expected U.S. data — particularly the September 5 NFP release, which could delay the Fed’s easing trajectory if labor proves resilient. However, the medium-term consensus across major investment banks (JPMorgan, Citi, Goldman Sachs) is that the dollar will weaken further as the Fed embarks on a cutting cycle while the ECB, BoE, and SNB remain relatively more cautious.
➡️ Bias: Sell rallies in DX1! with tactical awareness of NFP risk. Medium-term bearish trend intact, Fed easing the dominant driver.

BTCUSD Short Opportunity, Bears Take Control BTCUSD is currently trading around 116,980, facing strong rejection near the 117,200–117,500 resistance zone. The recent price action suggests that sellers are gaining control as bullish momentum fades. A sustained move below 116,800 could trigger further downside pressure, pushing Bitcoin toward 115,500 and 114,800 in the short term. If the bearish structure remains intact, the next major target lies near the psychological level of 110,000, which aligns with previous demand zones and a key Fibonacci retracement level. Stop-loss should ideally be placed above 117,600 to protect against any false breakouts. Watch for increased volatility during US trading hours and upcoming macroeconomic data releases, as these could accelerate the move. Overall bias remains strongly bearish as long as BTC trades below 117,500.

BTCUSD 1D Chart1. Price Trend and Structure
The BTC price has fallen below the yellow uptrend line – this indicates a break in the bullish structure and signals weakening buyers.
Currently, the price is hovering around $107,950, which is local support (red zone ~108k).
Next important supports:
$104,500 – $103,900
$98,400 (recent stronger demand level + near the 200 SMA).
Resistance to break:
$113,500 (green line, previous support now acts as resistance).
$118,000 (key level for a return to the uptrend).
$124,500 (highs).
2. Moving Averages
SMA 50 (green) and SMA 200 (blue) → classic trend analysis:
The price is currently below the SMA 50, confirming short-term weakness.
The SMA 200 (~$100,300) is still maintaining the long-term trend – only a break below would signal a more serious bear market.
Possible scenario: If the SMA 50 begins to decline and approaches the SMA 200 → a Death Cross threatens.
3. MACD
Negative histogram, signal line below zero → downward momentum continues.
No signs of a reversal (no positive divergence yet).
4. RSI
RSI ~47 – neutral zone, slightly below 50 → not oversold, but showing an oversold market.
The RSI previously rebounded from the ~70 line (overheating) and is now heading down.
5. Key Levels
Support:
108,000 (current)
104,500
98,400 (strategic)
Resistance:
113,500
118,000
124,500
📊 Scenarios
Bearish (more likely now):
If 108,000 fails → a test of 104,500, and in the longer term, 98,400 USD.
A break below 98,000 would signal a long-term downtrend.
Bullish (less likely at this point):
A return above 113,500 and a daily candle closing above this level → a signal for a reversal and a possible re-entry into the 118–124k range.

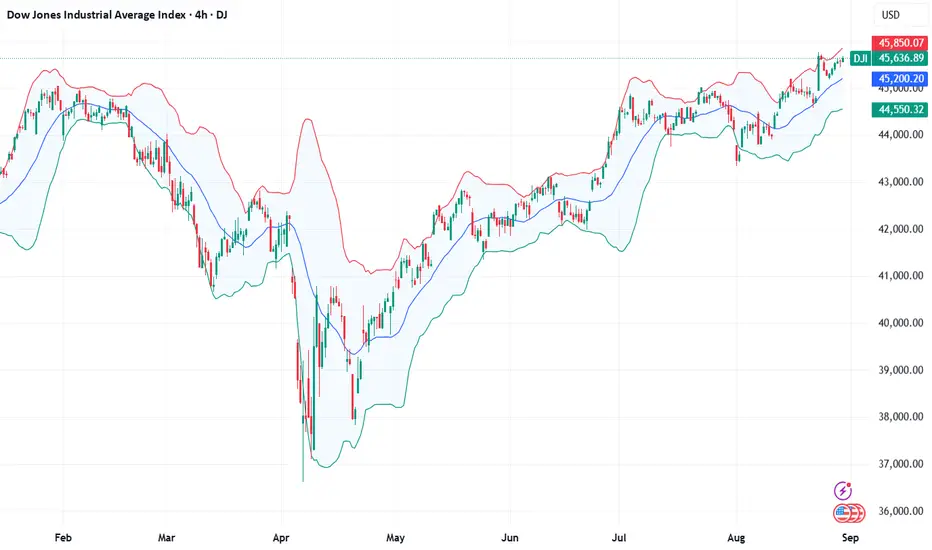
#DJI30 hits record highs: The index just made history!On August 22, 2025, the #DJI30 surged past 45,700, setting a new all-time high. The rally was fueled by growing expectations of a Fed rate cut, with cheap money once again making stocks attractive. Strong earnings reports from industrial and banking sectors, along with new White House infrastructure investment plans, added to the bullish sentiment. A solid labor market and resilient consumer activity continue to ease recession fears, prompting capital to flow out of volatile assets and into blue-chip stocks. As a result, #DJI30 posted a powerful breakout and reinforced its role as a key barometer of U.S. economic strength.
Why the #DJI30 rally may still have room to run:
Easing Fed policy: Lower rates and controlled inflation create favorable conditions for borrowing and investing.
U.S. infrastructure expansion: Government spending on transport, energy, and digitalization supports real-sector companies — the core of #DJI30.
Strong corporate earnings & dividends: Many Dow components offer reliable dividends, making the index attractive amid broader market volatility.
Shift from risky assets: Funds and individual investors are rotating out of crypto and growth stocks into more stable “industrial giants.”
U.S. geopolitical resilience: Despite global tensions, the U.S. remains a “safe haven” for investors, boosting demand for American equities.
The continued rise of #DJI30 is underpinned by robust corporate profitability and the overall resilience of the U.S. economy. The latest earnings season confirmed the strength of major industrial and financial players, while easing inflation and expectations of a Fed rate cut provide a supportive backdrop. #DJI30 remains a reliable gauge of market stability and investor risk appetite worldwide. According to FreshForex, this opens a window of opportunity for long positions on #DJI30.
Fundamental Market Analysis for August 29, 2025 EURUSDEUR/USD is losing ground after three days of decline, trading around 1.1660 during Asian hours on Friday.
The EUR/USD pair is depreciating amid a recovery in the US dollar (USD) due to US economic growth in the second quarter. Annual gross domestic product (GDP) in the US grew by 3.3% in the second quarter, exceeding initial estimates of 3.1% and the previous 3.0%.
However, the US dollar may face difficulties amid renewed dovish sentiment regarding the prospects for Federal Reserve (Fed). According to Reuters, Fed member Christopher Waller said on Thursday that he would support lowering interest rates at the September meeting and further cuts over the next three to six months to prevent a collapse in the labor market.
Concerns about the Fed's independence have intensified following recent statements by US Vice President Jay D. Vance. He noted: "I don't think we should allow bureaucrats to make decisions about monetary policy and interest rates without taking into account the opinions of people who were elected to serve the American people... The US president is much better equipped to make such decisions."
Trade recommendation: BUY 1.1690, SL 1.1610, TP 1.1790

CAD/JPY - Channel Breakout (29.08.2025)The CAD/JPY Pair on the M30 timeframe presents a Potential Selling Opportunity due to a recent Formation of a Channel Breakout Pattern. This suggests a shift in momentum towards the downside in the coming hours.
Possible Short Trade:
Entry: Consider Entering A Short Position around Trendline Of The Pattern.
Target Levels:
1st Support – 106.47
2nd Support – 106.30
🎁 Please hit the like button and
🎁 Leave a comment to support for My Post !
Your likes and comments are incredibly motivating and will encourage me to share more analysis with you.
Best Regards, KABHI_TA_TRADING
Thank you.
Disclosure: I am part of Trade Nation's Influencer program and receive a monthly fee for using their TradingView charts in my analysis.

GBP/CHF - Wedge Breakout (28.08.2025)The GBP/CHF pair on the M30 timeframe presents a Potential Buying Opportunity due to a recent Formation of a Wedge Breakout Pattern. This suggests a shift in momentum towards the upside and a higher likelihood of further advances in the coming hours.
Possible Long Trade:
Entry: Consider Entering A Long Position around Trendline Of The Pattern.
Target Levels:
1st Resistance – 1.0862
2nd Resistance – 1.0877
🎁 Please hit the like button and
🎁 Leave a comment to support for My Post !
Your likes and comments are incredibly motivating and will encourage me to share more analysis with you.
Best Regards, KABHI_TA_TRADING
Thank you.
Disclosure: I am part of Trade Nation's Influencer program and receive a monthly fee for using their TradingView charts in my analysis.

USDJPY longs due to better than expected Eco dataFor the week ending August 23, 2025, U.S. initial jobless claims were 229,000, below the forecast of 231,000 and down from the previous week's revised figure of 234,000. This suggests a slight improvement in new unemployment filings.
Real gross domestic product (GDP) increased at an annual rate of 3.3 percent (0.8 percent at a quarterly rate) in the second quarter of 2025 (April, May, and June), according to the second estimate released by the U.S. Bureau of Economic Analysis.
Due to the above data being better than expected, we can expect the dollar to increase in strength over the short term.
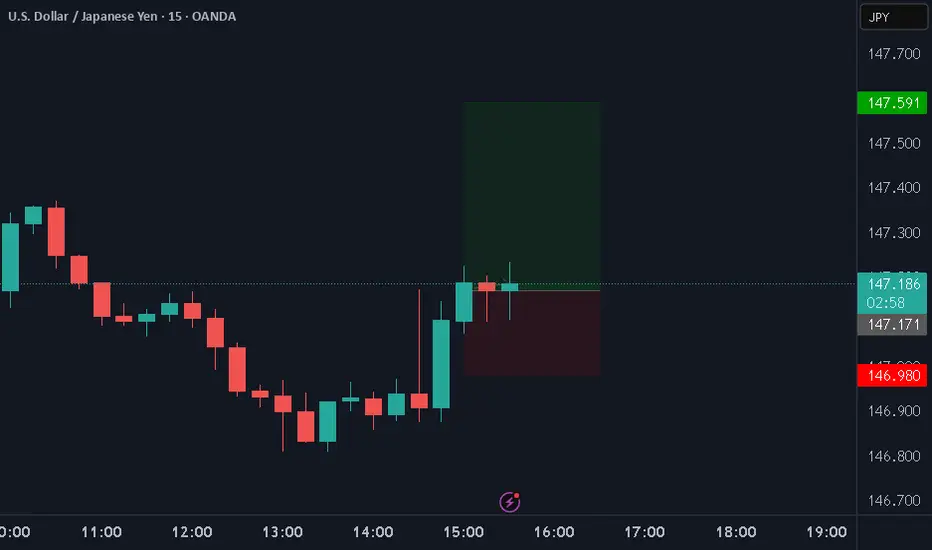
Fundamental Market Analysis for August 28, 2025 USDJPYThe yen remains under pressure due to the persistent yield differential between the US and Japan and the Bank of Japan’s cautious approach to policy normalization. The lack of readiness to tighten quickly supports carry dynamics and keeps USD/JPY near the top of its recent range whenever the dollar is stable.
In the US, expectations for a rate cut this autumn coexist with still-meaningful Treasury yields, limiting near-term JPY strength. Flows into dollar assets under a steady risk backdrop add support, while Japanese data (including Tokyo CPI later this week) could only briefly temper dollar demand unless it surprises decisively.
Our base case is for an orderly push toward 148.000+ provided the news backdrop remains calm and there are no signs of imminent intervention by Japanese authorities. Risk factors include a sharp drop in US yields or renewed “verbal intervention” from Japan’s Ministry of Finance.
Trading recommendation: BUY 147.150, SL 146.650, TP 148.150

XAUUSD📈 XAUUSD – 1H Timeframe
🟢 Long Call/ Bullish Candle
🔹 Gold is forming HH & HL (Higher Highs & Higher Lows) on the 1H chart → Uptrend structure intact.
🔹 Fib Retracement Setup → Perfect dip-buy opportunity from CMP (Current Market Price).
💡 Plan:
👉 Buy from CMP 🎯
👉 Book partial profits on resistance levels 🪙
👉 SL below Fib retracement 🔒
🌍 Weekly Fundamental Drivers:
1️⃣ Fed remains cautious on rate cuts, supporting safe-haven demand 🏦
2️⃣ Geopolitical uncertainty & central bank gold buying continue to give long-term bullish momentum 🌐
⚠️ Risk Management: Stay disciplined — let structure + fundamentals guide your trade.

Fundamental Market Analysis for August 27, 2025 GBPUSDSterling is trading steady around 1.34500 against a restrained dollar: markets continue to price a higher probability of Fed policy easing after increased political pressure on the U.S. regulator. Lower short-term U.S. yields reduce the premium in favor of the USD, which supports GBP in the pair.
Domestic U.K. factors are neutral: the Bank of England remains data-dependent, but markets still assume the easing cycle in the U.K. will be more cautious than in the U.S. This expectations differential works in favor of the pound in the near term, unless distinctly dovish signals emerge from London.
Key risks for GBP bulls are unexpectedly hawkish BoE remarks or a strong block of U.S. data, both of which could hand back the initiative to the dollar. For now, the balance of fundamental drivers—from Fed expectations to risk sentiment—supports a scenario of moderate GBPUSD appreciation.
Trading recommendation: BUY 1.34500, SL 1.33750, TP 1.35500

#FTSE100 hits all-time high — what’s next, higher still?On August 22, 2025 , #FTSE100 closed at an all-time high of 9355.60 points . The main driver of growth was a surge of foreign capital, especially from U.S. investors seeking undervalued assets and boosting demand for UK equities. Defense and commodity companies led the rally, adding optimism amid strong corporate earnings and high dividends. Some bank stocks corrected lower, but the weight of industrial and export-oriented leaders was enough to push the index to record territory.
Why the FTSE 100 is setting new records: 5 growth factors:
Strong UK macroeconomic indicators: Steady GDP growth and a narrowing trade deficit reinforce the foundation for further #FTSE100 gains.
Inflow of foreign investments: Massive capital inflows from the U.S. and other countries have shifted focus and funds into UK equities, strongly supporting the index.
Outperformers among exporters and defensive sectors: Growth in defense, mining, and financial companies provided fundamental support to the index’s upward momentum.
Dividend appeal and low valuations: #FTSE100 offers high dividends and relatively low P/E ratios, making it attractive for investors seeking both yield and value safety.
Global diversification and resilience to local risks: The multinational structure of companies and dollar-based revenues shield the index from domestic economic and currency weaknesses, ensuring long-term stability.
The current #FTSE100 rally is the result of a powerful mix: foreign capital inflows, strength in defense and commodity sectors, and appealing dividends against a backdrop of moderate global rate policy. FreshForex analysts note that if investment flows persist and corporate leaders continue to deliver strong earnings and buybacks, the index may remain near record highs.

VIX- Cơ Hội Lợi Nhuận Vẫn Còn 37%++Investment Outlook
Reference Price: 34,850
Target Price: 48,000
Upside Potential: +37.7%
As one of the hottest gainers in 2025 with a breakout rally since July, the stock has already tripled from its base price. Yet, upside potential remains over 37%, supported by robust trading momentum and a market capitalization that has been re-rated to over VND 70 trillion.
VIX’s Q3 earnings are expected to be highly promising, as both its proprietary trading portfolio and margin lending activities continue to set new highs in line with the VN-Index’s more than 50% year-to-date surge.

Fundamental Market Analysis for August 26, 2025 EURUSDEUR/USD is holding onto its gains after rising more than three-quarters of a percent in the previous session, trading around 1.1630 during Asian hours on Tuesday.
President Trump posted a letter on social media Tuesday morning announcing that he was removing Fed Governor Cook from the Fed's board of directors. However, Cook said she would not resign because there was no reason for her dismissal. “I will continue to fulfill my duties,” she added.
President Trump also warned that he could impose a 200% tariff on Chinese goods if China refuses to supply magnets to the US. In addition, Trump threatened “additional tariffs” and restrictions on the export of advanced technologies and semiconductors in response to digital services taxes that have hit US technology companies.
The EUR/USD pair is strengthening as the euro (EUR) receives support after the European Central Bank (ECB) signaled a pause in monetary policy easing amid a strengthening labor market in the eurozone. Meanwhile, details of the agreement between the EU and the US indicate that a 15% tariff will be imposed on most European goods, while cars, pharmaceuticals, and semiconductors may be exempt from tougher US duties.
Trade recommendation: BUY 1.1655, SL 1.1585, TP 1.1765

Fundamental Market Analysis for August 25, 2025 USDJPYFollowing dovish-leaning Fed rhetoric, demand for the dollar has eased and U.S. yields have retreated, reducing support for USDJPY. The pair has pulled back from recent highs as markets price a September Fed cut, narrowing the U.S.–Japan yield spread and making long USD positions against the yen less compelling.
Japan’s recent macro data in August has been more resilient than expected, and the Bank of Japan continues a cautious normalization with an emphasis on wages and sustained inflation at target. Against this backdrop, a modest domestic impulse in Japan and lower U.S. yields support the yen. Another factor is the market’s sensitivity to potential verbal interventions from Japan’s Ministry of Finance if the yen were to weaken again.
Near-term, risks for USDJPY are skewed lower: a softer Fed, steadier Japanese data, and the authorities’ intervention risk management create a fundamental case for the pair to decline. Barring a renewed jump in U.S. yields, the probability of further yen strength remains elevated.
Trading recommendation: SELL 147.250, SL 147.950, TP 146.500

EUR/USD Long Setup: Riding the Wave After Powell’s Dovish TalkEUR/USD Long Opportunity Post-Powell Speech
Following Jerome Powell’s dovish remarks at the 2025 Jackson Hole Symposium, the EUR/USD is showing strong bullish potential. With the pair currently trading at 1.16626, I’m looking to enter buy positions targeting a move up to 1.18295. Key Points: Trade Direction: Strictly bullish. I see no reason to sell given the USD weakness post-Powell.
Entry Zone: Buying opportunities around 1.16626 or on a confirmed breakout above 1.1700.
Target: Aiming for 1.18295 (key resistance level).
Stop Loss: Place below 1.1597 to manage risk.
Market Context: The dovish Fed outlook supports EUR/USD upside, making this an ideal week for capturing momentum and passing prop firm trading challenges.
Risk Management: Use 1-2% position sizing to navigate volatility and ensure a favorable risk-reward ratio (targeting at least 2:1).
This setup offers a high-probability trade for swing traders and those aiming to pass funding challenges this week. Stay disciplined and monitor price action around key levels. Disclaimer: Trading involves risk. Always conduct your own analysis and consult a financial advisor.

DHI: Fundamental Analysis +45%With 2024 revenue of $ 36.80 billions, D. R. Horton is an american homebuilding company. EverStock identifies a fundamental revaluation potential of + 45 %.
Valuation at 10.1 x net earnings :
Currently valued at $ 48.26 millions in market capitalization, D. R. Horton posted a profit of $ 4.76 billions in its latest fiscal year (2024).
Balance sheet and debt :
In the company annual report, tangible net asset value stood at $ 25.15 billions, giving a market capitalization / tangible net asset value ratio of 1.92.
The gearing ratio is good, at 0.24. (Total financial debt / net tangible assets valuation).
Current share price: 161.87 $
Target price : 235.36 $
Upside potential : + 45 % (including dividende income)
Dividend : 1.60 $ (0.40 $ per quarter)
Yield : 0.99 %

Fundamental Market Analysis for August 22, 2025 GBPUSDSterling is under pressure as the dollar stays resilient on expectations of cautious Fed messaging at Jackson Hole. Stronger components in recent U.S. business surveys tempered hopes for aggressive easing, while U.S. Treasury yields held above recent lows—typically a headwind for lower-yielding currencies such as GBP. The market continues to prefer U.S. domestic assets until Powell’s stance becomes clearer.
The U.K. backdrop offers limited offset: signs of softer domestic demand and a cooling labor market raise doubts about the economy’s ability to shoulder restrictive rates. Attention today also falls on government debt auctions and European business activity prints, which can indirectly affect risk sentiment and cable through broader capital flows.
With these forces intersecting, GBPUSD retains a bearish bias within today’s “stronger-dollar” narrative: yield differentials, guarded Fed expectations, and the pound’s sensitivity to global risk keep upside contained. Unless an upside surprise emerges from U.K. data or a distinctly dovish signal from the Fed, selling rallies with moderate targets remains a prudent tactical stance.
Trade recommendation: SELL 1.34000, SL 1.34500, TP 1.33100

GBP/JPY - Breakout (22.08.2025)The GBP/JPY TRADENATION:GBPJPY pair on the M30 timeframe presents a Potential Buying Opportunity due to a recent Formation of a Breakout Pattern. This suggests a shift in momentum towards the upside and a higher likelihood of further advances in the coming hours.
Possible Long Trade:
Entry: Consider Entering A Long Position around Trendline Of The Pattern.
Target Levels:
1st Resistance – 200.02
2nd Resistance – 200.42
🎁 Please hit the like button and
🎁 Leave a comment to support for My Post !
Your likes and comments are incredibly motivating and will encourage me to share more analysis with you.
Best Regards, KABHI_TA_TRADING
Thank you.
Disclosure: I am part of Trade Nation's Influencer program and receive a monthly fee for using their TradingView charts in my analysis.

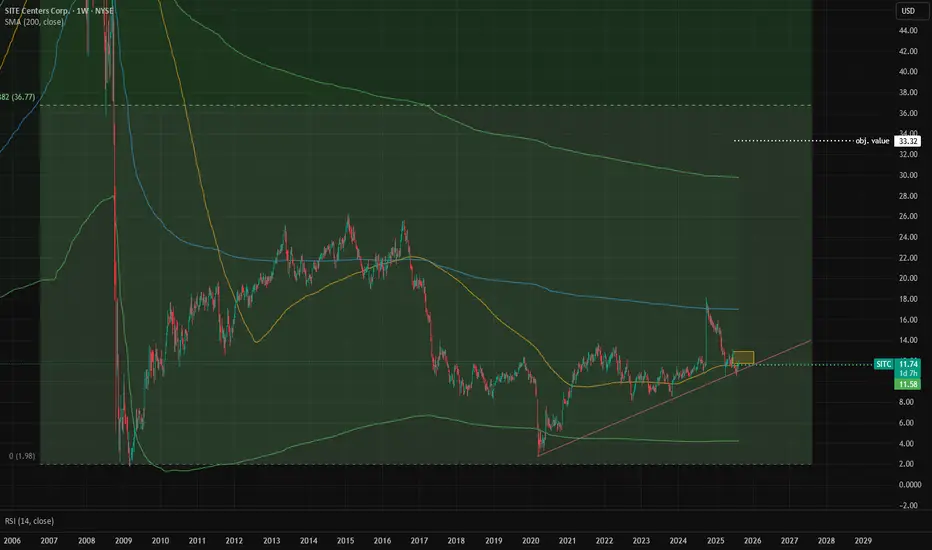
SITC: Fundamental Analysis +182%With 2024 revenue of $ 277 millions, Site Centers is an american owner and manager of open-air shopping centers. EverStock identifies a fundamental revaluation potential of +182 %.
Valuation at 1.2 x net earnings :
Currently valued at $ 622 millions in market capitalization, Site Centers posted a profit of $ 532 millions in its latest fiscal year (2024).
Balance sheet and debt :
In the company annual report, tangible net asset value stood at $ 505 millions, giving a market capitalization / tangible net asset value ratio of 1.23.
The gearing ratio is good, at 0.60. (Total financial debt / net tangible assets valuation).
Current share price : 11.83 $
Target price : 33.32 $
Upside potential : +182 % (including dividende income)
Dividend : Next dividende (special) 3.25 $ paid on 29 august
Yield : 27.47 % (special dividend)
EURGBP short due to weak Euro area PMI and Strong UK PMI DataThe most recent Euro Area Services PMI data available is for August 2025, showing a value of 50.7, down from 51.2 in July 2025, and slightly below the forecast of 50.8. This indicates a slight slowdown in the services sector's expansion, as a reading above 50 still denotes growth, but the drop suggests a loss of momentum.
The most recent data for the UK Services PMI, specifically the S&P Global/CIPS Services PMI for August 2025, is 53.6, surpassing the forecast of 51.8 and improving from the previous reading of 51.8 in July 2025. This indicates a stronger expansion in the UK services sector, reflecting robust business activity.
Due to the above economic data result, we expect the Euro to weaken against the Pound.
This is a classic example of trading strong data vs weak data.

Fundamental Market Analysis for August 21, 2025 EURUSDThe euro is trading around 1.16500 and remains under pressure due to persistently higher yields on dollar assets and the divergence in rhetoric between the Fed and the ECB. In the U.S., a “higher for longer” rate scenario persists amid the slow decline in core inflation and still robust consumer demand, which supports inflows into Treasuries and the dollar. Remarks from some Fed officials indicate that premature easing could destabilize progress on inflation, so the market maintains a premium for dollar rates.
In the euro area, the picture is softer: weak German industrial dynamics and downward revisions to growth and inflation forecasts reinforce expectations of further ECB easing over the coming months. The growth and yield differential continues to work against the euro, especially against the backdrop of a widening negative real-rate spread. Additional pressure comes from sluggish credit demand and companies’ cautious investment stance amid geopolitical uncertainty and high energy costs.
Fiscal debates in key eurozone economies increase the risk premium, whereas the U.S. shows more resilient macro dynamics: retail sales and the labor market remain strong enough to support the dollar. Taken together, this cements a fundamentally bearish tilt for EURUSD in the short term until signs appear of an accelerated U.S. cooldown or more hawkish signals from the ECB.
Trade idea: SELL 1.16500, SL 1.16700, TP 1.15500
