Fundamental Market Analysis for July 14, 2025 EURUSDThe euro remains under pressure: on Monday the pair slipped to 1.16750 after the European Commission extended its pause on retaliatory tariffs against the United States until 1 August. With no resolution in sight, the trade dispute keeps European exporters on edge and turns the dollar into a safe-haven choice for investors looking to limit risk.
Additional support for the greenback comes from rising real yields. The 10-year U.S. Treasury rate is holding above 4.40 %, locking in a wide spread over German Bunds. That has led futures traders to price in just one 25 bp Federal Reserve rate cut for the rest of the year, reducing the euro’s relative appeal.
Macro data from the euro area offer little relief. German industrial production rose only 0.2 % m/m in May, while the July ZEW expectations index slid back into negative territory. With the ECB having already delivered a June cut and projecting lower inflation ahead, inward capital flows to the eurozone remain subdued.
Trading recommendation: SELL 1.16750, SL 1.17050, TP 1.16200
Fundamental-analysis

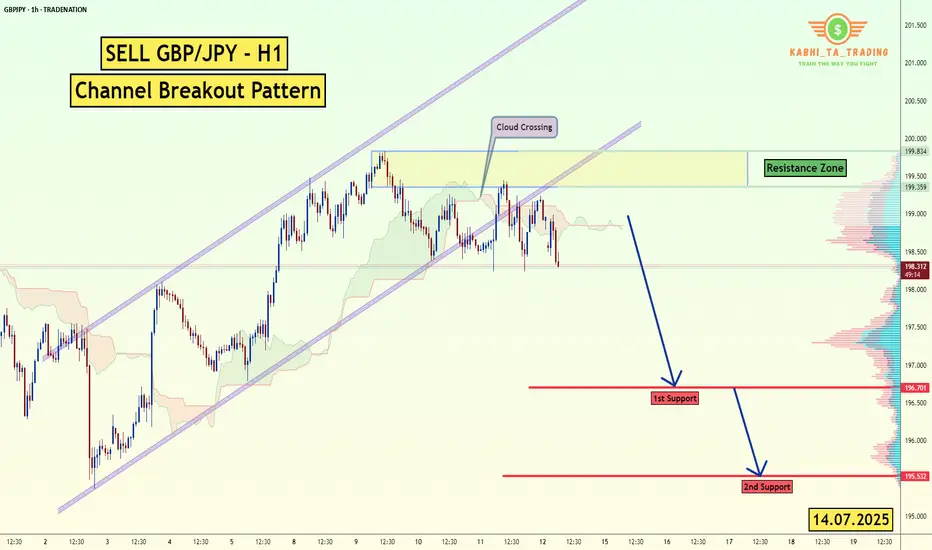
GBP/JPY -H1- Channel Breakout (14.07.2025)The GBP/JPY Pair on the H1 timeframe presents a Potential Selling Opportunity due to a recent Formation of a Channel Breakout Pattern. This suggests a shift in momentum towards the downside in the coming hours.
Possible Short Trade:
Entry: Consider Entering A Short Position around Trendline Of The Pattern.
Target Levels:
1st Support – 196.70
2nd Support – 195.53
🎁 Please hit the like button and
🎁 Leave a comment to support for My Post !
Your likes and comments are incredibly motivating and will encourage me to share more analysis with you.
Best Regards, KABHI_TA_TRADING
Thank you.
Disclosure: I am part of Trade Nation's Influencer program and receive a monthly fee for using their TradingView charts in my analysis.
USD/JPY - H1- Wedge Breakout (07.07.2025)The USD/JPY pair on the H1 timeframe presents a Potential Buying Opportunity due to a recent Formation of a Wedge Breakout Pattern. This suggests a shift in momentum towards the upside and a higher likelihood of further advances in the coming hours.
Possible Long Trade:
Entry: Consider Entering A Long Position around Trendline Of The Pattern.
Target Levels:
1st Resistance – 148.00
🎁 Please hit the like button and
🎁 Leave a comment to support for My Post !
Your likes and comments are incredibly motivating and will encourage me to share more analysis with you.
Best Regards, KABHI_TA_TRADING
Thank you.
Disclosure: I am part of Trade Nation's Influencer program and receive a monthly fee for using their TradingView charts in my analysis.

GBP/USD - H1- Bearish Flag (07.07.2025)The GBP/USD Pair on the M30 timeframe presents a Potential Selling Opportunity due to a recent Formation of a Bearish Flag Pattern. This suggests a shift in momentum towards the downside in the coming hours.
Possible Short Trade:
Entry: Consider Entering A Short Position around Trendline Of The Pattern.
Target Levels:
1st Support – 1.3520
2nd Support – 1.3460
🎁 Please hit the like button and
🎁 Leave a comment to support for My Post !
Your likes and comments are incredibly motivating and will encourage me to share more analysis with you.
Best Regards, KABHI_TA_TRADING
Thank you.
Disclosure: I am part of Trade Nation's Influencer program and receive a monthly fee for using their TradingView charts in my analysis.

Fundamental Market Analysis for July 11, 2025 USDJPYThe dollar is holding steady at 146.500 against the yen: another rise in US yields and stable demand for safe US assets following comments from the Fed are fueling appetite for the USD, while demand for the JPY remains sluggish.
The tariff front exacerbates the imbalance: the White House has already imposed 25% tariffs on Japanese goods, and new ideas for “umbrella” tariffs are heightening fears of a trade war, forcing investors to flow into financing currencies. Reuters notes that the yen weakened to 146.400, recording a weekly decline of more than 1%.
At the same time, the Bank of Japan is not yet ready for aggressive tightening: a decline in inflation to 1.8% y/y and weak real wage dynamics make it difficult to raise rates above 0.5%. The divergence in monetary policy and expectations for Japanese macro data (machine tool orders, industrial production) until July 14 form the fundamental basis for the pair's growth to 147.500 and above, while the risks of correction are limited to the 145.900 zone.
Trading recommendation: BUY 146.500, SL 145.900, TP 147.500

XAG/USD (Silver) - Triangle Breakout (09.07.2025)The XAG/USD (Silver) pair on the M30 timeframe presents a Potential Buying Opportunity due to a recent Formation of a Wedge Breakout Pattern. This suggests a shift in momentum towards the upside and a higher likelihood of further advances in the coming hours.
Possible Long Trade:
Entry: Consider Entering A Long Position around Trendline Of The Pattern.
Target Levels:
1st Resistance – 3749
2nd Resistance – 3781
🎁 Please hit the like button and
🎁 Leave a comment to support for My Post !
Your likes and comments are incredibly motivating and will encourage me to share more analysis with you.
Best Regards, KABHI_TA_TRADING
Thank you.
Disclosure: I am part of Trade Nation's Influencer program and receive a monthly fee for using their TradingView charts in my analysis

GBP/AUD - Bearish Flag (10.07.2025)The GBP/AUD Pair on the M30 timeframe presents a Potential Selling Opportunity due to a recent Formation of a Bearish Flag Pattern. This suggests a shift in momentum towards the downside in the coming hours.
Possible Short Trade:
Entry: Consider Entering A Short Position around Trendline Of The Pattern.
Target Levels:
1st Support – 2.0671
2nd Support – 2.0607
🎁 Please hit the like button and
🎁 Leave a comment to support for My Post !
Your likes and comments are incredibly motivating and will encourage me to share more analysis with you.
Best Regards, KABHI_TA_TRADING
Thank you.
Disclosure: I am part of Trade Nation's Influencer program and receive a monthly fee for using their TradingView charts in my analysis.

Fundamental Market Analysis for July 10, 2025 GBPUSDEvent to watch today:
15:30 EET. USD - Initial Jobless Claims
GBPUSD:
The British pound remains under pressure amid increased risk-off sentiment linked to new White House statements about additional tariffs from August 1. This is boosting demand for the US dollar as a safe haven and prompts investors to take profits on long GBP positions.
Domestic factors in the UK also have a negative impact: revisions to social spending programs and weak manufacturing PMI and retail sales data signal a slowdown in economic activity. The Bank of England is expected to keep the rate at 5.50% until year-end, which limits the pound’s attractiveness for investors.
The current GBP/USD rate is 1.35900. In the absence of positive drivers from the UK economy and persistent demand for the dollar, the pair remains vulnerable to further declines toward 1.3520.
Trade recommendation: SELL 1.36000, SL 1.36300, TP 1.35200

Analyzing the Market with Fundamental and Technical AnalysisAnalyzing the Market with Fundamental and Technical Analysis
In addition to technical analysis, it's important to consider fundamental factors that could influence the market. News releases, economic reports, and central bank decisions can significantly impact price movements.
Fundamental Analysis:
Keep an eye on major economic indicators like NFP, CPI, and interest rate decisions. These factors can drive the market and change its trend direction.
Technical Analysis:
Use tools like EMA, Fibonacci, and Price Action to confirm the trend and identify entry points.
For daily updates and comprehensive market analysis, join my MMFLowTrading TradingView channel, where I combine both technical and fundamental analysis to give you the most accurate insights.
Conclusion:
Identifying market trends in one day doesn’t have to be complicated. By using the right tools like EMA, Fibonacci, and Price Action on TradingView, you can make better trading decisions every day. To take your trading to the next level, join my MMFLowTrading TradingView channel for daily updates, real-time trend analysis, and expert trading signals.
Ready to start trading with precision? Join my MMFLowTrading TradingView channel today for daily market insights and trading setups. Stay updated with real-time analysis, get actionable trading signals, and take your trading skills to the next level. Follow me now on TradingView!
Is a Reversal on the Horizon or a Deeper Correction? 🔘Gold Faces Strong Resistance at 3300 – Is a Reversal on the Horizon or a Deeper Correction? ⭐️
Gold has recently faced a significant price correction after bouncing off key resistance levels. As geopolitical events settle and economic data comes in, the market is now testing crucial support levels. Today’s session could provide important insights into whether gold will maintain its bullish momentum or continue to correct further.
🔹Market Overview – USD Rebounds, Creating Short-Term Pressure on Gold
The US dollar has seen a strong rebound following positive developments in the global trade talks. Several key agreements between major nations, including the US, have been signed, which seem to support the USD in the short term. This has put downward pressure on gold, as traders shift their focus towards a stronger dollar and risk appetite returning to the market.
🔹US inflation data has come in lower than expected, creating room for the Fed to hold off on rate hikes, which helps the dollar further.
🔹FOMC meeting minutes later this week could reveal insights into the Fed's stance on interest rates, which could be key for market direction.
🔹Geopolitical tensions are cooling off slightly, which has reduced demand for safe-haven assets like gold.
🔹Technical Analysis – Gold in a Range-Bound Market, Testing Key Levels
On the H1 chart, gold is forming a clear downward channel between 3360 and 3290, suggesting that the price could continue its correction within this range. If the price stays within this zone, we might see a deeper pullback toward the 3250 region.
However, as always, waiting for confirmation signals before entering any trades is crucial. The false breakout risk is high when the price moves quickly and without clear confirmation from higher timeframes.
🔹Buy Bias in the Short-TermGiven the current technical structure, a buy bias seems more likely than further selling. The market may test 3320-3325 in the near term, with the potential to bounce back if the buying momentum continues to build. Additionally, the rejection wick on the D1 candle from yesterday suggests that sellers are losing control, and we may see more buying pressure in the coming sessions.
🔹Resistance and Support Levels to Watch:
🔺Key Resistance Levels: 3302 – 3310 – 3324 – 3335 – 3361
🔻Key Support Levels: 3275 – 3259 – 3248
⬜️Trading Strategy – Buy and Sell Zones
🔺BUY ZONE:3250 – 3248
🔹Stop Loss: 3244
✔️Take Profit: 3254 → 3258 → 3262 → 3266 → 3270 → 3280 → ????
🔺SELL SCALP: 3303 – 3305
🔹Stop Loss: 3310
✔️Take Profit: 3298 → 3294 → 3290 → 3286 → 3280 → 3270 → 3260
🔺SELL ZONE:3334 – 3336
🔹Stop Loss: 3340
✔️Take Profit: 3330 → 3326 → 3320 → 3315 → 3310 → 3305 → 3300 → ????
🕖Important Notes for Today: FOMC and Trade Policy Updates
With FOMC minutes and other important trade policy updates expected today, it’s crucial to stay alert for any sudden changes in market sentiment. Always ensure that you are adhering to your TP/SL levels to safeguard your account.

ETH/USDT 1W Chart📊 Trend structure (Price Action)
Downtrend (historical):
A series of Lower Highs (LH) and Lower Lows (LL) — a classic downtrend.
Confirmed by the orange downtrend line.
A change in structure — a possible beginning of an uptrend:
A Higher Low (HL) has recently been formed after a Lower Low (LL).
Suggests a possible end to the downtrend and an attempt to break out upwards.
Currently:
The price is testing the upper downtrend line.
A breakout above the orange line may confirm a trend change.
🟢 Key Resistance Levels (Green Lines):
Level Meaning
3.058 USDT Potential target after a breakout from consolidation
2.767 USDT Nearest strong resistance - currently being tested
3.427 USDT Deep resistance level from the previous high (HH)
🔴 Key Support Levels (Red Lines):
Level Meaning
2.234 USDT Nearest support - previous breakout
1.883 USDT Early 2023 support
1.507 USDT Local bottom
1.204 USDT Historical support - LL extreme
📉 Stochastic RSI (Momentum Indicator):
Currently in the overbought zone.
This may suggest a short-term correction before an actual breakout.
However, in a strong uptrend, the indicator may "hang out" in the overbought zone for a long time.
📈 Potential scenario:
If the breakout above 2.767 and the orange trendline holds:
A possible move to 3.058 USDT as the first target.
Extended target: 3.427 USDT (HH).
If the breakout fails:
Correction to 2.234 USDT or lower.
There is a risk of returning to a downtrend.
✅ Bullish signals:
Higher Low (HL) formation after Lower Low (LL).
Testing the upper downtrend line with an attempt to breakout.
Volume is increasing (based on candles).
⚠️ Bearish threats:
Stochastic RSI in the overbought zone.
Breakout not confirmed by 100% (needs a weekly closing candle above 2.767).
Resistance at 3,058 could halt the move.
📌 Conclusion:
Ethereum (ETH) could be on the cusp of a new uptrend, but a breakout above 2,767 USDT is needed for confirmation. If it does, a move to 3,058 and then 3,427 is possible. However, the current overbought level on the Stochastic RSI could signal a short-term correction before the trend gains strength.

GBP/USD - Bearish Channel (07.07.2025)The GBP/USD Pair on the M30 timeframe presents a Potential Selling Opportunity due to a recent Formation of a Bearish Channel Pattern. This suggests a shift in momentum towards the downside in the coming hours.
Possible Short Trade:
Entry: Consider Entering A Short Position around Trendline Of The Pattern.
Target Levels:
1st Support – 1.3545
2nd Support – 1.3485
🎁 Please hit the like button and
🎁 Leave a comment to support for My Post !
Your likes and comments are incredibly motivating and will encourage me to share more analysis with you.
Best Regards, KABHI_TA_TRADING
Thank you.
Disclosure: I am part of Trade Nation's Influencer program and receive a monthly fee for using their TradingView charts in my analysis.

Fundamental Market Analysis for July 8, 2025 USDJPYThe yen remains under pressure from trade frictions. President Donald Trump has confirmed 25 percent tariffs on Japanese goods effective 1 August, fuelling U.S.-inflation expectations and reducing the odds of a near-term Fed rate cut. Ten-year Treasury yields have climbed above 4.45 percent, while the spread over equivalent JGBs hovers near 380 basis points—supportive for the dollar.
Japan’s domestic backdrop offers little relief. Nominal wage growth has slowed for a third straight month, and real household incomes have posted their deepest decline in twenty months. The weak earnings momentum complicates the Bank of Japan’s exit strategy and keeps ultra-loose policy firmly in place, encouraging further capital outflows from the yen.
Against this backdrop, USD/JPY is consolidating above its 100-day moving average around 146.40–146.50. Absent a sudden flight to safe-haven assets, the pair could break 147.00 in the coming sessions, while the 145.950–146.000 zone is widely viewed as an attractive area to add to long positions.
Trading recommendation: BUY 146.250, SL 145.950, TP 147.000

Fundamental Market Analysis for July 4, 2025 EURUSDEvents to pay attention to today:
12:00 EET. EUR - Producer Price Index
EURUSD:
On Friday, during the Asian session, the EUR/USD pair is trading in a narrow range around 1.1760. The main currency pair is showing sluggish dynamics amid the US holiday (Independence Day).
The US dollar (USD) is maintaining its recovery, triggered by better-than-expected non-farm payrolls (NFP) data for June. Data released on Thursday showed that the US economy added 147,000 new jobs, exceeding expectations of 110,000.
The better-than-expected NFP data brought some relief to the US dollar, but this is unlikely to continue as the report shows that private sector hiring is losing momentum. Private employers added 74,000 jobs in June, well below the three-month average of 115,000. This scenario is unlikely to ease the position of several Federal Reserve (Fed) officials, including Vice Chair for Supervision Michelle Bowman, who advocated for lower interest rates at a policy meeting later this month, citing potential risks in the labour market.
In the eurozone, the sharp appreciation of the euro (EUR) has raised concerns that inflation could fall below the European Central Bank's (ECB) 2% target. According to a senior ECB official, ‘the ECB may have to make it clear that too strong a euro could be a problem, as it could cause inflation to hover below target,’ reports the Financial Times (FT).
Trading recommendation: SELL 1.17700, SL 1.18000, TP 1.16900

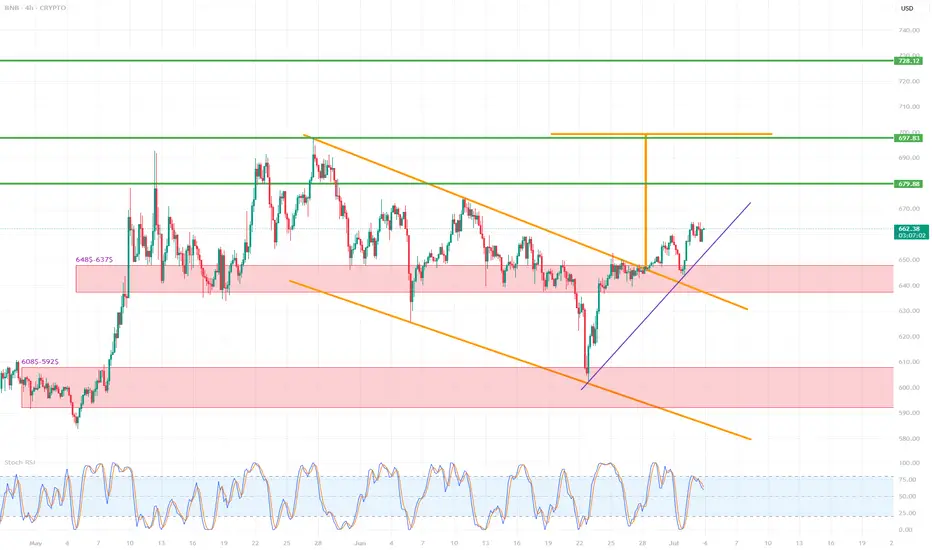
BNB/USD (4h interval)🔍 1. Chart structure
Instrument: Binance Coin / USD (BNB/USD)
Interval: 4 hours
📐 2. Technical formations
🔸 Breakout from the descending wedge formation
The descending wedge (orange lines) is a bullish formation - it suggests a potential breakout upwards.
The breakout occurred dynamically, with a large breakout candle (confirmation of the formation).
The goal of breaking out of the wedge is usually the height of the entire formation - this is marked with an orange arrow.
📈 Breakout range (target): around $697–710
🟢 Potential next targets:
697.83 (local resistance/projection result)
710.73 (main wedge height projection)
728.12 (strong resistance from history)
📊 3. Supports and resistances
🟥 Support zones (red rectangles):
$648.5–637.5 – previous resistance, now tested as support after the breakout.
$608.5–592.5 – strong support from previous lows.
🔼 Currently, the price has tested the upper support zone (648–637), reacted positively and continues to move up.
🟩 Resistance levels (green horizontal lines):
679.88 USD – local resistance, first target after breaking out of the wedge.
697.83 USD – projected range from the formation.
710.73 USD – full technical range of the breakout.
728.12 USD – strong resistance from history, may be a long-term target.
📉 4. Trends and support lines
Purple upward trend line – currently the price is above, which confirms the short-term upward trend.
Its break may lead to a retest of 648–637 USD.
Only below this zone can a larger correction be considered.
📈 5. Stochastic RSI indicator
Currently in the overbought zone (above 80).
Possible temporary cooling – signal for local correction / consolidation.
It is worth waiting for the indicator to go down to around 20 to re-enter the long.
✅ 6. Scenarios
🔼 Bullish (base) scenario:
Staying above 648–637 USD.
Maintaining the uptrend line.
Continuation to 679.88 → 697.83 → 710.73.
🔽 Bearish scenario:
Breaking the purple trend line.
Returning below 648 USD → going down to the 608–592 zone.
Negation of the breakout from the wedge.
📌 Final conclusions
Breaking out from the descending wedge is a strong pro-growth signal.
The price behaves in accordance with technical analysis, testing the previous resistance as support.
Currently, the retest and consolidation phase is underway – maintaining the trend line and the level of $648 will be key.
The medium-term target is $697–710.
Gold Ready to Explode Ahead of NFP and Trump’s “Super Bill”?Gold Ready to Explode Ahead of NFP and Trump’s “Super Bill”? | Global Macro Focus
🌍 MACRO UPDATE – What the World is Watching:
Gold continues its bullish trajectory as the USD weakens sharply following last night’s disappointing ADP jobs report (-33K vs expected +99K). This soft labour data has fueled further speculation that the Fed could begin rate cuts as early as September, with a 90% probability now being priced in.
In the political arena, Donald Trump’s recent statement that House Republicans are aligned to push forward a so-called “Super Bill” has triggered fresh uncertainty around US fiscal policy. This could elevate safe-haven demand for gold, especially if it leads to increased tensions over debt ceilings or government spending.
With the US Non-Farm Payrolls (NFP) due later today and the UK and US markets heading into a long weekend, traders should brace for heightened volatility and liquidity gaps.
📈 TECHNICAL OUTLOOK – What the Charts Are Saying:
Overall Trend: Bullish structure remains intact as gold breaks and holds above 3365.
EMA Setup: Price trades above EMA 13/34/89/200 – signaling strong upside momentum.
Fair Value Gap (FVG): 3374 – 3388 area remains an unfilled FVG zone; possible magnet for short-term price action.
Key Resistance Levels: 3365, 3374, 3380, 3388, 3393
Key Support Levels: 3343, 3335, 3325, 3316, 3304
Trendline & Structure: The ascending trendline from 3316 remains unbroken, providing a potential bounce point if price corrects.
🎯 TRADE SETUPS – Strategic Zones to Watch:
🔵 Buy (Short-Term Scalp):
Entry: 3335 – 3333
SL: 3329
TP: 3340 → 3350 → 3360 → 3370
🟢 Buy Zone (Swing Perspective):
Entry: 3316 – 3314
SL: 3310
TP: 3320 → 3336 → 3350 → 3360
🔴 Sell Scalp (Reversal Zone)
Entry: 3374 – 3376
SL: 3380
TP: 3370 → 3360 → 3350
⚠️ Sell Zone (High-Risk Rejection):
Entry: 3388 – 3390
SL: 3394
TP: 3380 → 3370 → 3360
🔎 NOTE FOR GLOBAL TRADERS:
With UK markets partially closed and US session shortened ahead of the Independence Day holiday, liquidity may be thin and volatility could spike unexpectedly. Always place stop-loss and avoid emotional entries near key resistance.
💬 Do you believe gold can break and close above the FVG zone (3388) before the weekend volatility hits full throttle? Let’s discuss.

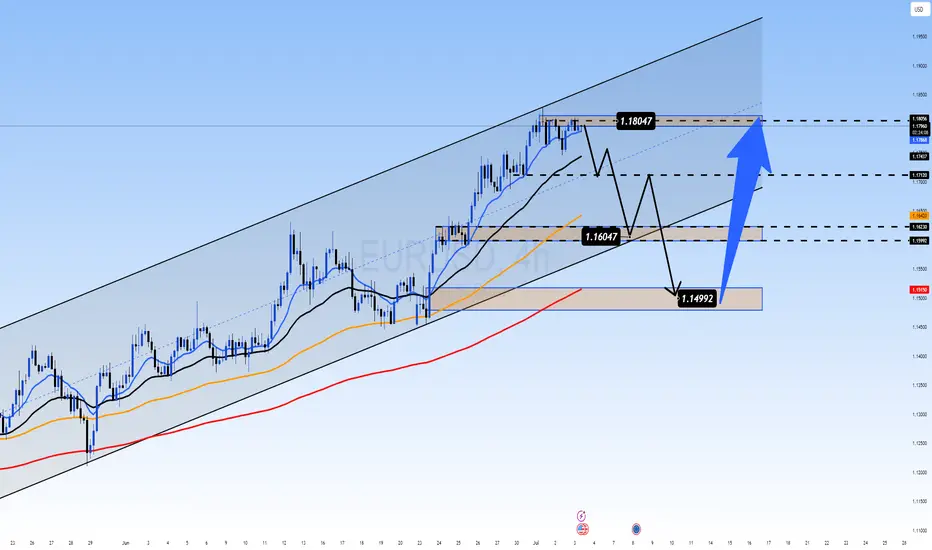
Nearing the Top: A Final Push or Smart Money Liquidity Trap?EUR/USD – Nearing the Top: A Final Push or Smart Money Liquidity Trap?
🌍 MACRO OUTLOOK – EURO CLIMBS WHILE USD TREADS ON UNCERTAIN POLITICAL GROUND:
EUR/USD is trading just below the 1.1700 mark as investors remain cautious about the US dollar's long-term credibility. Growing concerns over the Federal Reserve’s independence — should the “Trump 2.0” scenario unfold — have weighed heavily on USD sentiment across global markets.
Meanwhile, the Euro is gaining support thanks to a relatively hawkish tone from the European Central Bank (ECB). Policymakers appear reluctant to ease policy prematurely, which supports the Euro through expectations of prolonged higher interest rates.
However, with no major catalyst in play yet, traders are watching closely for mid-tier US data and any upcoming statements from ECB officials that might set the tone for the next directional breakout.
📊 TECHNICAL ANALYSIS – H4 TIMEFRAME:
Market Structure: EUR/USD remains in a well-defined ascending price channel. However, the pair is now testing the upper band near the 1.1804 resistance, a key liquidity zone where sellers previously stepped in.
EMA Alignment: Price is trading above the EMA 13/34/89/200 cluster — a strong sign of sustained bullish momentum.
Momentum Indicators:
RSI is hovering near 70 — potential overbought territory.
ADX remains above 25 — confirming trend strength but signaling caution at extended highs.
FVG (Fair Value Gap): A visible unfilled gap between 1.1600 and 1.1640 could act as a magnetic zone for price to revisit before the next impulse move.
🔹 Key Resistance: 1.1804 – 1.1835
🔹 Key Support: 1.1640 – 1.1600 (gap zone)
🔹 Major Demand Zone: 1.1499 – 1.1515
🎯 TRADE PLAN:
Scenario 1 – Buy the Dip (Primary Bias):
Entry: 1.1600 – 1.1640
Stop Loss: 1.1550
Targets: 1.1750 → 1.1800 → 1.1850
Scenario 2 – Buy Deep Pullback:
Entry: 1.1499 – 1.1515
Stop Loss: 1.1450
Targets: 1.1640 → 1.1700
Scenario 3 – Countertrend Sell at Key Resistance (High Risk):
Entry: 1.1804 – 1.1830
Stop Loss: 1.1860
Targets: 1.1720 → 1.1650
📌 Strategic Insight:
EUR/USD may be setting up for either a breakout continuation above 1.1800 or a temporary reversal to sweep liquidity from the lower zones. Momentum favors bulls, but chasing highs without confirmation is risky. Focus on clean retracements and volume-supported entries.
💬 If EUR/USD drops back into the 1.1600 zone, will you load up for another leg higher — or wait for confirmation of trend strength? Share your view in the comments!
Fundamental Market Analysis for July 3, 2025 USDJPYEvent to pay attention to today:
15:30 EET. USD - Non-Farm Employment Change
15:30 EET. USD - Unemployment Rate
15:30 EET. USD - Unemployment Claims
17:00 EET. USD - ISM Services PMI
The Japanese Yen (JPY) traded with a slight positive bias against the bearish US Dollar (USD) during the Asian session on Thursday and remains near the near one-month peak reached earlier this week. Despite the Bank of Japan's (BoJ) hesitation to hike rates, investors seem convinced that the central bank will remain on the path of normalizing monetary policy amid rising inflation in Japan. This is a significant divergence from the stance of other major central banks (including the U.S. Federal Reserve (Fed)), which are leaning towards a softer approach, and is favorable for lower JPY yields.
Meanwhile, US President Donald Trump hinted at a possible end to trade talks with Japan, and also threatened new tariffs against Japan over its perceived reluctance to buy American-grown rice. This, along with the overall positive tone towards risk, is a headwind for the safe-haven yen. In addition, traders seem reluctant and prefer to take a wait-and-see approach ahead of today's release of the closely watched US Non-Farm Payrolls (NFP) report. The crucial data will play a key role in influencing the US Dollar (USD) and will give a significant boost to the USD/JPY pair.
Trade recommendation: BUY 144.00, SL 143.00, TP 145.40

GBP/CHF - Channel Breakout (02.07.2025)The GBP/CHF pair on the M30 timeframe presents a Potential Buying Opportunity due to a recent Formation of a Breakout Pattern. This suggests a shift in momentum towards the upside and a higher likelihood of further advances in the coming hours.
Possible Long Trade:
Entry: Consider Entering A Long Position around Trendline Of The Pattern.
Target Levels:
1st Resistance – 1.0956
2nd Resistance – 1.0996
🎁 Please hit the like button and
🎁 Leave a comment to support for My Post !
Your likes and comments are incredibly motivating and will encourage me to share more analysis with you.
Best Regards, KABHI_TA_TRADING
Thank you.
Disclosure: I am part of Trade Nation's Influencer program and receive a monthly fee for using their TradingView charts in my analysis.

Fundamental Market Analysis for July 2, 2025 GBPUSDOn Wednesday, during the Asian trading session, the GBP/USD pair is trading unchanged at around 1.37450. However, dovish statements by US Federal Reserve Chairman Jerome Powell and growing concerns about the budget may put pressure on the dollar in the near term. Investors are awaiting the ADP report on US employment for June, which will be released later on Wednesday, in the hope of new momentum.
Powell said on Tuesday that the US central bank would be patient about further interest rate cuts, but did not rule out a rate cut at its July meeting, although the decision would depend on incoming data. According to the CME FedWatch tool, short-term interest rate futures now price in the probability of a rate cut in July at almost 1 in 4, up from less than 1 in 5 previously.
Investors are concerned about US President Donald Trump's massive tax and spending bill, which could increase the national debt by $3.3 trillion. The bill will return to the House of Representatives for final approval. Fiscal concerns could dampen optimism and contribute to a decline in the US dollar.
As for the pound sterling, Bank of England (BoE) Governor Andrew Bailey said last week that there are currently signs of a weakening UK labor market and stressed that interest rates are likely to continue to fall. The UK central bank is expected to cut interest rates three times by the end of 2025, bringing them to 3.5% to combat sluggish economic growth and a weakening labor market. Rate cuts are expected in August, September, and November 2025, with possible quarterly reductions.
Trading recommendation: SELL 1.37450, SL 1.37900, TP 1.36750

Fundamental Market Analysis for July 1, 2025 EURUSDEvent to pay attention to today:
01.07 16:30 EET. USD - Federal Reserve Chairman Jerome Powell Speaks
01.07 16:30 EET. EUR - ECB President Christine Lagarde Speaks
01.07 17:00 EET. USD - ISM Manufacturing PMI
EUR/USD is trading in negative territory near 1.1790 in the early European session on Tuesday. The US dollar (USD) is weakening against the euro (EUR) amid growing budget concerns and uncertainty surrounding trade deals.
Four people familiar with the negotiations said US President Donald Trump's administration is seeking to phase in deals with the most involved countries as they rush to reach an agreement by the July 9 deadline. Uncertainty over trade agreements continued to weigh on sentiment and sell the US dollar.
Investors are concerned about the US Senate's attempts to pass Trump's tax and spending cuts bill, which faces intra-party disagreement over a projected $3.3 trillion increase in the national debt. Fiscal concerns have dampened optimism and contributed to the decline in the US dollar. This, in turn, serves as a tailwind for the major pair.
German inflation, as measured by the Harmonized Index of Consumer Prices (HICP), eased to 2.0% y/y in June from 2.1% in the previous reading. The figure was below expectations of 2.2%.
On a month-on-month basis, HICP rose 0.1% in June vs. 0.2% previously, below the market consensus forecast of 0.3%. Softer-than-expected German inflation data may limit near-term growth.
Trade recommendation: BUY 1.1795, SL 1.1725, TP 1.1880

USD/JPY Bearish Flag (30.06.2025)The USD/JPY Pair on the M30 timeframe presents a Potential Selling Opportunity due to a recent Formation of a Bearish Flag Breakout Pattern. This suggests a shift in momentum towards the downside in the coming hours.
Possible Short Trade:
Entry: Consider Entering A Short Position around Trendline Of The Pattern.
Target Levels:
1st Support – 143.40
2nd Support – 142.86
🎁 Please hit the like button and
🎁 Leave a comment to support for My Post !
Your likes and comments are incredibly motivating and will encourage me to share more analysis with you.
Best Regards, KABHI_TA_TRADING
Thank you.
Disclosure: I am part of Trade Nation's Influencer program and receive a monthly fee for using their TradingView charts in my analysis.

Buy IOC short term target 155, 165 & Medium Term tgt 185, 250 Indian Oil Corporation does business in the entire hydrocarbon value chain - from Refining, Pipeline transportation and marketing of Petroleum products to R&D, Exploration & production, marketing of natural gas and petrochemicals. It has the leadership position in the Oil refining & petroleum marketing sector of India.
The company aims to strengthen EV mobility infrastructure by setting up charging points and battery-swapping facilities at its fuel stations. It has also signed a binding term sheet with Panasonic Group to form a JV for manufacturing cells in India.
The company’s R&D is focused on emerging fields such as nanotechnology, Solar, Bioenergy, Hydrogen, etc. It has an effective patent portfolio of 1636. It spent Rs 946 Cr in FY24 on R&D.
The company’s R&D is focused on emerging fields such as nanotechnology, Solar, Bioenergy, Hydrogen, etc. It has an effective patent portfolio of 1636. It spent Rs 946 Cr in FY24 on R&D.
Market Cap ₹ 2,07,370 Cr.
Annual Sales - ₹ 758,106 Cr
Dividend Yield - 8.20 %
Stock P/E - 17.0
Industry PE - 29.2
Debt to equity - 0.82
ROCE - 7.37 %
EPS - ₹ 9.63
Fundamentally, this big company is trading at a very low valuation. The Crude Oil price is expected this year to be on lowest, so we can expect good profit margin and this company is into green energy business so it should have PE multiple of that business as well. We Expect growth in EPS by 30% to 12.5 And re-rating of PE multiple to 20 so that give the share price to ₹ 250 which gives return of 70.88% from current price level of 146.30.
Technically, this is very bullish on weekly, daily timeframe. Price is trading above all short term, medium term averages. It has formed a bullish candlestick pattern on daily and weekly chart, so we expect immediate strong upside to 155, 165 and eventually 185 level and investment target of 250 levels.
