BTC/USD 1D Chart🧭 Overall Market Picture
Bitcoin is in a medium-term downtrend, as confirmed by:
a descending channel (marked with white lines),
lower highs and lower lows,
price below the key EMA and SMA.
The price is currently testing the upper boundary of this channel, so it will be crucial whether it manages to break out of it to the upside or rebounds further down.
🔹 Key Price Levels
Support:
$100,650 — short-term support, previously seen price reactions.
$98,550 — next demand level from late October.
$96,950 — lower boundary of the descending channel, potential target for continued declines.
Resistance:
$106,300–$106,500 — current resistance (upper boundary of the channel + SMA100).
$109,700–$110,000 — strong resistance converging with the EMA200 and SMA200.
$112,000+ — channel breakout and trend change.
🔸 Technical Indicators
1. MACD
The histogram is starting to turn positive (descending red).
The MACD line is attempting to cross the signal from below — a potential bullish signal, but not yet confirmed.
➡️ Indicates a possible short-term upward correction within a downtrend.
2. RSI (14)
Value: ~40.5 — low, but has rebounded from oversold levels.
No bullish divergence, but the RSI is rising from below, suggesting a potential technical bounce.
➡️ Still more upside than downside before entering the overbought zone.
🔹 Moving Averages
EMA50 (~109,970 USD) and EMA200 (~110,380 USD) are above the price, confirming the downtrend.
The EMA50 < EMA200 cross holds – a classic death cross.
SMA100 (~106,300 USD) has just been tested – a key level that could determine the direction of the coming days.
🔸 Short-Term Scenarios
🟩 Bullish (30–40% chance)
Breakthrough of the upper channel line (~106.5k USD) + daily close above 107k USD.
Confirmation of the MACD and RSI signal > 50.
Targets: 109,700 → 111,500 → 113,800 USD.
➡️ A medium-term trend reversal is then possible.
🟥 Bearish (60–70% chance)
Bounce from the upper channel line and fall below 102k–101k.
Continuation of the downtrend.
Targets: 100,600 → 98,500 → 96,900 USD.
➡️ In this scenario, the market will maintain a lower high/lower low structure.
⚙️ Summary
Trend: Down, but with a short-term rebound attempt.
Key moment: reaction to the 106k–107k USD level.
If the channel with volume breaks, a bullish reversal.
If a rebound, a new low around 97k–99k USD is very possible.
Fundamental-analysis

USD/CHF - Trendline Rejection (10.11.2025)📊 Setup Overview : FX:USDCHF
USD/CHF continues to respect the descending trendline and Ichimoku cloud resistance, signaling potential downside pressure. Price is currently retesting the resistance zone (0.8070–0.8085) — a strong supply area that has rejected multiple times.As long as this zone holds, we expect a move toward the next support zones.
🧭 Trade Plan
Bias: 🔻 Sell / Short-term Bearish
Entry Zone: 0.8060 – 0.8080 (wait for confirmation candle or rejection)
Target 1 (1st Support): 0.8015
Target 2 (2nd Support): 0.7995
Invalidation: Break and close above 0.8085 (Resistance Zone)
⚡ Fundamental Updates
1️⃣ U.S. Treasury yields eased slightly as consumer confidence declined.
2️⃣ Markets now price a 66% chance of a rate cut in December, according to CME’s FedWatch Tool.
3️⃣ U.S. government shutdown concerns keep the dollar under mild pressure as investors watch debt issuance risk.
💬 Summary
A clear trendline rejection combined with fundamental USD weakness supports a short bias.
Wait for confirmation before entering — patience protects capital.
⚠️ Disclaimer
This analysis is for educational purposes only and not financial advice.
Always do your own research and manage risk wisely.
📢 Support My Work
💚 Like, Comment & Share this idea to motivate more chart updates!
🧠 “Charts Don’t Lie, Traders Don’t Quit.”
#USDCHF #ForexAnalysis #TradingView #PriceAction #Trendline #Ichimoku #TechnicalAnalysis #ForexTrader #Fundamentals #SwingTrading #KABHI_TA_TRADING

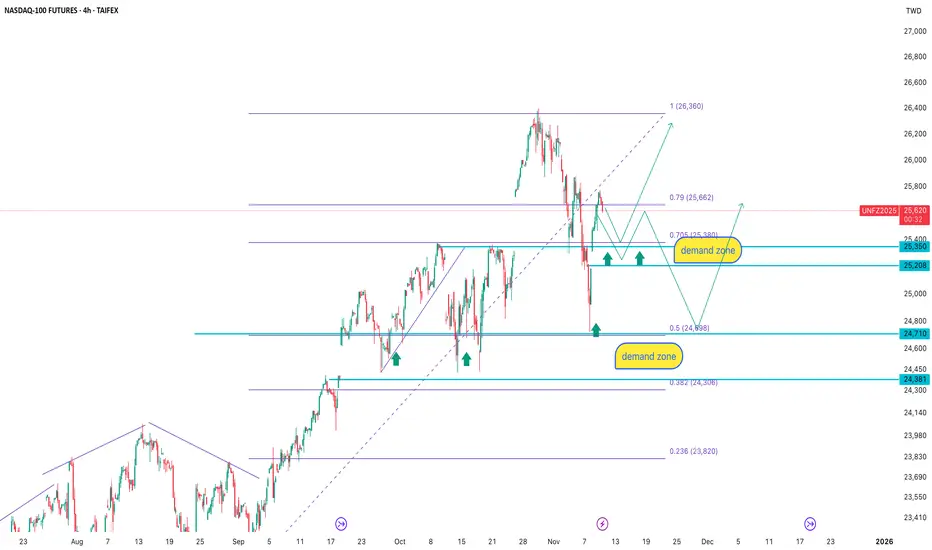
NASDAQ-100 4H: demand is not gone, only waiting for the priceAfter the recent upward impulse, the price retraced into the key demand zone at 25 350–25 208, an area that has repeatedly triggered buying reactions in the past. T
he latest correction pushed the price into the 0.79–0.705 Fibonacci range, which frequently acts as a retest zone before continuation.
Below that lies an even stronger demand zone at 24 710–24 381, aligning with the 0.5 Fibonacci level and previous volume accumulation.
The trading logic here is simple: don’t chase the move, let the price come to demand and wait for confirmation.
As long as the market structure holds, the primary scenario remains bullish from demand zones with a target toward 26 360 and potentially higher.
Fundamentally, NASDAQ remains supported by expectations of softer Fed policy, strong tech capital inflows, and continued investment in AI, cloud, and data-center infrastructure. Smart money accumulates on corrections, not on peaks.
When price falls into demand, it’s not fear — it’s opportunity.
Gold 30 m Decision-Point: Breakout vs. PullbackFundamental Overview
The spot price of Gold (XAU/USD) is hovering around USD 4,115-4,130 per ounce.
Bullish drivers:
Expectations of a rate cut by the Federal Reserve (Fed) continue to support gold as a non-yielding store of value.
Safe-haven demand remains elevated amid global uncertainty and weaker U.S. economic data.
Bearish/neutral risk factors:
The U.S. Dollar (USD) is finding some strength, which could cap gold’s upside.
With gold already near recent highs, the risk of profit-taking or consolidation is higher.
Fundamental Bias Summary: Neutral to slightly bullish — fundamentals support upside, but need trigger for meaningful move.
Technical Analysis (30 Minute Frame)
Price is trading near USD 4,115-4,130, above yesterday’s range.
Key resistance zone: USD 4,150-4,200. A clean breakout here could fuel further gains.
Key support zone: USD 4,050-4,000. If price drops below, look for weakness.
Technical indicators: RSI on daily/4-hour shows momentum is positive; however intraday momentum may be thinner on the 30m frame.
Technical Bias Summary: Favor bullish bias if price breaks above resistance and confirms. Without that, expect range bound or pullback toward support.
Trade Plan & Key Levels
Bullish Scenario (Breakout Play):
Entry: Long above USD 4,150, after 30-min candle close above.
Stop-Loss: Around USD 4,010-4,000, depending on risk tolerance.
Targets:
TP1: ~USD 4,250
TP2: ~USD 4,350 (if momentum strong)
Bearish Scenario (Rejection/Breakdown Play):
Entry: Short if price fails at resistance zone (4,150-4,200) and breaks below USD 4,000 on 30-min.
Stop-Loss: ~USD 4,170-4,200
Targets:
TP1: ~USD 3,900
TP2: ~USD 3,800
No-trade / Wait Mode:
If price remains stuck between ~USD 4,050 and USD 4,150 without clear breakout or breakdown — better sit out and wait for clearer directional cue.
My View for Today
I lean slightly bullish, but only if we see a valid breakout above USD 4,150. The fundamental tailwinds (Fed cut hopes + safe-haven) support this.
However, if that breakout fails and price rejects, the more likely scenario is a pullback toward USD 4,000-3,900.
Thus, I’ll be watching closely for the trigger on the 30-minute chart — execution only after confirmation.

Gold H1 - Holds Above 4,140$, Eyes the 4,200$ Breakout🔍 Market Context
Gold continues its relentless climb, trading near a three-week high at 4,146$ as buyers remain firmly in control.
Despite a mild rebound in the US Dollar — driven by cautious sentiment across Asian markets — gold’s momentum stays intact, fueled by expectations that the Federal Reserve may proceed with a rate cut in December.
Soft US data last week and weaker consumer sentiment readings have further strengthened this outlook, keeping real yields under pressure and reinforcing gold’s safe-haven appeal.
📊 Technical Outlook (H1–H4)
The market structure remains bullish, forming a clear ascending channel.
Price has broken above the previous resistance at 4,086$ and is now consolidating around 4,140$, preparing for a potential continuation move.
Key Levels:
• Support Zones: 4,086$ – 4,039$ → retest area for new buyers
• Immediate Resistance: 4,146$
• Breakout Target: 4,203$
• Extended Bullish Target: 4,382$ (ATH zone)
If gold maintains structure above 4,080$, the bias remains strongly bullish.
Only a confirmed close below this zone would suggest a short-term pullback before continuation.
⚜️ MMFLOW Insight:
“Momentum follows liquidity. Once price reclaims key structure, smart money builds the next leg — not noise, but narrative.”

Fundamental Market Analysis for November 11, 2025 GPBUSDEvent to watch today:
09:00 EET. GBP - Unemployment Rate
GBPUSD:
Sterling trades around 1.31600–1.31700 after early-week losses: progress on resolving the U.S. budget issue supports the dollar while narrowing the scope for a GBP rebound. Additional pressure comes from domestic U.K. discussions about the need for fiscal consolidation and prospects for new tax measures, which heighten investor caution toward growth. Against this backdrop, the pair retains a downside bias from 1.31650.
From a monetary perspective, the U.K. still faces the likelihood of further policy easing in 2026 amid cooling activity and softer price pressures. This tempers the pound’s appeal versus the dollar, which in the near term benefits from clarity on budget risks and a potential increase in Treasury supply without the threat of a technical default.
The market is unlikely to quickly overturn its cautious stance: the combination of fiscal restraint in Britain and normalization in the U.S. fundamentally favors USD strength against GBP. Absent fresh positive surprises from the U.K., the base case is a gradual move toward the 1.31 area and lower.
Trading recommendation: SELL 1.31650, SL 1.32150, TP 1.30950

What will gold do in the US trading session?📈 Market Structure
Price Action:
Price has just broken out of the accumulation zone, moving sharply toward the main resistance area.
📊 Trendlines
Lower Trendline (Red): Long-term dynamic support — price has bounced multiple times from this level.
Upper Trendline (Red): Main descending resistance — price is now approaching this zone.
🧱 Support Zones
3,970,000: Confluence of horizontal support and the lower trendline → key reaction area to monitor.
4,030 – 4,050 (Breakout Zone): Intermediate support if price pulls back after the breakout rally.
⚔️ Resistance Zones
4,100 – 4,115: Strong resistance aligning with the upper trendline and previous highs → possible correction zone.
🎯 Scenario
If price gets rejected around 4,115, it could pull back toward the 4,030 – 4,050 breakout zone, or even retest 3,970,000.
A clean breakout above 4,115 would confirm stronger bullish continuation.
🧭 Summary
Trend: Short-term bullish — currently testing major resistance.
Strategy: Watch price action near 4,115; wait for confirmation to re-enter buys around 4,030 – 3,970.
💼 Trading Plan
BUY GOLD: 4,030 – 4,028
Stop Loss: 4,018
Take Profit: 100 – 300 – 500 pips
SELL GOLD: 4,115 – 4,117
Stop Loss: 4,127
Take Profit: 100 – 300 – 500 pips

Gold 30m Outlook: Fundamentals Meet Technical Crossroads1. Fundamental Overview
The price of Gold (XAU/USD) has recently jumped to a two-week high, buoyed by expectations of a rate cut from the Federal Reserve (Fed) in December and growing global growth concerns.
Reuters
Key drivers:
Weaker U.S. economic data (job losses, retail weakness) are reducing the opportunity cost of holding gold (non-yielding asset).
Safe-haven demand remains elevated amid geopolitical tensions, economic uncertainty and central-bank buying.
Head-winds:
The U.S. dollar index (DXY) showing strength and rate-cut expectations being questioned.
Recent profit-taking after strong rally: gold corrected about 11% from its October highs.
Structural outlook remains bullish for medium-term, according to some institutions: large central-bank purchases, de-dollarisation flows, and weak growth support gold over time.
Fundamental bias summary: Neutral-to-bullish overall, conditional on macro data and Fed policy. Short-term risk of correction is present because of recent excesses.
2.Technical Analysis (30-Minute / Short Term)
On the 4-hour and daily charts the price remains below several key moving averages: e.g., 20 SMA ~ USD 4,002, 100 SMA ~ USD 4,105.
Price is in a consolidation range around USD 4,000–4,050, forming a temporary balance between buyers and sellers.
According to short-term technical snapshots:
Upside target if momentum builds: USD 4,050+ zone.
Downside risk if breakdown: USD 3,950-3,900 support area.
Key pivot/resistance level appears near USD 4,050–4,060. If price fails here, it may lead to a sharp pullback.
Momentum indicators (RSI, volume) show weak conviction, suggesting range-bound or corrective phase rather than strong trending.
Technical bias summary: Tilt slightly bullish only if price breaks above ~USD 4,050 with volume. Otherwise, downside risks and range trapping remain higher-probability.
3. Trade Plan & Key Levels
Entry Strategy (30-minute timeframe):
Bullish Scenario: Enter long if price closes above USD 4,050 and retests it, with momentum.
Stop: ~USD 3,995 (just below support)
Target: First leg ~USD 4,150, stretch to ~USD 4,250 if strong.
Bearish Scenario: If price rejects near USD 4,050–4,060 and breaks below ~USD 3,990, then short.
Stop: ~USD 4,070
Target: USD 3,900–3,850 zone.
Avoid/Wait: If price remains stuck between ~USD 4,000-4,050 without clear trigger—better skip until directional clarity.
Support & Resistance Levels to Note:
Resistance: USD 4,050-4,060
Support: USD 3,950-3,900
Intraday pivot: ~USD 4,000
Risk Management:
Given the 30 m timeframe and gold’s volatility, keep position sizes conservative, place stops strictly, and avoid chasing breakout without confirmation.
4. My View for Today
Given the current fundamentals and technicals my preferred bias is slightly bullish if we see a trigger. The macro backdrop supports gold (rate-cut hopes, safe-haven flows), but the technicals demand a breakout for momentum. If no breakout, the default is sideways to mildly bearish (range or pullback). I’ll lean long only after breakout above ~USD 4,050. Otherwise treat any rally as potential short opportunity.
📈 Stay patient – gold is near a key decision zone. Wait for clear 30 m confirmation before entering trades.
#Gold #XAUUSD #SignalAndAnalysis30m #GoldTrading #AthensBySahan #ForexSriLanka #SmartTrading #PriceAction

XAU/USD – Holds Its Range, Preparing for a Year-End Expansion🔍 Market Context
Friday’s New York session closed with a two-sided liquidity sweep, yet gold managed to hold its structural balance, maintaining the same rhythm seen over the past two weeks — sideways to mildly bearish, but firmly supported.
This behavior shows that buyers are still defending key zones, especially around 3,940$ – 3,980$, which MMFLOW highlighted multiple times last week as the decisive liquidity floor.
From a macro lens, the Fed’s cautious tone has slowed expectations for aggressive rate cuts — but the probability of another reduction before Q1 2026 remains alive.
As we move toward the final stretch of the year, thinner liquidity and seasonal safe-haven flows could help gold establish a mid-term bottom, setting the stage for the next impulsive leg.
📊 Technical Structure (H4)
The current chart presents a clear 5-wave recovery structure within a tightening range — a classic setup before expansion.
Key Technical Zones:
• 💎 Support Zone: 3,942$ – 3,982$ (liquidity base + strong absorption area)
• 🎯 Wave 3 Target: 4,072$ – 4,133$ (first reaction zone)
• ⚙️ Extended Target / Wave 5: 4,189$ – 4,201$ (Fibo 1.618 projection)
• ⚠️ Invalidation: Below 3,940$ → loss of short-term structure, possible re-accumulation lower.
The structure remains sideways but constructive, and a confirmed breakout of the descending trendline could act as the catalyst for a year-end bullish continuation.
🎯 MMFLOW TRADING View
Smart money continues to accumulate within equilibrium zones, with every liquidity sweep appearing more like preparation than rejection.
As long as gold stays above 3,970$, the bullish bias remains valid — with a 60%+ probability of a move toward 4,130$+ in the short to mid-term.
Historically, November–December often brings portfolio rebalancing and policy easing cycles, both of which may serve as fuel for a potential gold rally into Q1 2026.
⚜️ MMFLOW Insight:
“Accumulation isn’t waiting — it’s when big money quietly builds the next wave.”

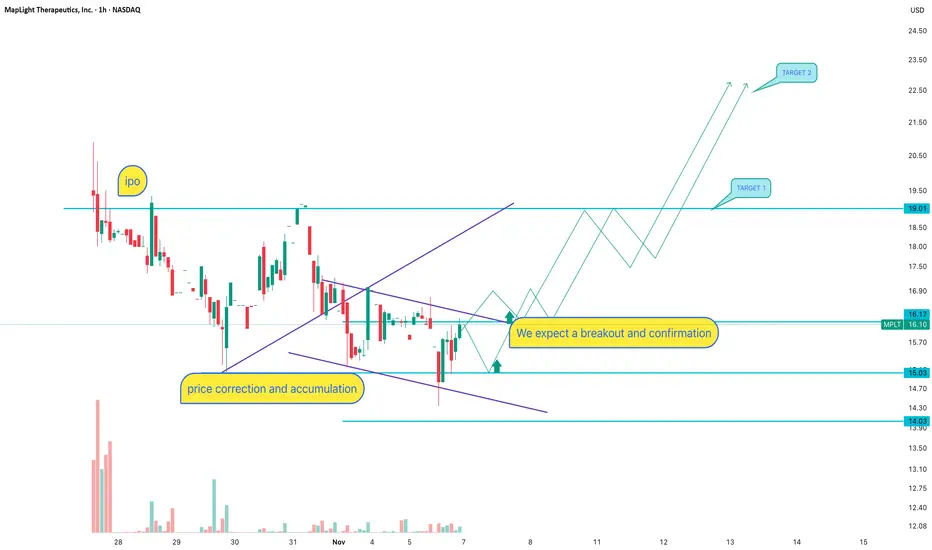
MPLT: Is the IPO working according to a scenarioAfter the IPO, the stock is forming a falling wedge — a classic post-listing accumulation pattern. Price is consolidating between the 15.03 support level and the accumulation zone. We see a trendline breakout attempt and price trying to hold above. The key resistance is 19.01, aligning with the previous consolidation range. Lowering volume indicates seller exhaustion. Scenario: breakout above 16.20 and confirmation gives a path toward target 1 at 19.01, with a potential impulse toward 22.50 (target 2). Entry only after breakout + retest. Without a retest, the risk of a fake breakout increases.
MPLT is a biotech company newly listed on NASDAQ. Post-IPO stocks often go through correction and accumulation while the market defines fair value. FDA updates or clinical trial results can act as catalysts — biotech names tend to move aggressively on news. If institutional interest increases, the trend may accelerate quickly.
If the breakout confirms — the rocket won’t wait for you to fasten your seatbelt. Let price show direction instead of forcing an entry inside noise.
NFP: Dollar surge or market meltdown?On Friday, November 7, 2025, at 15:30 EET , the U.S. Bureau of Labor Statistics will release the Non-Farm Payrolls (NFP) report — a market-moving event that can reshuffle investor expectations in a matter of minutes. For traders and investors, it’s a real-time test: is the economy slowing enough to justify Fed easing, or are wages rising too fast, fueling services inflation and keeping core CPI elevated?
How to read the NFP: 5 key signals for traders
Jobs added . A print above forecasts signals strength; below expectations suggests weakness.
Unemployment rate . A rise above consensus = cooling labor market; a drop = tight conditions.
Wages . Rising faster = inflation risks and hawkish Fed; slowing = case for softer policy.
Revisions . Changes of ±50–100K to past months can flip the current release’s narrative.
Quality metrics . Hours worked, labor force participation, sector breakdown — broader and stronger growth if these are healthy.
The November 7 NFP isn’t just another jobs report — it’s a stress test for rate expectations and risk appetite . Market reactions will depend on the full mix of employment numbers, unemployment rate, wage growth, and revisions

Fundamental Market Analysis for November 7, 2025 USDJPYUSD/JPY is consolidating after a swift rise toward 154.000: some investors are taking profit amid stronger demand for safe-haven assets and verbal signals from Japanese authorities about the undesirability of excessive volatility. Increased caution in equity markets also supports the yen via the safe-haven channel, limiting further weakening of the Japanese currency.
At the same time, the overall fundamental backdrop for the pair is mixed: the yield differential still favors the U.S., but the pace of its widening has slowed, and market expectations for future Fed steps have softened as some components of employment data cooled. Any hints that Tokyo is ready to step up measures against excessive yen weakness increase the market’s sensitivity to downside corrections in USD/JPY.
In practice this creates conditions for tactical selling on rallies: with lingering nervousness and potential intervention-related comments from Japan’s Ministry of Finance, the short-term bias tilts lower. As of November 7, the pair trades around 153.100–153.300; pullbacks to 152.500–152.000 look plausible if U.S. yields ease and safe-haven demand persists.
Trading recommendation: SELL 153.250, SL 153.550, TP 152.450

GBP/USD – BoE Rate Decision Ahead |(06.11.2025)🧠 Setup Overview:
GBP/USD is trading inside a descending channel, with price recently rebounding from a strong support zone near 1.3000.
Ahead of the Bank of England (BoE) interest rate decision, the pair is positioned for a possible bullish breakout if the BoE maintains rates and highlights inflation risks.
📊 Trading Plan:
Bullish Scenario:
If the BoE holds rates and remains cautious on inflation → expect GBP/USD to rebound toward 1.3120 – 1.3180.
Breakout confirmation above channel resistance will strengthen the bullish view.
Bearish Scenario:
If the BoE signals dovish tone or hints at future rate cuts, GBP/USD could drop below 1.3000, targeting 1.2850 – 1.2710.
⚙️ Technical Levels:
🟢 1st Resistance: 1.3133
🟢 2nd Resistance: 1.3171
🔴 Support Zone: 1.3000 – 1.3020
Pattern: Falling Channel → Potential Breakout
🧩 Fundamental Insight (Today – 6 Nov 2025)
1.Markets price a 1-in-3 chance of a BoE rate cut to 3.75%, but consensus expects a hold at 4.00%.
2.UK inflation at 3.8% YoY remains above the BoE’s target, supporting a hawkish stance.
3.A surprise dovish tone, however, could hit the pound hard against the USD, especially as US data remains resilient and the dollar stays firm.
#GBPUSD #BoE #Forex #TechnicalAnalysis #PriceAction #ChartPatterns #KABHI_TA_TRADING #FundamentalAnalysis #BankOfEngland #InterestRates #FXMarket #TradingPlan #ForexSetup #ChartsDontLieTradersDontQuit #GBP #USD #TradingView
⚠️ Disclaimer:
This analysis is for educational purposes only and not financial advice. Always do your own analysis and manage risk carefully before trading news events.
💬 Support My Work ❤️
If you find this chart helpful — LIKE 👍, COMMENT 💭, and FOLLOW 🔔 to stay updated with more daily Forex setups and price action insights!

Don’t Rush the AI Infrastructure Arms Race: Waiting Could Win### Don’t Rush the AI Infrastructure Arms Race: Why Patience Could Win
In the tech sector, the urge to invest heavily in GPUs and data centers is strong—to capture market share before competitors do. However, early movers risk a dangerous trio: skyrocketing capital expenditures (capex), fast hardware obsolescence, and inflexible financing. A wiser strategy for many investors and operators? Pause non-essential spending, secure options on emerging technologies like photonic and optical computing, and wait for innovations to mature before locking in major commitments.
#### 1. Hyper-Capex Meets Power Shortages
Big tech firms are projected to spend $350–$400 billion on capex in 2025, mostly for AI infrastructure, with global AI investments potentially hitting $1–2 trillion by 2029 (Goldman Sachs, 2025 forecast). U.S. data center power demand is expected to triple by 2030, surging 22% in 2025 alone (Electric Power Research Institute). Governments, including the U.S. DOE, are already considering power rationing for data centers amid grid strain—echoing overbuild risks in resource-limited sectors like semiconductors (WIRED, Oct 2025).
#### 2. The Hardware Treadmill Accelerates Obsolescence
NVIDIA's high-end GPUs now launch annually (e.g., Blackwell in 2024 to Rubin in 2025), with power draw rising to ~1,200W per unit (NVIDIA Q3 2025 earnings). This shortens cluster lifespans from 3–5 years to 1–2 years, stranding investments in cooling systems and networks. AMD and Intel follow suit, per CUDO Compute's 2025 analysis, amplifying depreciation costs by 40–50% for outdated setups.
#### 3. Financing Shifts to Debt at Peak Cycle Risk
AI projects increasingly rely on debt: Over $200 billion in AI-related bonds issued in 2025, including $30 billion single deals for data centers (Bloomberg). Off-balance-sheet financing for mega-campuses adds leverage, but with hardware depreciating rapidly, any ROI dip could erode equity value—mirroring the 2022 crypto mining debt crisis (Financial Times, Nov 2025).
#### 4. Photonic and Optical Computing Gains Traction
Silicon photonics and optical interconnects offer 10x bandwidth with 50–70% less energy use for AI workloads (Lightmatter whitepaper, 2025). Firms like Lightmatter and Celestial AI are deploying optical I/O in pilots, targeting full photonic accelerators by 2027. Locking into copper-based systems now could leave investors with inefficient "thermal walls," as optical scales to exascale computing (MIT Technology Review, Sep 2025).
#### 5. Ternary Logic: A Disruptive Wild Card
Ternary (base-3) computing, using three states per bit, could boost efficiency 30–50% over binary for AI inference (IEEE Spectrum, 2025). Revived via neuromorphic chips from startups like Mythic, it's lab-proven but not scaled—yet it highlights the peril of over-investing in binary ecosystems, much like quantum's threat to classical bits (Wikipedia; arXiv preprints, 2025).
#### 6. Even Leaders Strain for Capacity
OpenAI has tapped $10 billion in credit lines and chip-leasing deals in 2025 to hoard GPUs, per Reuters. This cash-burn approach ties firms to current tech paths; a photonic pivot could disadvantage debt-laden players, favoring agile newcomers with cleaner sheets.
#### Actionable Steps for Investors and Operators
- **Pause Legacy Builds**: Limit GPU/data center capex to projects with >20% IRR under obsolescence/power stress tests. Opt for modular, 18-month depreciation (The Next Platform, 2025).
- **Secure Future Options**: Sign pilot MOUs with photonics leaders; reserve optical upgrades in contracts for penalty-free swaps (Lightmatter, 2025).
- **Flexible Financing**: Use staged debt, pay-as-you-go leases, and vendor rebates tied to milestones—avoiding the leverage traps seen in recent $50B+ issuances (Financial Times).
- **Co-Develop for Priority**: Invest small in non-recurring engineering (NRE) for optics trials; offer AI datasets for faster validation and queue-jumping (IDTechEx report, Q4 2025).
- **Mitigate Power Risks**: Hedge via futures; site builds near renewables with PPAs expandable to 500MW+ to dodge allocation caps (S&P Global Ratings, 2025).
**Bottom Line**: Amid trillion-dollar AI bets, optionality trumps haste. Wait for photonics and advanced logic to commercialize—delivering cooler, cheaper compute—without the drag of obsolete, debt-fueled infrastructure. Patience positions winners for the next curve.
Building a Trading System: From Idea to ExecutionEvery trader starts with an idea — a setup, a pattern, a theory that seems to work.
But until that idea becomes a structured system, it’s just intuition.
A trading system gives your ideas rules, logic, and repeatability.
That’s the difference between a trader who hopes, and a trader who executes.
Define the Core Idea
Every system begins with an observation.
Maybe you notice breakouts after volume spikes, or reversals after RSI divergence.
Whatever the logic, write it down.
A system has to be specific, if you can’t define it clearly, you can’t test it.
Set Your Entry and Exit Rules
Your system should answer three things precisely:
When to enter a trade
When to exit a trade
How much to risk
Ambiguity is the enemy.
Rules make your strategy repeatable, testable, and objective.
Backtest the Logic
Before going live, test your rules on past data.
You’re not looking for perfection, you’re looking for consistency.
If your logic survives bull, bear, and sideways markets, it’s valid.
Track win rate, drawdown, and profit factor — they’ll tell you what’s working.
Execute With Discipline
A system only works if you do.
Follow the rules exactly as tested, even when it feels uncomfortable.
Consistency turns probability into profit — emotions destroy both.
Application
Here we have a very good example from our trading signals where we executed one of our strategies for 10 days. The strategy was designed with detailed inputs, logic and executed with a precise setup in a trading bot.
Refine and Evolve
Once live, keep notes.
Track how the system performs under real conditions.
Make small, measured improvements based on data, not emotion.
A system should evolve, not change its identity.
Redefining and tuning is a part of the process, there is no strategy that lasts forever, everything needs to evolve and adjust!

Risk‑off vs squeeze: the near‑term BTC plan__________________________________________________________________________________
Market Overview
__________________________________________________________________________________
After a swift capitulation into 99–100k, the market is stabilizing on a 12H/1D floor cluster. The regime is mixed: HTFs remain constructive, while ETF outflows and a risk‑off backdrop cap momentum.
Momentum: Bearish-neutral 📉 short term, stabilizing above 101.6–102.1k after capitulation‑type volume.
Key levels:
- Resistances (D/2D) : 103,800–104,063 (D Pivot High), 105,000–105,500 (intraday supply), 109,377 (2D Pivot High).
- Supports (12H/1D/MTF) : 101,616–102,102 (1D/12H floors), 99,700–100,100 (multi‑TF cluster + D Pivot Low 100,267), 98,150–98,613 (2H floor + weekly pivot).
Volumes: Very high intraday (capitulation) and normalizing on 1D.
Multi-timeframe signals: 1W/1D/12H trend up; LTFs repairing. Hold 101.6–102.1k to target 103.8–104.1k; failure reopens 99.7–100.1k.
Risk On / Risk Off Indicator: Neutral sell — aligns with risk‑off macro and partially contradicts the bounce attempt.
__________________________________________________________________________________
Trading Playbook
__________________________________________________________________________________
Context: HTF uptrend versus macro risk‑off; favor tactical buys at supports and avoid chasing breakouts without confirmation.
Global bias: Neutral with a tactical buy tilt while 101.6–102.1k holds; key invalidation: sustained close < 101,616.
Opportunities:
- Buy confirmed pullback at 101,616–102,102 (≥2H/4H bullish) targeting 103.2k then 103.8–104.1k.
- Breakout buy above 104,063 (D close) toward 105.0–105.5k, then 109,377 if momentum persists.
- Tactical sell at 103.8–104.1k on clean rejection, or break/retest below 101,616 toward 100.3k then 99.7–100.1k.
Risk zones / invalidations: Break below 101,616 voids the bounce path and opens 99.7–100.1k; strong rejection at 104k invalidates early longs.
Macro catalysts (Twitter, Perplexity, news):
- Persistent spot BTC ETF outflows — cap upside under resistance.
- Broad risk‑off (Asia equities down, firm USD) — pressure on supports.
- FOMC: -25 bps and QT ending flagged — rate‑volatility, choppy tone.
Action plan:
- Entry: 101,650–102,150 after bullish confirmation (≥2H/4H).
- Stop: ~0.7–1.0% below 101,616 (≈100.9k–100.6k).
- TP1: 103,200–103,400; TP2: 103,800–104,063; TP3: 105,000–105,500.
- Approx R/R: ~2R to 3R depending on fill/stop.
__________________________________________________________________________________
Multi-Timeframe Insights
__________________________________________________________________________________
HTFs remain upward while LTFs repair around the 99.7–100.1k and 101.6–102.1k floor clusters.
1D/12H/1W: Uptrend; price sitting on the 101.6–102.1k cluster. Holding it = stabilization and a path to 103.8–104.1k; daily reclaim above 104,063 opens 105–105.5k then 109,377.
6H/4H/2H: Rebound from 99–100k with very high volume implying local seller exhaustion; first gate 103.8–104.1k, confirmed on closes > 104,063.
1H/30m/15m: Basing above 100k; need a clean reclaim of 102.0–102.8k to extend; time failure if no push within 1–2 bars.
Major divergences/confluences: Bullish confluence at MTF floors + capitulation volume; divergence with the Risk On / Risk Off Indicator (neutral sell) — execute with tactical prudence.
__________________________________________________________________________________
Macro & On-Chain Drivers
__________________________________________________________________________________
Macro is risk‑off with unfavorable ETF flows, likely capping bounces under 104k despite constructive HTFs.
Macro events: Asia equities lower and a firm USD weigh on risk; BOJ remains easy; FOMC: -25 bps and QT ending flagged — more rate vol; US shutdown headlines keep liquidity cautious.
Bitcoin analysis: Weekly “make‑or‑break” band at 101k–103k; large short liquidations above could fuel a squeeze on a decisive reclaim, yet ETF outflows limit upside follow‑through.
On-chain data: Mixed accumulation, softer derivatives, hedging up — stability hides fragility absent fresh inflows.
Expected impact: Prefer reactive buys at floors and demand daily closes > 104,063 before chasing breakouts.
__________________________________________________________________________________
Key Takeaways
__________________________________________________________________________________
BTC is parked in a 101.6–104k decision zone, between sturdy MTF supports and a flow‑capped ceiling.
Overall trend: neutral (HTF up vs macro risk‑off). Most relevant setup: tactical buy at 101.6–102.1k with scaled profit‑taking below 104k, or a confirmed breakout above 104,063. Key macro factor: persistent spot ETF outflows. Stay disciplined: act on floor signals and avoid unconfirmed breakouts.

Fundamental Market Analysis for November 5, 2025 EURUSDThe euro remains under pressure as the US dollar firms ahead of key US services activity indicators. Investors are weighing the mix of resilient consumer demand and signs of softer employment, which supports the dollar via firmer Treasury yields and demand for safe-haven assets. The upcoming release of the US services activity index and fresh private-sector employment data shapes expectations for the Federal Reserve’s rate path and, overall, keeps the bias in favor of the dollar.
In the euro area, the backdrop is subdued: business activity in manufacturing and services remains muted, while inflation expectations have been revised lower following the ECB’s latest easing of financing conditions. The combination of soft domestic momentum and limited progress in credit growth sustains caution toward the euro. Recent ECB communication emphasizes stabilizing growth over the risks of re-accelerating inflation, which also weighs on the currency.
An additional factor is a generally risk-averse tone: concerns around the US budget and headlines on government spending bolster demand for the dollar as a reserve asset. Against this backdrop, the near-term risk balance for EURUSD remains tilted lower; if US data stay firm, the pair risks holding around multi-month lows.
Trading recommendation: SELL 1.14950, SL 1.15250, TP 1.14450

BNB reacts to BTC declines🔍 General Technical Situation:
The BNB price has broken below a key uptrend line that has been in place since June.
It is currently below the support level of ~1010 USDT, signaling a shift from higher lows to a potential downtrend.
📉 Key Levels:
Resistance:
1086 USDT → last local resistance after the trend breakout (a retest from below is possible).
1205 USDT → strong resistance from August and September.
Support:
912 USDT → local support (currently being tested).
831 USDT → next support, significant from the August structure.
733 USDT → strong demand zone from June-July.
📊 Volume:
In recent days, it has increased noticeably during declines—confirming selling pressure and the presence of large players liquidating positions.
🔄 Stoch RSI Indicator:
The Stoch RSI is at the lower end of the chart, close to the oversold zone (around 20–0).
This could indicate a short-term rebound, but not necessarily the end of the decline—rather, a potential retest from below the broken trend line (~1050–1080 USDT).
⚠️ Scenarios:
🟥 Bearish (more likely):
Price remains below 1010 USDT and rejects the 1080–1100 level in the event of a rebound.
Next downside targets: 912 → 831 → 733 USDT.
High selling volume suggests a test of lower levels may occur before demand stabilizes.
🟩 Bullish (less likely, but possible):
Price bounces from the 900–910 zone and returns above 1010 USDT with confirmed volume.
Only a close of the daily candle above 1080 USDT would negate the current bearish signal and could open the way to 1200 USDT.
📈 Summary:
Medium-term trend: broken, signal of weakness.
Short-term: possible technical rebound from 900–910, but the overall bias remains bearish.
Key level to watch: 1010 USDT – a return above this level would be the first positive signal.

Fundamental Market Analysis for November 4, 2025 USDJPYThe pair is sliding below 154.000, and the market is shifting in favor of the yen amid stronger domestic drivers in Japan. Faster inflation in Tokyo has strengthened expectations of a gradual normalization of Bank of Japan policy in the coming months, while comments from the regulator’s leadership allow for the possibility of discussing tightening at one of the upcoming meetings. For the market, this implies a narrowing of the real yield differential going forward and reduced appeal of carry trades funded in yen, which supports a decline in USDJPY.
An additional constraint for the dollar against the yen comes from repeated warnings by Japan’s Ministry of Finance about excessive exchange-rate volatility. The risk of targeted actions by the authorities and tighter monitoring of the pair’s dynamics prompts market participants to close long USDJPY positions and trim risk whenever the dollar’s decline accelerates. Historically, such verbal signals increase investors’ propensity to take profits and reinforce corrective moves in favor of the yen.
On the U.S. side, short-term dynamics are shaped by uncertainty in the macro calendar and heightened sensitivity to any signs of a slowdown in the U.S. economy. Against this backdrop, local Japanese factors — inflation and official commentary — temporarily outweigh the overall dollar backdrop. All in all, this creates fundamental conditions for a near-term correction lower in USDJPY.
Trading recommendation: SELL154.000, SL 154.250, TP 153.150

AUD/JPY - Bullish Flag (03.11.2025)🧠 Setup Overview:
AUD/JPY is forming a Bullish Flag Pattern on the 30-minute chart — a continuation setup suggesting potential upside momentum after consolidation. The price has respected the flag support zone and is attempting a breakout above the descending channel, signaling renewed bullish pressure.
💡 Technical Plan: Pattern: Bullish Flag Pattern
Bias: Buy after confirmation breakout and retest
Support Zone: 100.650 – 100.700
Entry Zone: Near 100.850 – 100.900 (after breakout confirmation)
Targets:
🎯 1st Resistance: 101.460
🎯 2nd Resistance: 101.753
Invalidation: Close below 100.600 negates the bullish bias
🌏 Fundamental Insight (Today – 3 Nov 2025)
The AUD finds strength as China’s manufacturing PMI beats expectations, improving sentiment for commodity-linked currencies.
Meanwhile, the JPY remains under pressure due to continued Bank of Japan dovishness and yield differentials favoring risk assets.
Market tone is risk-on, further supporting bullish momentum in AUD/JPY.
⚠️ Disclaimer:
This setup is shared for educational purposes only. It is not financial advice. Always do your own analysis and apply proper risk management before trading any setup.
#AUDJPY #Forex #TechnicalAnalysis #PriceAction #BullishFlag #BreakoutTrading #Ichimoku #KABHI_TA_TRADING #ChartsDontLieTradersDontQuit #ForexSetup #MarketAnalysis #TradingView #FXMarket #BuySetup #ForexCommunity #AUD #JPY #ForexTrader
💬 Support My Work ❤️
If you find this analysis useful — LIKE 👍, COMMENT 💭, and FOLLOW 🔔 for more daily Forex chart updates and trade setups!

ETH/USDT 1W Chart📊 Market Structure:
Main Trend: Still up (higher lows and highs pattern persists).
Current Phase: Correction in an uptrend.
Local Trend: Down for several weeks (series of red weekly candles).
⚙️ Key Support and Resistance Levels:
Resistance (green lines):
4,753 USDT – recent local high, very strong resistance.
4,373 USDT – previous consolidation level, currently a supply zone.
3,979 USDT – current key local resistance, which previously served as support.
Support (red lines):
3,600 USDT – currently tested support level (coincides with the uptrend line).
3,165 USDT – next strong support level (previous local lows).
2,740 USDT – strong long-term support, potential target for further correction.
📈 Trendline:
The black uptrend line connects successive higher lows since April 2024.
The current weekly candlestick is testing this line (confluence with support at 3,600 USDT).
Maintaining this line = still a bullish medium-term scenario.
A breakout and weekly close below ~3,580–3,600 USDT → a signal of a possible trend reversal.
📉 Volume:
Downward volume is increasing, indicating supply pressure.
A lack of strong demand candlesticks = buyers are cautious in this zone.
🔄 Stoch RSI Oscillator (bottom of the chart):
Located in the oversold zone (below 20).
The %K (blue) and %D (orange) lines are starting to converge → a possible rebound signal in the coming weeks if a crossover occurs upwards.
🧭 Scenarios:
🟢 Bullish
Holding support at 3,600 USDT + trendline.
Confirmation with a bullish candle with higher volume.
Target: Return to 3,980 → 4,370 USDT.
🔴 Bearish:
Closing the week below 3,580 USDT (trendline + support).
Potential decline to 3,165 USDT, and even 2,740 USDT beyond.
RSI and volume suggest that downward pressure remains significant.
📌 Summary:
Key level: 3,600 USDT → decisive point for the market's further direction.
Short-term: Still downward pressure, but a technical rebound is possible (Stoch RSI).
Medium-term: The uptrend has not reversed until ETH closes below the trend line and 3,550 USDT.

Backtesting 101: How to Turn an Idea Into a Tested StrategyEvery trader has thought it:
“If I’d just followed that setup every time, I’d be up big.”
That’s where backtesting steps in, it separates luck from logic.
It’s how you find out whether your strategy has a real edge, or just worked in hindsight.
Most traders skip it, not because it’s useless, but because it forces them to face the truth.
But if you can handle that truth, backtesting will make you a far more confident trader.
What Backtesting Really Is
Backtesting means applying your trading rules to historical data to see how your system would have performed.
It’s not about predicting the future, it’s about proving whether your idea works in different market conditions.
When done properly, it gives you three key insights:
Profitability: does your edge actually exist?
Risk: how deep are the drawdowns, and can you handle them?
Consistency: does it work across bull, bear, and sideways markets?
A solid backtest gives you confidence, not because it guarantees profit, but because it exposes weakness before the market does.
The Most Common Mistakes
Curve-fitting: tweaking rules until the past looks perfect.
Ignoring fees and slippage: small costs that quietly erase profits.
Testing too little data: short periods create false confidence.
Focusing on one market: edges must survive different conditions.
If your backtest looks too clean, it’s probably lying to you.
Why It Matters
Backtesting builds trust in your system and discipline in yourself.
When you know your data, you stop second-guessing every trade.
Losing trades stop feeling like failure, because you understand they’re part of a proven edge.
Even bots rely on backtesting. Without it, automation is just random execution.
With it, every trade follows structure, not emotion.
All of these points make a difference between a winning or losing strategy.
From Idea to System
Every strategy starts as a hypothesis.
Backtesting turns that hypothesis into data.
Data turns into structure.
Structure turns into consistency.
That’s the real path to professional trading - logic first, emotion second.

Gold compression before expansionGold remains in a controlled accumulation phase after a strong move, holding rising lows and respecting the fair value zone near 3990. As long as buyers defend the 3985–4000 range, the setup favors a false dip and re-entry scenario with continuation higher. A clean break and hold above 4040 unlocks the first target at 4110, and extension toward 4200 remains valid on structural expansion and Fibo alignment. The market is balanced on a hinge: levels are defined, buyers present, but confirmation lies only in price reclaiming the breakout zone.
Fundamentally gold still tracks macro uncertainty. Rates, inflation expectations, dollar hesitation and US debt dynamics keep capital rotating defensively. This is one of those periods where expectations and reality diverge, and the longer the compression holds, the stronger the eventual move. Still, discipline first — price must confirm above 4040.
Bias remains bullish while above 3985. Break below opens a corrective path toward 3920–3890 before another attempt higher.
