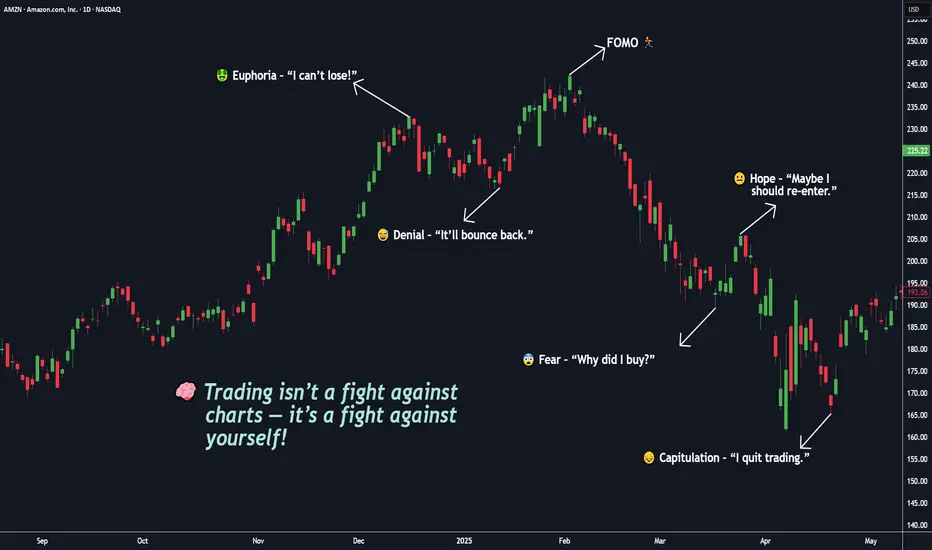
You’re Not Competing With the Market, You’re Competing With Self🧠 Trading isn’t a fight against charts — it’s a fight against yourself.
If you’ve ever told yourself “I’ll just take one more trade”, you already know this battle.
But in truth — the real battle happens inside your mind.
You start your day with discipline: BITSTAMP:BTCUSD , NASDAQ:AMZN , OANDA:XAUUSD , NASDAQ:META
📋 “ Two setups max. 1% risk. No emotions. ”
But then the market shows you something that looks perfect.
Price moves fast. Your pulse jumps. You click “BUY BUY BUY.”
Seconds later , the candle reverses — and suddenly, you chase a candle, break a rule, or move your stop just to “ give it a little more space ,” you’re not losing to the market my friend, You’re losing to your own impulses. ⚔️
You’re not trading the chart anymore — you’re trading your hope. And that’s what makes trading beautiful — it’s not a test of intelligence, it’s a mirror of your self-awareness.
That’s when the market does what it always does: it punishes emotional decisions and rewards patient ones.
💭 Emotionally! You start bargaining with yourself:
“It’ll come back.” ( When you’re greedy → it exposes it. )
“I’ll just move my stop a little.” ( When you’re fearful → it magnifies it. )
“Let me add to average out.” ( When you’re calm → it rewards it. )
The market doesn’t care if you win or lose. It simply amplifies your inner state.
You Digest it or not!, the truth most don’t want to accept:
You can’t control the market.
You can’t control news, indicators, or price spikes.
But you can control your reactions.
The moment you stop reacting and start observing — your trading transforms.
Clarity comes only when emotion leaves. 💎
⚡ Trading isn’t about predicting moves — it’s about managing yourself during those moves.
🎯 Real-Life Example:
Think back to the last time you made money on a random FOMO entry. It felt good, right?
That “instant win” wired your brain to believe impulsiveness works.
But the next time, that same instinct cost you twice as much.
That’s recency bias — one of trading’s silent killers.
Your brain craves the last emotion it felt, not the right decision.
💎 True mastery begins when you stop asking:
“Why did the market do that?”
and start asking:
“Why did I react like that?” ( 👉 “ Am I reacting, or am I responding ?” )
The market has no emotions . It’s just reflecting yours back at you — amplified, delayed, and multiplied by leverage. ⚔️
🧩 Here’s the mindset shift, that changes everything:
You don’t need to win every trade. You need to trade as if you already know yourself.
You don’t need a better indicator. You need a clearer mirror.
The edge isn’t on the screen — it’s inside your head.
When you realize that, trading becomes peaceful and You stop chasing, You start choosing.
Master that single question, and you’ll outperform 90% of traders who never will.
💬 What’s one emotion you think costs you the most trades —
👉 Fear 😨
👉 Greed 🤑
👉 Impatience ⚡
🧩 Drop it below 👇 and let’s talk about how to overcome it — build awareness together as traders, not competitors.
If this Idea gave you a value information then please, Boost it, share your thoughts in comments, and follow for more practical trading!
Happy Trading & Investing!
Team @TradeWithKeshhav
Fundamental-analysis

Fundamental Market Analysis for October 7, 2025 EURUSDThe euro (EUR) is weakening against the US dollar (USD) after France's new Prime Minister Sébastien Lecornu and his government resigned on Monday, just hours after the cabinet was announced.
Sébastien Lecornu resigned just a few weeks after his appointment, making his government the shortest-lived in modern French history. This raises concerns about a new political crisis in France and puts some pressure on the euro.
The ongoing US government shutdown may raise concerns about its impact on the country's economy, which could lead to a decline in the dollar and become a favorable factor for the main currency pair.
The Federal Reserve (Fed) is expected to cut rates by 25 basis points (bps) at its October meeting amid signs of a weakening labor market.
Trade recommendation: SELL 1.1665, SL 1.1745, TP 1.1480

Bitcoin hits all-time high, altcoins follow suit!Bitcoin (BTCUSD) has smashed a new all-time high, reaching $125,700! The rally is fueled by steady inflows into spot ETFs, rising institutional interest, expectations of a softer Fed policy, and growing demand for safe-haven assets. Additional tailwinds include tech upgrades across networks and a revival in trading activity. This historic milestone for Bitcoin has lifted the entire crypto market. Investors are turning their attention back to top-10 altcoins — names with strong recognition, loyal communities, and clear development roadmaps.
Ethereum (ETHUSD) — trading around $4,558.76. The network has undergone major upgrades, making wallets more user-friendly and transactions faster and more stable. Layer-2 solutions are gaining traction, fees are becoming more predictable, and the network load is better distributed. As a result, investor interest in ETH-based tools and its ecosystem continues to grow. If Ethereum’s roadmap stays on schedule, it could further strengthen its position as the go-to platform for decentralized applications.
Solana (SOLUSD) — around $233.30. The ecosystem is preparing a high-performance validator module aimed at significantly boosting speed and resilience. This is critical for high-traffic use cases like exchanges, gaming, and micro-payment services. Solana is also set to gain the spotlight during a major industry conference later this year — a typical launchpad for new partnerships, grants, and product announcements. If improvements are implemented successfully, Solana could gain more ground in the fast and low-cost transactions segment.
BNB (BNBUSD) — approximately $1,208.83. The network continues to cut costs for users and developers, expand its toolkit for launching apps, and maintain price stability through regular supply control. The easier it becomes to build and scale on BNB Chain, the greater the volume — and the stronger the token demand. With security and performance updates expected on schedule, BNB remains a top-tier infrastructure asset.
FreshForex analysts believe Bitcoin’s record high reaffirms the global appetite for digital assets, while strong developments across major altcoins add depth and resilience to the market. Q4 2025 could deliver solid returns for active buyers — with the most powerful surge expected in Q1 2026.

Fundamental Market Analysis for October 6, 2025 USDJPYThe yen weakened sharply in response to political news in Japan: the outcome of the leadership race in the ruling party boosted expectations of expanded fiscal stimulus. The market interprets this as a factor of easier domestic financial conditions and a more prolonged period of low rates. Long-dated Japanese government bonds are under pressure, further reducing the yen’s appeal as a funding currency.
The yield differential between the U.S. and Japan remains substantial, and the probability of a Fed rate cut already in October does not fully offset this gap. At the same time, the Bank of Japan remains cautious about the pace of normalisation, watching wage dynamics and services inflation. So far, signals from the regulator do not point to readiness for a series of rate hikes, which keeps the upward bias in USDJPY.
In the short term the pair is sensitive to Japanese authorities’ comments on FX volatility; however, against the current backdrop the fundamental vector remains upward. A move toward 150.950 is our base case; risks include verbal intervention and an abrupt drop in U.S. yields on weak data.
Trading recommendation: BUY 149.950, SL 149.250, TP 150.950

#XAUUSD AnalysisHello friends
#NEW forecast on GOLD
The price continues to support level and retesting the upward trend line .
Price action is moving towards the resistance area around 3950.
By regards, Honeytrading

GBP/AUD – Triangle Breakout (03.10.2025)📊 Setup:
GBP/AUD has broken down from a Triangle Pattern on the 30M chart. Price rejected the resistance zone and confirmed bearish momentum by closing below the trendline support. The breakout signals potential continuation towards lower support levels.
📉 Trade Plan:
Bias: Bearish as long as price remains below the resistance zone and triangle breakout level.
1st Support Target: 2.0273
2nd Support Target: 2.0225
✅ Support Factors:
Triangle breakout pattern
Rejection from resistance zone
1.Ichimoku alignment showing bearish momentum
2.Volume profile showing weakness above current level
#GBPAUD #Forex #Trading #TechnicalAnalysis #PriceAction #TriangleBreakout #ForexSignals #FXTrading #BearishSetup #TradingView
⚠️ Disclaimer:
This analysis is for educational purposes only and not financial advice. Always use proper risk management and do your own research before entering trades.
💬 Support the Analysis:
If you find this useful, Like 👍, Comment 💬, and Follow ✅ for more trade setups & updates.

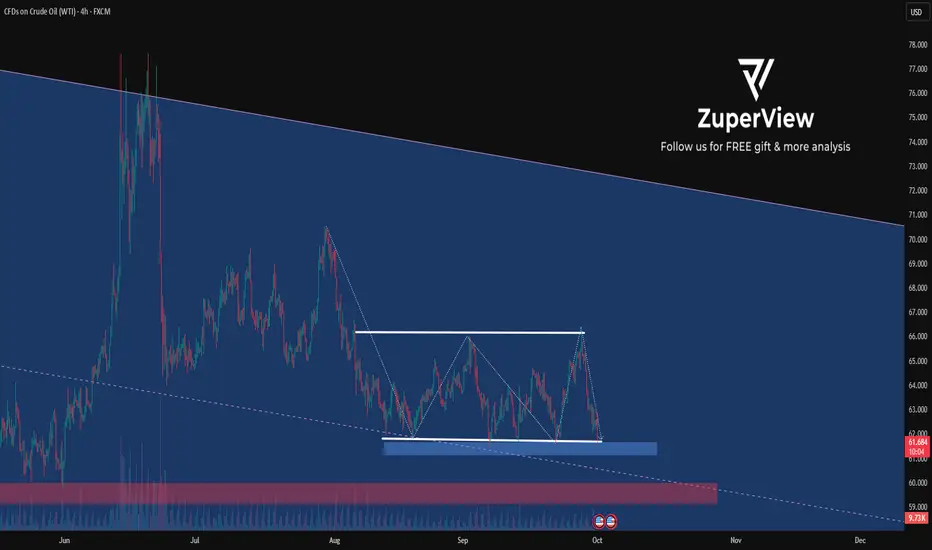
USOIL: Waiting for breakout after sidewaysTo better understand my current outlook on USOIL, please refer to my previous higher-timeframe and fundamental analyses.
* Trend: assessed using at least three trend indicators, with market structure as the primary guide.
** Weak or Reversal Signals: Assessed based on one of our criteria for trend reversal signals.
*** Support/Resistance: Selected from multiple factors – static (Swing High, Swing Low, etc.), dynamic (EMA, MA, etc.), psychological (Fibonacci, RSI, etc.) – and determined based on the trader’s discretion.
**** Our advice takes into account all factors, including both fundamental and technical analysis. It is not intended as a profit target. We hope it can serve as a reference to help you trade more effectively. This advice is for informational purposes only and we assume no responsibility for any trading results based on it.
Please like and comment below to support our traders. Your reactions will motivate us to do more analysis in the future 🙏✨
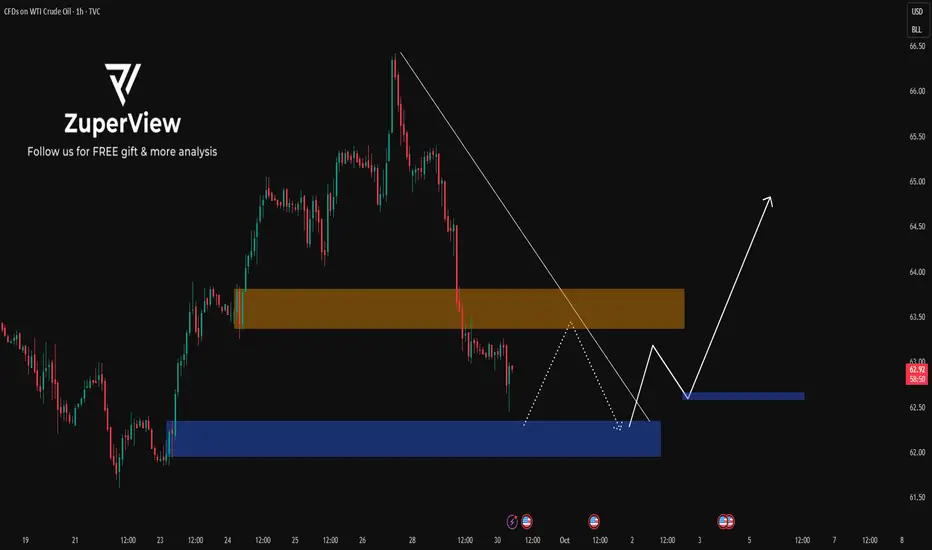
USOIL: Waiting for a reaction at strong supportTo better understand my current outlook on USOIL, please refer to my previous higher-timeframe and fundamental analyses.
* Trend: assessed using at least three trend indicators, with market structure as the primary guide.
** Weak or Reversal Signals: Assessed based on one of our criteria for trend reversal signals.
*** Support/Resistance: Selected from multiple factors – static (Swing High, Swing Low, etc.), dynamic (EMA, MA, etc.), psychological (Fibonacci, RSI, etc.) – and determined based on the trader’s discretion.
**** Our advice takes into account all factors, including both fundamental and technical analysis. It is not intended as a profit target. We hope it can serve as a reference to help you trade more effectively. This advice is for informational purposes only and we assume no responsibility for any trading results based on it.
Please like and comment below to support our traders. Your reactions will motivate us to do more analysis in the future 🙏✨
George Vann @ ZuperView
Fundamental Market Analysis for October 3, 2025 GBPUSDThe pound is holding most of its recent gains, trading near 1.34400–1.34500. The pair is supported by signs of cooling in the U.S. labor market and related expectations of further monetary easing by the Fed in the coming months. Budget uncertainty in Washington maintains some market nervousness, but the impact is uneven: when U.S. yields ease, the pound tends to benefit as the dollar’s rate premium narrows.
From the U.K. side, there are few strong domestic catalysts: the Bank of England maintains a measured approach, preserving flexibility amid slowing inflation and fragile growth. For sterling, this implies less need to compensate currency risk with extra yield. Combined with a modest improvement in global risk appetite, this supports demand for GBP against USD in the mid-1.34–1.35 range.
Fed members’ remarks remain an important backdrop: any signals about the pace of U.S. rate cuts can swiftly shift short-term flows. But with official data releases delayed during the government pause, markets are likely to rely on alternative assessments of employment and inflation expectations—a setup under which the pound keeps an advantage over the dollar if U.S. yields stay soft.
Trading recommendation: BUY 1.34450, SL 1.33950, TP 1.35250

EUR/USD - U.S Government Shutdown ? 📊 Setup:
EUR/USD has successfully broken out of the descending channel on the H1 timeframe. Price is holding above the breakout level, supported by the Ichimoku cloud and a nearby demand zone. With potential U.S. government shutdown news weighing on the dollar, EUR/USD shows strong upside potential.
📈 Trade Plan:
Buy Zone: 1.1710 – 1.1730 (support zone & breakout retest)
1st Resistance Target: 1.1837
2nd Resistance Target: 1.1891
Bias: Bullish as long as price holds above support zone and channel breakout.
✅ Support Factors:
Clear Channel Breakout on H1
Confluence with Ichimoku bullish bias
Fundamental support: Possible U.S. government shutdown → weaker USD outlook
Strong demand zone cushioning downside
#EURUSD #Forex #Trading #TechnicalAnalysis #PriceAction #ForexSignals #FXTrading #Euro #USD #Breakout #TradingView
⚠️ Disclaimer:
This analysis is for educational purposes only and not financial advice. Always do your own research and manage risk before trading.
💬 Support the Analysis:
If this setup adds value, don’t forget to Like 👍, Comment 💬, and Follow ✅ for more timely updates.

Fundamental Market Analysis for October 2, 2025 EURUSDThe euro is holding in the 1.17000–1.18000 area amid a weaker U.S. dollar due to the government shutdown and a deterioration in private employment estimates. The probability of a Fed rate cut at the October meeting remains high, and the pause in the release of some U.S. macro data increases uncertainty and reduces the dollar’s appeal as a safe-haven asset. Against this backdrop, demand shifts in favor of currencies with more resilient domestic demand and lower fiscal risks.
On the European side, the focus is on the flash estimate of HICP inflation. An acceleration in services, alongside moderate dynamics in the energy component, supports expectations that the ECB will pause to assess the price trajectory rather than rushing into further easing. This narrows the rate differential with the U.S. in favor of the euro.
An additional driver of the pair’s strengthening is the decline in U.S. Treasury yields and rising risk appetite in Asia and Europe. Taken together, these factors form a fundamental case for buying EURUSD, provided risk is controlled.
Trading recommendation: BUY 1.17500, SL 1.17250, TP 1.18250

Fundamental Market Analysis for October 1, 2025 USDJPYThe summary of opinions from participants at the Bank of Japan (BoJ) meeting in September showed that board members discussed the possibility of raising interest rates in the near future. This confirmed market expectations that the central bank would stick to its policy normalization course. In addition, growing geopolitical tensions and the US government shutdown may continue to provide some support for the Japanese yen (JPY) as a safe-haven currency, which in turn could be a headwind for the USD/JPY pair.
Meanwhile, the BoJ's stance differs significantly from forecasts that the US Federal Reserve (Fed) will cut borrowing costs twice this year. The latter does not help the US dollar (USD) attract significant buyers. Moreover, the divergence in the policy outlooks of the Bank of Japan and the Fed should favor the lower-yielding Japanese yen and help limit the USD/JPY pair. Therefore, it would be wise to wait for strong follow-through buying before taking a position in anticipation of a significant strengthening.
Trade recommendation: SELL 146.75, SL 147.95, TP 143.95

$4,000 per ounce – the golden target is almost here!Since the start of 2025, gold ( XAUUSD ) has been on a strong upward trend, gaining around $1,200 per ounce (+45%). By September 30, prices surged to an all-time high of $3,867 per ounce. This momentum is setting ambitious price targets and keeping the metal near historic levels. Amid shifting rate expectations and rising demand for safe-haven assets, platinum ( XPTUSD ) is also on the rise, holding above key levels and signaling renewed investor interest in precious metals.
Back in April, FreshForex analysts predicted gold would hit $4,000 per ounce — at the time, the price had just broken above $3,300. Less than six months later, gold has repeatedly set new all-time highs!
4 key drivers of the rally:
A dovish Fed and weaker USD . The market is pricing in more rate cuts — lowering the opportunity cost of holding gold. A softer dollar also makes the metal more attractive to international buyers.
Demand for safe havens . Rising global uncertainty (including risks of a U.S. government shutdown) is pushing capital into traditional shelters like gold — and records tend to be set during such events.
Central bank buying . For the third year in a row, official sector demand remains strong — especially from emerging market regulators — cushioning pullbacks and creating a firm price floor.
ETF inflows . Gold-backed exchange-traded funds are accumulating reserves, boosting investment demand and locking in higher price levels.
As financial conditions ease, uncertainty stays high, and institutional demand holds strong, gold remains a key asset for conservative strategies. While short-term corrections are possible, the upward trend is likely to continue unless core fundamentals reverse. FreshForex analysts believe the $4,000 mark will be crossed soon, and prices could reach $4,200 per ounce by year-end!

USOIL: Sideways-to-lower in a tight bandThis is my previous analysis — feel free to take a look for reference.
1. Institutional Forecast Updates
IEA (Sep 15, 2025):
WTI targets $64.2/bbl for 2025 and $47.8/bb l for 2026
Brent targets $68/bbl for 2025 and $51/bb l for 2026
Goldman Sach (Jul 14, 2025):
WTI targets $63/bbl for H2 2025 and $52/bbl for 2026
Brent targets $64/bbl for H2 2025 and $56/bbl for 2026
J.P. Morgan (May 16, 2025):
Brent targets $64/bbl for H2 2025 and $56/bbl for 2026
www.rigzone.com
www.reuters.com www.jpmorgan.com
2. Key Drivers & Risks
📉 Supply
OPEC+ unwinding cuts of 2.2 mb/d (2024–2025), plus +137 kb/d starting October 2025.
Global supply reached 106.9 mb/d in Aug 2025; projected to rise by +2.7 mb/d to 105.8 mb/d in 2025.
U.S. output hit a record 13.2–13.4 mb/d (2024–2025)
Brazil, Guyana, and Canada are key contributors to non-OPEC+ growth.
U.S. shale breakeven costs: ~$62–68/bbl.
New offshore projects breakeven at ~$47/bbl.
OECD inventories in July 2025: 2,848 million barrels; 58.1 days of forward cover.
✳️ Demand
Global oil demand in 2024: ~103 mb/d (~193 EJ)
2025 demand growth of only +0.7 mb/d (weakest since 2009, excluding 2020).
OPEC projects demand growth of +1.3 mb/d in 2025 and +1.4 mb/d in 2026.
Consumption structure: transport accounts for ~two-thirds of oil demand; >90% of transport energy comes from oil.
Petrochemicals (naphtha, LPG) remain a key driver of incremental demand.
🛑 Politics & Geopolitics
Escalating Middle East tensions: growing risks in the Strait of Hormuz and Red Sea.
Kurdistan–Turkey pipeline (~0.23 mb/d) subject to recurring disruptions.
Venezuela: Chevron faces restrictions on U.S. exports.
OPEC+ often produces ~0.5 mb/d below quota due to capacity limits.
Long-term trend: EV adoption and emission policies structurally weaken demand growth.
✅ Overall View:
Overall, governments both want to bring oil prices down to support their economies and also tend to protect oil companies, since prices are currently low relative to many firms’ breakeven levels.
Prices are likely to edge gradually lower within a narrow range of $70–$50, and it is important to closely monitor factors that could trigger supply–demand shocks.
3. Technical Analysis
* Trend: assessed using at least three trend indicators, with market structure as the primary guide.
** Weak or Reversal Signals: Assessed based on one of our criteria for trend reversal signals.
*** Support/Resistance: Selected from multiple factors – static (Swing High, Swing Low, etc.), dynamic (EMA, MA, etc.), psychological (Fibonacci, RSI, etc.) – and determined based on the trader’s discretion.
**** Our advice takes into account all factors, including both fundamental and technical analysis. It is not intended as a profit target. We hope it can serve as a reference to help you trade more effectively. This advice is for informational purposes only and we assume no responsibility for any trading results based on it.
Please like and comment below to support our traders. Your reactions will motivate us to do more analysis in the future 🙏✨

GBPJPY 2H, TRADE IDEA FOR 30, SEPT 2025.Price successfully broke through the previous day's low and also swept the asian low range and structure, which forms my BIAS for the day bearish as price currently broke a structure, will it hold? as price moves further down to find a next balance.
As usual, my calls or analysis are based on what we see, the current Bias, and from a probability standpoint, meaning that this projection may be or may not be validated, so tread carefully, and as usual, this is not financial advice, trade responsibly

Fundamental Market Analysis for September 30, 2025 GBPUSDSterling is supported by a softer dollar amid U.S. budget uncertainty and the related risk of delays in publishing parts of macroeconomic data. A lower dollar premium with risk appetite remaining moderate underpins demand for the UK currency, especially after the pair defended the 1.34 area.
Domestically, participants focus on fresh assessments of UK growth dynamics and remarks from officials about the inflation outlook. Absent new upside surprises in prices and with moderate expectations for the Fed’s next steps, the short-term balance of factors favors the pound.
The combination of steady interest in developed-market currencies outside the dollar and stabilizing global yields creates a window for further GBPUSD recovery. Risks are skewed toward gradual strengthening as incremental improvements in UK data and a still-soft external backdrop for the dollar drive buying on pullbacks.
Trading recommendation: BUY 1.34250, SL 1.33750, TP 1.35250

ETH/USD - BUILDING MOMENTUM FOR NEXT BULLISH LEGOn the 15-minute ETH/USD chart, we can clearly observe that price action has shifted into a bullish structure after forming a strong impulse move from the lower demand zone. The market respected the higher timeframe liquidity area around 4,140 – 4,150, where buyers stepped in aggressively, creating a solid base for the upward push. From there, a clean series of higher highs and higher lows started to establish, indicating strong bullish momentum in play.
Currently, ETH is respecting the ascending trendline that has been guiding the price upward. Each retest of this trendline has been met with bullish rejections, confirming that buyers remain in control. The price is now consolidating just above the minor supply-turned-demand zone near 4,170, which shows that the previous resistance has flipped into support — a positive sign for continuation.
If the price manages to sustain above this intraday support and trendline, we can expect a potential continuation toward the upside target. Any minor pullback into the demand zone would likely attract buyers again, keeping the bullish structure intact. As long as price stays above the 4,160 zone and does not break below the trendline with strong bearish candles, the bias remains bullish.
Overall, the structure suggests that ETH is preparing for another leg higher, with the projected target in sight. Traders should monitor the price behavior around the support and trendline for confirmation before entering, as clean candle closures above these levels will add confidence to the bullish scenario.

EUR/AUD - Breakout Pattern|Buy Opportunity (26.09.2025)The EUR/AUD pair has been trading inside a descending wedge formation and is now showing a potential breakout to the upside.
🔹 Price successfully tested the trendline resistance and is gaining bullish momentum.
🔹 Buyers are stepping in after multiple rejections near the lower boundary (A–C trendline).
🔹 Breakout above 1.7860 zone opens the path toward higher resistance levels.
📊 Trading Plan:
Buy above breakout zone confirmation
1st Resistance: 1.7929
2nd Resistance: 1.7966
Maintain risk management and wait for candle confirmation.
✨ Trade safe & stay disciplined!
#EURAUD #Forex #Breakout #TradingView #FXAnalysis #PriceAction #ForexTrading #SwingTrading #TechnicalAnalysis #Kabhi_TA_Trading
✅ If you find this analysis helpful, don’t forget to like 👍, comment 💬, and follow 🔔 for more updates.
📌 Disclaimer: This analysis is for educational purposes only. Not financial advice. Trade at your own risk.

Fundamental Market Analysis for September 29, 2025 EURUSDThe euro remains under pressure due to the persistent strength of the U.S. dollar after a series of solid U.S. macro releases and a revived discussion about the risks of a temporary government shutdown. The upward revision to U.S. Q2 GDP growth has strengthened the case for a more cautious pace of Fed easing, supporting yields and the dollar. Against this backdrop, the euro, despite brief rebounds, is trading close to the lows of recent weeks.
Another factor is anticipation of upcoming U.S. releases on inflation and consumer activity, which the market views as critical for the Fed’s late-October decision. In Europe, investors’ attention is focused on the path of further disinflation and subdued growth; this leaves the ECB room for careful easing ahead, narrowing the yield differential to the euro’s disadvantage.
In the near term, the balance of risks tilts toward moderate dollar strength: market participants prefer defensive positioning until the U.S. budget agenda and the next batch of price/activity data are clarified. As long as the euro lacks an additional boost from positive surprises in the euro area, pressure on EURUSD may persist.
Trading recommendation: SELL 1.17350, SL 1.17550, TP 1.16450

#GOLD WILL THE correction continue ATHResistance level:3760-3776-3791
Support levels:3752-3741-3731i expect a pullback 3737-3717 and if the bulls return the price to 3800.
my forecast on #gold is 3880.
By; Honey-trading!

EURUSD Fundamental Outlook🚨 Current Mood:
- Powell’s cautious Fed stance = USD support 🦅
- Germany’s Ifo dropped again = EUR weakness 🇩🇪
- ECB not hawkish enough, still open for cuts = neutral / soft EUR 🏦
📊 Positioning:
- CFTC shows crowded EUR longs → risk of squeeze ⚠️
- Retail traders still buying dips → contrarian bearish 🚫
🔑 What to Expect
- Bullish drivers: 🔼 Strong EU PMIs, upbeat ECB tone, weak U.S. jobs/inflation.
- Bearish drivers: 🔽 More weak EU data, ECB easing hints, hawkish Fed lines.
🎯 Sentiment Snapshot
👉 Macro tone: Bearish tilt for EURUSD
👉 Pros: already long, risk for downside flush
👉 Retail: net long (contrarian bearish)
📌 Conclusion:
Right now, EURUSD is tilted bearish unless Euro data surprises to the upside. Keep eyes on EZ PMIs & U.S. data prints. Sellers may have the edge in the short run. ⚡

Fundamental Market Analysis for September 25, 2025 GBPUSDSterling remains under pressure around 1.34–1.35 following the Fed Chair’s emphasis on data dependence, which strengthened the dollar and tempered expectations for the pace of U.S. policy easing. For the pound this implies a less favorable yield differential in the near term and reduced currency appeal.
Domestically, recent U.K. business activity data pointed to weakness in both manufacturing and services. Against this backdrop, the Bank of England remains cautious and markets are revising the rate path, which also limits upside for the pound. Budget considerations and debates around public finances add to the risk premium on U.K. assets.
External factors — expectations around U.S. PCE and developments in global tariffs — amplify dollar fluctuations and, by extension, volatility in GBPUSD. As long as U.K. data do not show sustained improvement while U.S. indicators underpin the dollar, risks remain tilted to the downside for the pair.
Trade recommendation: SELL 1.34500, SL 1.35150, TP 1.34000
