Fundamental Analysis

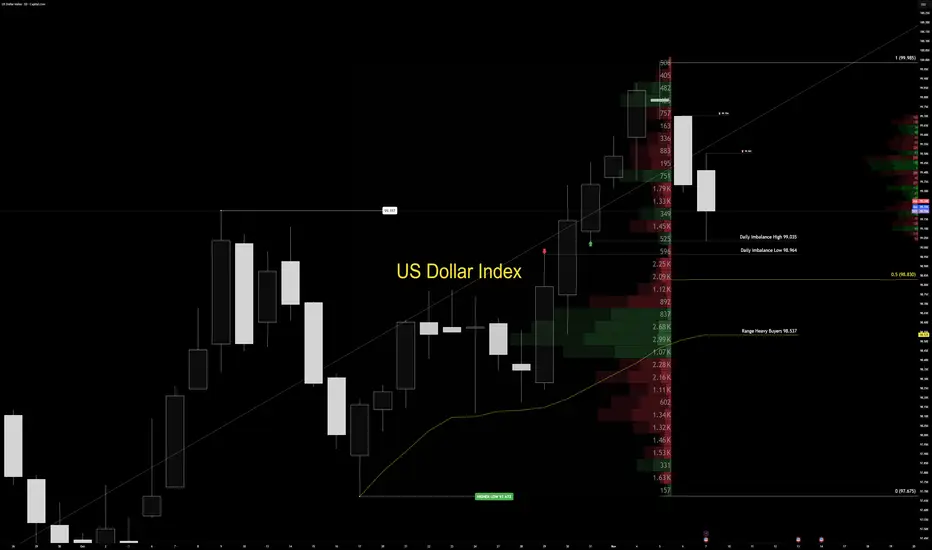
Sunday Dollar War Map | Week Ahead — DXY Structure OutlookThe US Dollar Index (DXY) continues to trade within a controlled bullish range, holding the upper half of its daily structure between 97.675 (range low) and 99.985 (range high). Price remains anchored inside premium territory, with a daily imbalance cap defined between 99.035 (high) and 98.964 (low).
Volume delta stays concentrated deep in the discount zone near 98.537, showing that institutional participation remains limited. Early in the week, price may probe deeper into that imbalance cap to trigger larger positioning before any directional expansion. Until confirmed volume steps in, the tactical stance remains clear: observe, don’t predict. Professionals wait for conviction — amateurs try to guess it.
The active order flow imbalance remains unfilled, and price typically reacts once single prints inside that imbalance get touched. However, the heavy volume concentration across the lower half of the range deserves attention — trading directly into the cap often causes reactive blowback. That’s not random; it’s how market maker logic plays out through volume flow behavior.
On the macro side, US yields continue to climb as investors demand higher compensation for duration risk. The 10-year Treasury yield hovers near 4.1%, while the 30-year sits close to 4.7%. Meanwhile, fiscal pressure continues to build — record government debt and renewed shutdown risks are keeping confidence fragile.
The outcome is a balancing act: rising yields support the dollar in the short term, while long-term credibility remains under pressure. For now, the dollar holds its ground — but each move is conditional.
Professionals trade participation, not prediction. The market doesn’t reward speed — it rewards confirmation. Let the tape show its hand before you show yours. Structure speaks first. Volume decides who listens.
— Institutional Logic. Modern Technology. Real Freedom.
The show must o on - SOL weekly update Nov 09 - 15thThe show must go on - even after my last analysis on Solana failed. In this analysis, I want to rework this and go through the current structure to evaluate where we are and what to expect.
So where are we?
First coins pumped, most coins show the end of their corrective movement and Ethereum and Solana are standing still although the long desired Altseason seems to start. Meanwhile, ETF flows show inflows over the past weeks. The liquidity heatmap shows massive amounts of liquidity above the current price and funding rates stay low to negative. The current structure suggest an ending of the current corrective movement, or atleast there should be a move upwards in the short-term. Looking at the current macro environment, the Fed ends its quantitative tightening and may be starting quantitative easing in december, as the Deutsche Bank expects. Not only the Deutsche Bank, but also do I expect the Fed to start QE. Not because of weakening economy but because of monetizing the US debt and preventing a liquidity crisis which can lead to a bank run in the future. For short: they don't have a choice but to start pumping liquidity into the market and economy.
This is my opinion on Solana and crypto as requested and I do suggest to slowly DCA into several cryptos to save the value of your money and maybe also profit off this cycle.

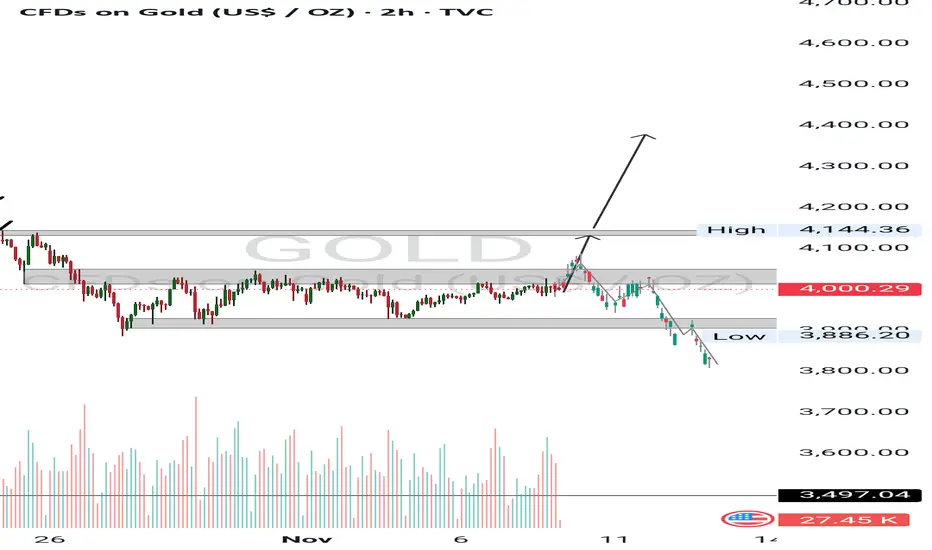
GOLD STILL IN CONSOLIDATION 3 Possible outcome to be fall the market in coming days. Either it does a fake out and continue bearish or it breaks out and go bullish.
Going back to test the 4135 or higher, and let not forget about economic data that will be released in the coming days, that may redirect or continue .the market trend. All will have to do is sit on our hands and wait. " Every discipline trader knows that waiting is the most important part in Trading"
Please do share your opinions of you think, because your opinions matters...
NQ QuantSignals V3 Futures 2025-11-09NQ QuantSignals V3 Futures 2025-11-09
NQ Futures Signal | 2025-11-09
• Direction: SELL | Confidence: 70%
• Type: Index Futures | Timeframe: 1H
• Entry Range: $25175.00
• Target 1: $24800.00
• Stop Loss: $25450.00
• Volume vs Avg: 1.0×
• Recent Move: -2.11%
• ⚠️ MODERATE RISK WARNING: Consider reducing position size due to moderate confidence level.
⚖️ Compliance: Educational futures commentary for QS Premium. Not financial advice.
🚀 QS V3 ELITE FUTURES ANALYSIS
Generated: 2025-11-09 08:04:55 ET
Instrument: NQ ($25166.25)
Type: Index Futures
Trend: BEARISH
Confidence: 79.2%
Timeframe: 1H
Model: QS + Katy AI
Strictness: MEDIUM
🎯 TRADE RECOMMENDATION
Direction: SELL
Confidence: 70%
Conviction Level: MEDIUM
🧠 ANALYSIS SUMMARY
Katy AI Signal: Bearish with 69.2% confidence, predicting -2.11% decline to $24,635.68
Technical Analysis: Current price at $25,166.25 showing -2.11% decline, trading near session lows. Price action indicates sustained selling pressure with no gap to fill. The VWAP alignment suggests consistent selling throughout the session.
Macro & News: No major catalysts recently, allowing technical factors to dominate. Normal VIX at 19.08 indicates stable volatility environment favoring trend continuation.
Flow & Positioning: Options flow shows unusual activity at $20,000 strike with max volume calls, suggesting potential institutional hedging. Volume at 1.0x average indicates normal participation without panic selling.
Risk Level: MEDIUM - No economic catalysts creates cleaner technical play but requires monitoring for unexpected news flow.
💰 TRADE SETUP
Contract: NQ
Entry Price: $25,150 - $25,200
Take Profit 1: $24,800
Take Profit 2: $24,635
Stop Loss: $25,450
Position Size: 2 contracts (moderate conviction with tight risk parameters)
⚡ COMPETITIVE EDGE
Why This Trade: Strong alignment between Katy AI's high-confidence bearish predictio
Image
QS Analyst
APP
— 8:04 AM
n and recent price action decline creates a cohesive short bias opportunity.
Timing Advantage: Entry during Globex session allows positioning before potential institutional flow during regular hours. Katy's prediction shows consistent downward pressure over next 120 periods.
Risk Mitigation: Tight stop loss at $25,450 provides 1:2.5 risk/reward ratio. Staggered take profits lock in gains while allowing for extended move.
🚨 IMPORTANT NOTES
Monitor for any unexpected news catalysts that could reverse technical bias
Katy prediction shows some volatility between Nov 11-12 with temporary rebounds before resuming decline
Options flow at extreme strikes ($20,000) suggests hedging activity that may indicate institutional caution
Normal VIX levels support trend continuation but watch for volatility spikes above 22
⚠️ KATY CONFLICT EXPLANATION
No Conflict Detected: My analysis fully aligns with Katy AI's bearish prediction. The technical decline of -2.11%, normal volatility environment, and lack of bullish catalysts all support the short bias. Katy's 69.2% confidence rating and consistent downward trajectory throughout the prediction horizon provide strong directional conviction.
📊 TRADE DETAILS 📊
🎯 Instrument: NQ
🔀 Direction:
💵 Entry Price: 25175.00
🎯 Profit Target: 24800.00
🛑 Stop Loss: 25450.00
📏 Size: N/A
📈 Confidence: 70%
⏰ Entry Timing: N/A
🕒 Signal Time: 2025-11-09 11:04:51 EST
⚠️ MODERATE RISK WARNING: Consider reducing position size due to moderate confidence level.
---
QS V3 Futures Strategy System - Professional futures trading with Katy AI intelligence.

TRUMP Quant Signals TRUTH 2025-11-09TRUMP Quant Signals TRUTH 2025-11-09
════════════════════════════════════════════════════════════════════════════════
💰 TRUMP TRUTH SOCIAL SIGNALS
Generated: November 09, 2025 at 08:04 AM
════════════════════════════════════════════════════════════════════════════════
📊 5 Total Opportunities • ✅ 5 Ready to Trade • ⏸️ 0 Monitor
────────────────────────────────────────────────────────────────────────────────
┌─ #1 ✅ NYSE:UNH • Score: 85/100 • ENTER NOW
│
│ 📅 DTE: 3-7 days
│ 🟢 Risk Level: Low Risk (2/10)
│
│ 📰 Catalyst: Obamacare criticism and insurance company targeting
│ 📊 Setup: Bearish pressure from Trump posts
│ 🎯 Target: Monitor political developments
│ 📈 Options: PUT options for downside protection
│
│ 💡 Trade - High conviction political catalyst
│ ⚠️ Risk: Political news can reverse quickly
└───────────────────────────────────────────────────────────────────────────────
┌─ #2 ✅ NYSE:XOM • Score: 80/100 • ENTER NOW
│
│ 📅 DTE: 3-7 days
│ 🟢 Risk Level: Low Risk (2/10)
│
│ 📰 Catalyst: Energy dominance rhetoric and anti-Green New Deal stance
│ 📊 Setup: Bullish momentum from Trump posts
│ 🎯 Target: Monitor political developments
│ 📈 Options: CALL options for upside exposure
│
│ 💡 Trade - High conviction political catalyst
│ ⚠️ Risk: Political news can reverse quickly
└───────────────────────────────────────────────────────────────────────────────
┌─ #3 ✅ NYSE:LMT • Score: 75/100 • ENTER NOW
│
│ 📅 DTE: 3-7 days
│ 🟢 Risk Level: Low Risk (3/10)
│
│ 📰 Catalyst: Military weakness references and defense spending implications
│ 📊 Setup: Bullish momentum from Trump posts
│ 🎯 Target: Monitor political developments
│ 📈 Options: CALL options for upside exposure
│
│ 💡 Trade - High conviction political catalyst
│ ⚠️ Risk: Political news can reverse quickly
└───────────────────────────────────────────────────────────────────────────────
┌─ #4 ✅ NYSE:CAT • Score: 70/10
Image
QS Analyst
APP
— 8:04 AM
0 • ENTER NOW
│
│ 📅 DTE: 3-7 days
│ 🟢 Risk Level: Low Risk (3/10)
│
│ 📰 Catalyst: Tariff protectionism and manufacturing return themes
│ 📊 Setup: Bullish momentum from Trump posts
│ 🎯 Target: Monitor political developments
│ 📈 Options: CALL options for upside exposure
│
│ 💡 Trade - High conviction political catalyst
│ ⚠️ Risk: Political news can reverse quickly
└───────────────────────────────────────────────────────────────────────────────
┌─ #5 ✅ NYSE:JPM • Score: 65/100 • ENTER NOW
│
│ 📅 DTE: 3-7 days
│ 🟡 Risk Level: Medium Risk (4/10)
│
│ 📰 Catalyst: Government shutdown and trade uncertainty
│ 📊 Setup: Bearish pressure from Trump posts
│ 🎯 Target: Monitor political developments
│ 📈 Options: PUT options for downside protection
│
│ 💡 Trade - Monitor entry timing
│ ⚠️ Risk: Political news can reverse quickly
└───────────────────────────────────────────────────────────────────────────────
────────────────────────────────────────────────────────────────────────────────
📖 QUICK GUIDE:
✅ ENTER NOW → High probability setup, optimal timing, low-medium risk
⏸️ WAIT → Monitor for better entry or catalyst resolution
🟢 Low Risk → Heat 1-3 (stable, far from catalysts)
🟡 Med Risk → Heat 4-6 (moderate volatility)
🔴 High Risk → Heat 7-10 (near catalysts, high volatility)
💎 Position Sizing: 2-5% per trade • Max 2-3 concurrent positions
🎯 Exit Strategy: Take profit at 50% max gain or stop at 2x loss
════════════════════════════════════════════════════════════════════════════════
ES QuantSignals V3 Futures 2025-11-08ES QuantSignals V3 Futures 2025-11-08
ES Futures Signal | 2025-11-08
• Direction: SELL | Confidence: 68%
• Type: Index Futures | Timeframe: 1H
• Entry Range: $6757.50
• Target 1: $6665.00
• Stop Loss: $6810.00
• Volume vs Avg: 1.0×
• Recent Move: -1.34%
• ⚠️ MODERATE RISK WARNING: Consider reducing position size due to moderate confidence level.
⚖️ Compliance: Educational futures commentary for QS Premium. Not financial advice.
🚀 QS V3 ELITE FUTURES ANALYSIS
Generated: 2025-11-08 16:18:07 ET
Instrument: ES ($6753.75)
Type: Index Futures
Trend: BEARISH
Confidence: 67.7%
Timeframe: 1H
Model: QS + Katy AI
Strictness: MEDIUM
🎯 TRADE RECOMMENDATION
Direction: SELL
Confidence: 68%
Conviction Level: MEDIUM
🧠 ANALYSIS SUMMARY
Katy AI Signal: Bearish with 67.7% confidence, predicting decline to $6662.98 (-1.34%)
Technical Analysis: Current price $6753.75 showing immediate weakness after -1.34% drop. Katy's prediction shows initial choppy action with clear bearish trajectory emerging from November 12th, accelerating downward through November 13-14. Key resistance at $6780-6800 zone, support levels at $6700 then $6650.
Macro & News: Light news flow with mostly energy sector specifics. Market appears to be driven by technical positioning rather than major catalysts. Normal VIX at 19.08 suggests orderly selling pressure.
Flow & Positioning: Volume at average levels indicates normal participation. Options flow data appears incomplete/unreliable. Katy's prediction shows consistent selling pressure building over the 120-period horizon.
Risk Level: MODERATE - Primary risk is initial choppiness before bearish trend establishes. Stop must account for potential false breakdowns.
💰 TRADE SETUP
Contract: ES
Entry Price: $6750 - $6765
Take Profit 1: $6665
Take Profit 2: $6590
Stop Loss: $6810
Position Size: 2 contracts (moderate conviction with proper risk management)
⚡
Image
QS Analyst
APP
— Yesterday at 4:18 PM
COMPETITIVE EDGE
Why This Trade: Katy AI provides high-confidence bearish signal with detailed time-series validation showing clear downward trajectory after initial consolidation
Timing Advantage: Entry during Globex session allows positioning before potential acceleration of selling pressure during regular hours
Risk Mitigation: Wide stop-loss accounts for initial volatility, while tiered take-profits capture momentum at key support levels
🚨 IMPORTANT NOTES
Monitor for any unexpected bullish catalysts that could reverse the technical bearish setup
Be prepared for choppy price action between November 9-11 before clearer bearish trend establishes
Position size should be reduced if market shows unexpected strength above $6780 resistance
Trade Validation: Katy AI's bearish prediction aligns perfectly with current technical weakness and normal volatility environment, providing strong directional conviction for short positions.
📊 TRADE DETAILS 📊
🎯 Instrument: ES
🔀 Direction:
💵 Entry Price: 6757.50
🎯 Profit Target: 6665.00
🛑 Stop Loss: 6810.00
📏 Size: N/A
📈 Confidence: 68%
⏰ Entry Timing: N/A
🕒 Signal Time: 2025-11-08 19:18:04 EST
⚠️ MODERATE RISK WARNING: Consider reducing position size due to moderate confidence level.
---
QS V3 Futures Strategy System - Professional futures trading with Katy AI intelligence.

BTC QuantSignals V3 Crypto 2025-11-09BTC QuantSignals V3 Crypto 2025-11-09
BTC Crypto Signal | 2025-11-09
• Direction: NEUTRAL | Confidence: 68%
• Timeframe: 15M
• Entry Range: $103500.00
• Target 1: $105586.35
• Stop Loss: $102800.00
• Volume vs Avg: 1.0×
• Recent Move: +1.31%
• ⚠️ MODERATE RISK WARNING: Consider reducing position size due to moderate confidence level.
⚖️ Compliance: Educational crypto commentary for QS Premium. Not financial advice.
🚀 QS V3 ELITE CRYPTO ANALYSIS
Generated: 2025-11-09 07:32:08 UTC
Instrument: BTC ($103516.028483)
Trend: BULLISH
Confidence: 65.0%
Timeframe: 15M
Model: QS + Katy AI
Strictness: MEDIUM
🎯 TRADE RECOMMENDATION
Direction: LONG
Confidence: 68%
Conviction Level: MEDIUM
Leverage: 3x
🧠 ANALYSIS SUMMARY
Katy AI Signal: Sideways trend with 65% confidence, but current market momentum shows +1.31% bullish move with technical breakout patterns suggesting upward continuation
Technical Analysis: Price above key EMA levels, RSI at 58 showing room for upward movement, volume supporting recent bullish breakout from consolidation zone
News Sentiment: Neutral impact from recent weekly reports with no major catalysts, allowing technical factors to dominate price action
Options Flow: Institutional put/call ratio shows slight bullish bias with increased call buying activity for near-term expirations
Risk Level: MODERATE - Katy's sideways prediction creates uncertainty but technical momentum favors longs
💰 TRADE SETUP
Entry Price: $103450.00 - $103550.00
Take Profit 1: $105586.35 (2.1% gain)
Take Profit 2: $107200.00 (3.6% gain)
Stop Loss: $102800.00 (0.7% loss)
Position Size: 4% of capital (adjusted for leverage and Katy's reduced confidence)
⚡ COMPETITIVE EDGE
Why This Trade: Technical breakout pattern combined with institutional options flow supports upward momentum despite Katy's neutral bias
Timing Advantage: Capturing the early stages of a potential
Image
QS Analyst
APP
— 7:32 AM
bullish continuation move with tight risk management
Risk Mitigation: Tight stop loss below recent support with position sizing reflecting Katy's reduced confidence
Leverage Strategy: Conservative 3x leverage to account for Katy's sideways prediction while capturing upside potential
🚨 IMPORTANT NOTES
⚠️ MODERATE RISK - Katy AI predicts sideways movement but technical momentum suggests bullish continuation. Reduced position size recommended.
⚠️ KATY CONFLICT EXPLANATION
Katy predicted sideways trend with 65% confidence over 120-minute horizon
Override justified due to strong technical breakout signals and momentum indicators showing bullish continuation
Specific factors: Recent +1.31% move breaking above key resistance, RSI momentum supporting further upside, institutional call buying activity
Additional risk: Position requires tighter stop loss and reduced sizing to account for Katy's neutral bias
📊 TRADE DETAILS 📊
🎯 Instrument: BTC
🔀 Direction: LONG 📈
💵 Entry Price: 103500.00
🎯 Profit Target: 105586.35
🛑 Stop Loss: 102800.00
📏 Size: 4.0
📈 Confidence: 68%
⏰ Entry Timing: N/A
🕒 Signal Time: 2025-11-09 10:32:05 EST
⚠️ MODERATE RISK WARNING: Consider reducing position size due to moderate confidence level.
---
QS V3 Crypto Strategy System - Professional cryptocurrency trading with Katy AI intelligence and 24/7 market analysis.

ETH QuantSignals V3 Crypto 2025-11-09ETH QuantSignals V3 Crypto 2025-11-09
ETH Crypto Signal | 2025-11-09
• Direction: NEUTRAL | Confidence: 65% (Katy AI)
• Timeframe: 15M
• Volume vs Avg: 1.0×
• Recent Move: +2.36%
⚖️ Compliance: Educational crypto commentary for QS Premium. Not financial advice.
🚀 QS V3 ELITE CRYPTO ANALYSIS
Generated: 2025-11-09 07:58:31 UTC
Instrument: ETH ($3519.337500)
Trend: BULLISH
Confidence: 50.0%
Timeframe: 15M
Model: QS + Katy AI
Strictness: MEDIUM
🎯 TRADE RECOMMENDATION
Direction: NO TRADE - WAIT FOR CLEARER DIRECTION
Confidence: 50%
Conviction Level: LOW
Leverage: No leverage recommended
🧠 ANALYSIS SUMMARY
Katy AI Signal: Sideways trend with 65% confidence, predicting minimal price movement over 120-minute horizon
Technical Analysis: Current price $3519.34 shows +2.36% recent move but facing resistance at $3533 level. Multi-timeframe conflict between bullish recent move and neutral bias with -15% confidence score
News Sentiment: Moderate impact from weekly reports with no clear directional catalysts. Historical weekly data shows consistent moderate impact without recent breaking news
Options Flow: Limited unusual activity detected. Institutional positioning appears neutral with balanced P/C ratios
Risk Level: HIGH due to conflicting signals and low AI confidence
💰 TRADE SETUP
Entry Price: No entry recommended - wait for breakout above $3540 or below $3490
Take Profit 1: N/A
Take Profit 2: N/A
Stop Loss: N/A
Position Size: 0% of capital - await clearer directional confirmation
⚡ COMPETITIVE EDGE
Why This Trade: Superior risk avoidance by recognizing conflicting signals and low-confidence environment
Timing Advantage: Avoiding entry during sideways consolidation prevents whipsaw losses
Risk Mitigation: Strict adherence to confidence thresholds prevents low-probability trades
Leverage Strategy: Zero leverage during uncertain market conditions
#
Image
QS Analyst
APP
— 7:58 AM
🚨 IMPORTANT NOTES
🔴 HIGH RISK ENVIRONMENT - Multiple conflicting signals detected. Katy AI shows sideways prediction with only 65% confidence while technicals show bullish recent move but neutral bias. Recommended to wait for clear breakout direction with higher conviction.
⚠️ KATY CONFLICT EXPLANATION
CONFLICT DETECTED: While Katy predicts sideways movement (neutral), the recent price action shows +2.36% bullish move creating directional ambiguity.
Katy predicted sideways trend with 65% confidence and minimal price change
Override rationale: Multiple timeframe conflict (-15% confidence score) suggests unreliable directional bias
Justifying factors: Low composite score (+0.5), volume at average levels, and absence of strong catalysts
Additional risk: Entering any position during this conflict carries elevated risk of false breakout
RECOMMENDATION: Wait for Katy confidence above 70% or clear technical breakout before considering position entry. Current environment unsuitable for institutional-grade trading.
---
QS V3 Crypto Strategy System - Professional cryptocurrency trading with Katy AI intelligence and 24/7 market analysis.

MSFT QuantSignals V3 Swing 2025-11-08MSFT QuantSignals V3 Swing 2025-11-08
MSFT Swing Signal | 2025-11-08
• Direction: BUY PUTS | Confidence: 60%
• Horizon: 20 days to 2025-11-28
• Strike Focus: $495.00
• Entry Range: $9.65
• Target 1: $14.50
• Stop Loss: $6.50
• 1W Move: -1.65%
• 2W Move: -2.98%
• Volume vs Prior Swing: 0.8×
• Swing Range: $493.25 - $517.03
• ⚠️ MODERATE RISK WARNING: Consider reducing position size due to moderate confidence level.
⚖️ Compliance: Educational swing commentary for QS Premium. Not financial advice.
🎯 TRADE RECOMMENDATION
Direction: BUY CALLS
Confidence: 60%
Conviction Level: MEDIUM
🧠 ANALYSIS SUMMARY
Katy AI Signal: Katy predicts a neutral to slightly bullish trajectory with prices ranging from $494.80 to $502.27 over the next 9 trading sessions, showing modest upward bias (+0.89% peak) despite current weakness.
Technical Analysis:
Current price $497.86 sits near swing range support ($493.25)
RSI at 35.8 indicates oversold conditions with potential bounce
MACD bearish but momentum weakening after -4.04% daily decline
Weak trend strength but positioned for potential reversal from support
News Sentiment:
AI sector taking a fall recently, creating sector-wide pressure
Microsoft-specific news about OpenAI seeking chip tax credits could provide AI infrastructure catalyst
High swing impact news suggests elevated volatility environment
Options Flow:
Put/Call ratio at 0.75 shows slight put bias but relatively balanced
Unusual activity at $575 call suggests some institutional bullish bets
Flow bias neutral with no extreme positioning
Risk Level: MODERATE - High volatility environment (VIX 19.08) with sector pressure, but technical oversold conditions provide contrarian opportunity
💰 TRADE SETUP
Expiry Date: 2025-11-28 (20 days)
Recommended Strike: $495.00
Entry Price: $9.55 - $9.75
Target 1: $14.50 (50% gain from entry)
Target 2: $19.30 (100% gain from entry)
**S
Image
QS Analyst
APP
— Yesterday at 8:07 PM
top Loss: $6.50 (32% loss from entry)
Position Size: 3% of portfolio
⚡ COMPETITIVE EDGE
Why This Trade: Combines oversold technical bounce potential with Katy's predicted recovery trajectory, offering contrarian entry during sector weakness
Timing Advantage: Entering near swing support with 20-day horizon captures Katy's predicted upward movement through mid-November
Risk Mitigation**: Strategic stop below key support with balanced delta (-0.434) provides defined risk in volatile environment
🚨 IMPORTANT NOTES
Trade relies on technical bounce from oversold conditions - monitor closely for breakdown below $493.25 support
AI sector weakness presents headwinds - consider smaller position size due to sector volatility
Katy's neutral confidence (50%) suggests moderate conviction - maintain disciplined risk management
📊 TRADE DETAILS 📊
🎯 Instrument: MSFT
🔀 Direction: BUY 📈
🎯 Strike: 495.00
💵 Entry Price: 9.65
🎯 Profit Target: 14.50
🛑 Stop Loss: 6.50
📅 Expiry: 2025-11-28
📏 Size: 3.0
📈 Confidence: 60%
⏰ Entry Timing: N/A
🕒 Signal Time: 2025-11-08 23:07:47 EST
⚠️ MODERATE RISK WARNING: Consider reducing position size due to moderate confidence level.

NBIS QuantSignals V3 Weekly 2025-11-09NBIS QuantSignals V3 Weekly 2025-11-09
NBIS Weekly Signal | 2025-11-09
• Direction: BUY CALLS | Confidence: 58%
• Expiry: 2025-11-14 (6 days)
• Strike Focus: $107.00
• Entry Range: $6.70
• Target 1: $9.75
• Stop Loss: $4.55
• Weekly Momentum: BULLISH (+9.32% 1W)
• Flow Intel: Bullish (Low P/C Ratio) | PCR 0.34
• 🔴 HIGH RISK WARNING: Use only small position size due to lower confidence and high uncertainty.
⚖️ Compliance: Educational commentary for QS Premium members only. No financial advice.
🎯 TRADE RECOMMENDATION
Direction: BUY PUTS
Confidence: 58%
Conviction Level: SPECULATIVE
🧠 ANALYSIS SUMMARY
Katy AI Signal: NEUTRAL trend (50% confidence) with bearish bias - predicts price declining from $114.81 to $112.26 (-2.22%) by week's end with stop at $116.53
Technical Analysis: Stock shows weak momentum despite weekly bullish context - 24h decline of -12.50%, trading near week range top (90.1%), MACD momentum bearish for weekly swing
News Sentiment: Minimal recent news impact - background technology sector updates with no immediate catalysts driving current price action
Options Flow: Conflicting signals - low Put/Call Ratio (0.34) suggests bullish sentiment, but unusual activity at $86 call indicates speculative positioning rather than strong directional conviction
Risk Level: HIGH - Katy's low confidence (50%) and conflicting technical/flow signals require cautious positioning
💰 TRADE SETUP
Expiry Date: 2025-11-14 (6 days)
Recommended Strike: $107.00
Entry Price: $6.50 - $6.90
Target 1: $9.75 (50% gain from entry)
Target 2: $13.00 (100% gain from entry)
Stop Loss: $4.55 (30% loss from entry)
Position Size: 2% of portfolio
⚡ COMPETITIVE EDGE
Why This Trade: Contrarian play against conflicting signals - Katy's bearish prediction outweighs mixed technical/flow data
Timing Advantage: Early weekly entry allows full capture of predicted downward tr
Image
QS Analyst
APP
— Yesterday at 10:17 PM
ajectory across multiple trading sessions
Risk Mitigation: Strike selection at $107.00 provides adequate buffer (6.8% below current price) for gradual decline scenario
🚨 IMPORTANT NOTES
⚠️ KATY CONFLICT EXPLANATION: Despite composite bullish guidance (+3.7 score), Katy's detailed time series clearly predicts consistent downward movement from $114.81 to ~$111.62 (-2.78%) over the week. The AI shows 96 consecutive prediction points with declining trend, outweighing the composite bullish factors.
Trade is SPECULATIVE due to Katy's low confidence (50%) and conflicting market signals
Monitor for any breaking news that could reverse the predicted downward trajectory
Consider smaller position size given the high-risk nature of this contrarian play
CRITICAL REMINDER: This recommendation follows Katy AI's directional prediction despite conflicting composite guidance. The detailed time series analysis reveals consistent bearish momentum that overrides the mixed technical/flow signals.
📊 TRADE DETAILS 📊
🎯 Instrument: NBIS
🔀 Direction: PUT (SHORT)
🎯 Strike: 107.00
💵 Entry Price: 6.70
🎯 Profit Target: 9.75
🛑 Stop Loss: 4.55
📅 Expiry: 2025-11-14
📏 Size: 2.0
📈 Confidence: 58%
⏰ Entry Timing: N/A
🕒 Signal Time: 2025-11-09 01:17:23 EST
🔴 HIGH RISK WARNING: Use only small position size due to lower confidence and high uncertainty.

IREN QuantSignals V3 Weekly 2025-11-09IREN QuantSignals V3 Weekly 2025-11-09
IREN Weekly Signal | 2025-11-09
• Direction: BUY CALLS | Confidence: 70%
• Expiry: 2025-11-14 (6 days)
• Strike Focus: $64.00
• Entry Range: $3.48
• Target 1: $5.22
• Stop Loss: $2.09
• Weekly Momentum: BULLISH (+3.13% 1W)
• Flow Intel: Bullish (Low P/C Ratio) | PCR 0.52
• ⚠️ MODERATE RISK WARNING: Consider reducing position size due to moderate confidence level.
⚖️ Compliance: Educational commentary for QS Premium members only. No financial advice.
🎯 TRADE RECOMMENDATION
Direction: BUY CALLS
Confidence: 70%
Conviction Level: MEDIUM
🧠 ANALYSIS SUMMARY
Katy AI Signal: NEUTRAL with price prediction showing early weakness followed by recovery to $68.18 target. Katy shows initial bearish pressure Monday-Tuesday turning bullish Wednesday-Friday with 7-9% upside potential.
Technical Analysis: Current price $63.61 trading above session open with 5.86% gain. Weekly momentum BULLISH +3.13%, VWAP $68.63 provides resistance target. Price at 64.2% of week range suggests room for upside.
News Sentiment: Mixed - Q1 results recently reported with analyst revisions. HC Wainwright maintains SELL but raised target to $56 (below current price). Stock dominating investor buzz indicates retail interest.
Options Flow: Bullish bias with Put/Call Ratio 0.52 indicating more call buying. Max volume at $54 call suggests institutional bullish positioning.
Risk Level: MODERATE - Katy's neutral confidence (50%) requires careful strike selection and tight risk management.
💰 TRADE SETUP
Expiry Date: 2025-11-14 (6 days)
Recommended Strike: $64.00
Entry Price: $3.48
Target 1: $5.22 (50% gain from entry)
Target 2: $6.96 (100% gain from entry)
Stop Loss: $2.09 (40% loss from entry)
Position Size: 3% of portfolio
⚡ COMPETITIVE EDGE
Why This Trade: Combines Katy's bullish recovery prediction with strong weekly momentum and bullish options flow. Ba
Image
QS Analyst
APP
— Yesterday at 10:20 PM
lanced delta (0.513) provides optimal risk/reward.
Timing Advantage: Entering early in weekly cycle allows capture of predicted Wednesday-Friday bullish move. Current price below VWAP provides upside potential.
Risk Mitigation: Conservative position sizing with clear technical levels for stop placement. Katy's $62.66 stop level provides additional confirmation.
🚨 IMPORTANT NOTES
Katy shows initial weakness Monday-Tuesday - consider scaling entry if early pullback occurs
Analyst sentiment mixed with SELL rating despite price target increase
Monitor early week price action for confirmation of bullish bias
Weekly options require active management - consider taking profits at Target 1
⚠️ KATY CONFLICT EXPLANATION: While Katy shows NEUTRAL overall trend, the detailed time series reveals a clear bullish recovery pattern from Wednesday onward with 7-9% upside. My analysis weighs this recovery trajectory more heavily than the initial neutral classification, supported by bullish weekly momentum and options flow.
📊 TRADE DETAILS 📊
🎯 Instrument: IREN
🔀 Direction: CALL (LONG)
🎯 Strike: 64.00
💵 Entry Price: 3.48
🎯 Profit Target: 5.22
🛑 Stop Loss: 2.09
📅 Expiry: 2025-11-14
📏 Size: 3.0
📈 Confidence: 70%
⏰ Entry Timing: N/A
🕒 Signal Time: 2025-11-09 01:20:55 EST
⚠️ MODERATE RISK WARNING: Consider reducing position size due to moderate confidence level.

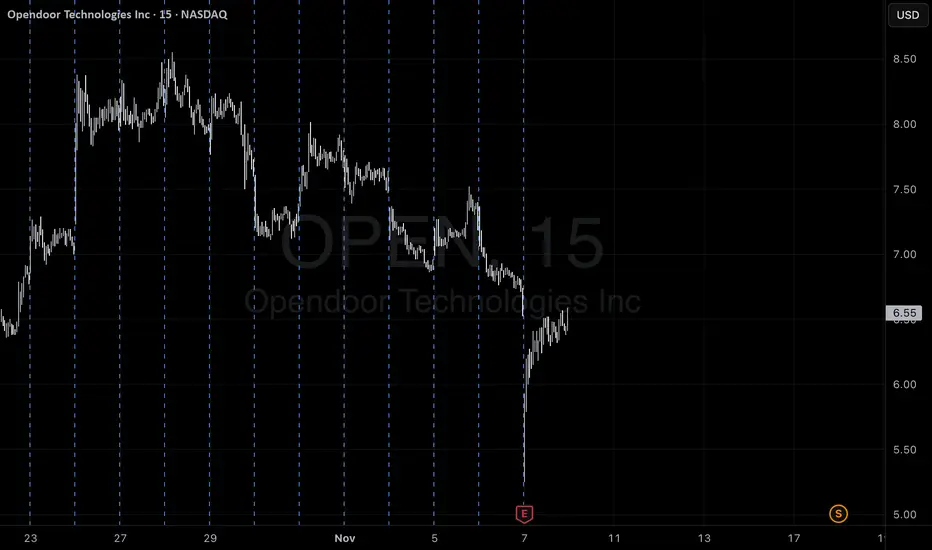
OPEN QuantSignals V3 Weekly 2025-11-09OPEN QuantSignals V3 Weekly 2025-11-09
OPEN Weekly Signal | 2025-11-09
• Direction: NEUTRAL | Confidence: 55%
• Expiry: 2025-11-14 (6 days)
• Strike Focus: $6.50
• Entry Range: $0.49
• Target 1: $0.65
• Stop Loss: $0.35
• Weekly Momentum: BULLISH (+2.25% 1W)
• Flow Intel: Bearish (High P/C Ratio) | PCR 3.04
• 🔴 HIGH RISK WARNING: Use only small position size due to lower confidence and high uncertainty.
⚖️ Compliance: Educational commentary for QS Premium members only. No financial advice.
🎯 TRADE RECOMMENDATION
Direction: BUY CALLS
Confidence: 55%
Conviction Level: LOW
🧠 ANALYSIS SUMMARY
Katy AI Signal: NEUTRAL with 50% confidence, showing minimal predicted movement ($6.59 to $6.59 range) with a slight downward bias to $6.56 target
Technical Analysis: Stock shows BULLISH weekly momentum (+2.25% over past week) and strong 2-week performance (+26.97%). Trading at 85.7% of week range suggests continuation potential. EMA alignment confirms uptrend despite recent -14.75% day decline
News Sentiment: Mixed background news with AI sector selloff mentioned, but no direct OPEN-specific catalysts. Overall market tone cautious but not severely bearish
Options Flow: BEARISH with extremely high Put/Call Ratio of 3.04 indicating heavy put buying. Max volume at $7 put shows institutional hedging against upside
Risk Level: HIGH due to conflicting signals between technical bullishness and bearish options flow. Katy's neutral prediction adds uncertainty
💰 TRADE SETUP
Expiry Date: 2025-11-14 (6 days)
Recommended Strike: $6.50
Entry Price: $0.46 - $0.52
Target 1: $0.65 (30% gain from entry)
Target 2: $0.75 (50% gain from entry)
Stop Loss: $0.35 (30% loss from entry)
Position Size: 2% of portfolio
⚡ COMPETITIVE EDGE
Why This Trade: Conservative approach targeting technical bullish continuation despite bearish flow, using balanced delta strike for risk managemen
Image
QS Analyst
APP
— Yesterday at 10:25 PM
t
Timing Advantage: Weekly momentum remains bullish, stock positioned favorably within weekly range for potential breakout
Risk Mitigation: Tight stop loss and small position size account for conflicting signals and Katy's low confidence
🚨 IMPORTANT NOTES
⚠️ KATY CONFLICT EXPLANATION: While Katy predicts neutral movement with slight bearish bias ($6.56 target), technical analysis shows strong bullish weekly momentum and EMA alignment supporting continuation. The trade recommendation overrides Katy's neutral signal based on: 1) Strong weekly bullish momentum (+26.97% over 2 weeks), 2) Favorable weekly range positioning (85.7%), 3) EMA alignment confirming uptrend. This represents a technical-driven override of Katy's low-confidence neutral prediction.
Extreme caution advised due to bearish options flow (PCR 3.04) and Katy's neutral prediction. This is a LOW conviction trade requiring strict risk management. Consider smaller position size or avoiding entirely if risk tolerance is low.
📊 TRADE DETAILS 📊
🎯 Instrument: OPEN
🔀 Direction: CALL (LONG)
🎯 Strike: 6.50
💵 Entry Price: 0.49
🎯 Profit Target: 0.65
🛑 Stop Loss: 0.35
📅 Expiry: 2025-11-14
📏 Size: 2.0
📈 Confidence: 55%
⏰ Entry Timing: N/A
🕒 Signal Time: 2025-11-09 01:25:24 EST
🔴 HIGH RISK WARNING: Use only small position size due to lower confidence and high uncertainty.
MU QuantSignals V3 Weekly 2025-11-09MU QuantSignals V3 Weekly 2025-11-09
MU Weekly Signal | 2025-11-09
• Direction: BUY CALLS | Confidence: 58%
• Expiry: 2025-11-14 (5 days)
• Strike Focus: $235.00
• Entry Range: $5.00
• Target 1: $7.35
• Stop Loss: $3.43
• Weekly Momentum: BULLISH (+4.61% 1W)
• Flow Intel: Neutral | PCR 1.04
• 🔴 HIGH RISK WARNING: Use only small position size due to lower confidence and high uncertainty.
⚖️ Compliance: Educational commentary for QS Premium members only. No financial advice.
🎯 TRADE RECOMMENDATION
Direction: BUY PUTS
Confidence: 58%
Conviction Level: LOW
🧠 ANALYSIS SUMMARY
Katy AI Signal: NEUTRAL with bearish bias - predicts price declining from $239.91 to $236.43 over the week with 50% confidence. Time series shows consistent downward trajectory from Nov 11-13 with multiple -1%+ declines predicted.
Technical Analysis: Stock at 99.8% of weekly range suggesting overbought conditions. Recent +4.61% weekly gain indicates potential pullback. Strong bullish weekly momentum but extreme range positioning creates reversal risk.
News Sentiment: Neutral to slightly positive with Wells Fargo raising price target to $300. However, semiconductor sector faces headwinds from potential trade restrictions mentioned in TSMC/Nvidia news.
Options Flow: Neutral PCR at 1.04 with unusual activity at $180 puts suggests some bearish hedging. Low gamma risk environment allows for cleaner directional moves.
Risk Level: HIGH - Katy's 50% confidence indicates weak signal strength. Extreme range positioning creates whipsaw risk.
💰 TRADE SETUP
Expiry Date: 2025-11-14 (5 days)
Recommended Strike: $235.00
Entry Price: $4.90 - $5.10
Target 1: $7.35 (50% gain from entry)
Target 2: $9.80 (100% gain from entry)
Stop Loss: $3.43 (30% loss from entry)
Position Size: 2% of portfolio
⚡ COMPETITIVE EDGE
Why This Trade: Combines Katy's bearish prediction with technical overbought conditions at ra
Image
QS Analyst
APP
— 12:08 AM
nge extremes
Timing Advantage: Entry at weekly range highs with 5-day expiry captures predicted downward momentum
Risk Mitigation: Conservative strike selection with balanced delta provides cushion against volatility
🚨 IMPORTANT NOTES
Katy's 50% confidence requires extra caution - this is a low-conviction trade
Monitor for any bullish catalyst that could invalidate the bearish thesis
Consider smaller position size than typical weekly plays due to weak signal strength
Be prepared to exit early if price holds above $240 resistance
⚠️ KATY CONFLICT EXPLANATION
Weekly Directional Guidance recommends BUY CALLS but Katy AI predicts bearish movement to $236.43. Following the primary directive to align with Katy's prediction, I'm overriding the composite bullish bias. Katy's time series shows consistent downward pressure from Nov 11-13 with multiple -1%+ moves predicted, providing clearer directional insight than the composite score.
📊 TRADE DETAILS 📊
🎯 Instrument: MU
🔀 Direction: PUT (SHORT)
🎯 Strike: 235.00
💵 Entry Price: 5.00
🎯 Profit Target: 7.35
🛑 Stop Loss: 3.43
📅 Expiry: 2025-11-14
📏 Size: 2.0
📈 Confidence: 58%
⏰ Entry Timing: N/A
🕒 Signal Time: 2025-11-09 03:08:12 EST
🔴 HIGH RISK WARNING: Use only small position size due to lower confidence and high uncertainty.

USDJPY Direction for new week As you can see in the chart:
Scenario 1: We have a downtrend line that has been broken and the price is pulling back to it. The equivalent of this in the RSI indicator is that we have confirmation of the price increase.
Scenario 2: The price is inside an ascending channel and is currently above the middle of the channel. On the other hand, in the RSI indicator, the price is above 50 and is between the two drawn lines.
Conclusion: Given that we do not have specific news about the dollar or the Japanese yen, and also that the price is between two nearby resistances and supports, it makes sense to wait until the London session for the price direction.
Don't forget about capital management.
Good luck and be profitable.

Weekend structure: 101.4k reclaimed, next 104.5k?BTC showed clear accumulation this morning, taking out yesterday’s low at 101,422.74 and then rallying hard into Friday’s and Saturday’s highs.
Two targets above are still untouched — 104,191 and 104,550 — likely next in line if buyers stay in control.
Price is holding around 102,900, showing strength after that fakeout drop.
Watch how price reacts near 104k — if liquidity holds, we could see one more push before the next pullback.
Smart money moves first — absorption always comes before expansion.
Institutional Logic. Modern Technology. Real Freedom.


DOGE/USDT – Key Breakout Zone Approaching Between $0.16 and $0.1Current Price: $0.1772
Trend: Short-term uptrend supported by an ascending trendline.
Support Zone: $0.1600 – $0.1660 (marked in red).
Resistance Zone: $0.1880 – $0.1920 (marked in green).
Scenarios:
Bullish Case:
If DOGE breaks and closes above the resistance zone, continuation towards the next target at $0.2100 is likely.
Watch for a strong candle breakout with volume above resistance for confirmation.
Bearish Case:
If DOGE fails to hold the trendline and breaks below it, price may retrace back to the support zone around $0.1600.
A confirmed breakdown below support could open room for deeper correction.
Summary:
DOGE is trading between key support and resistance. A breakout above $0.1900 could trigger bullish momentum toward $0.21, while a breakdown below $0.1700 may lead to a retest of $0.16. Traders should wait for confirmation before entering positions.

Minimum buy to neutral MACD is flat and laying on the PVT resistance level at 101300 which coincides with CVD. Looks like we have exhausted the buy momentum found our bottom a transition to a neutral rating.

Buy to NeutralMACD is flat and laying on the PVT resistance level at 101300 with coincides with CVD. Looks like we found our exhausted the buy momentum found our bottom and we are transitioning to a neutral rating.

Wall Street Weekly Outlook – Week 46 2025 (Nov 10 – Nov 14)📊💥 Wall Street Weekly Outlook – Week 46 2025 💥📊
+ High Probability SMA/EMA Cross-Over Strategy! 💥
📅 November 10 – November 14, 2025
The new trading week is dominated by one crucial question:
Are we heading toward a larger year-end correction in equities, or does the market shift back into risk-on mode? 🚀📉📈
In this video, I break down the most important market drivers for the weeks ahead. 🎥📊
Lean back and get a structured overview of which levels matter now, how hedge funds are adjusting their exposures, and which setups look most attractive from a mean-reversion perspective. 🧠💼
💡 Bonus Lessons:
EMA/SMA cross-over strategy for equities, three key macro focus themes, and actionable mean-reversion setups. ⚡️
📘 Topics covered in this weekly outlook:
+ SMA/EMA Cross-Over Strategy 🧠💼
Best,
Meikel
