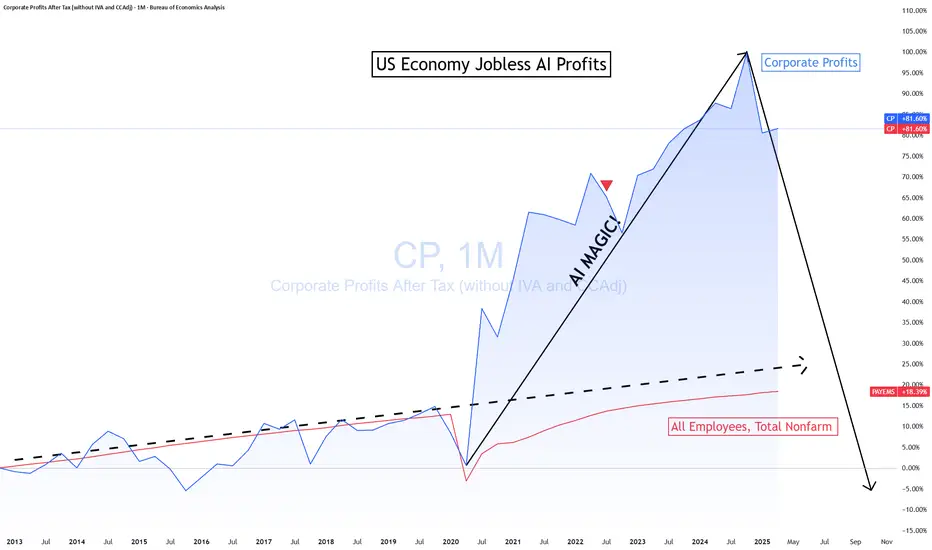
US Economy Jobless Profits!💻 The AI Circle-Jerk Profits 💰
Everyone’s hyped on “AI revolution” headlines — but look under the hood:
Only a handful of companies are actually making real profits.
The rest? Selling picks and shovels to each other, inflating margins with paper demand.
When everybody’s a supplier and nobody’s the end user, that’s not innovation — that’s a loop.
And loops break hard when capital costs rise or sales flatten.
Call it what it is: an AI circle jerk of revenue recycling.
Watch for profit compression once the hype premium fades.
Click boost, follow, comment nicely for more authentic, no BS, raw analysis. Let's get to 5,000 followers. ))
Fundamental Analysis
#NZDUSD: Final Drop Before Swing Bullish ReversalThe NZDUSD has dropped significantly in recent months without any proper bullish correction. Currently, the price is approaching a key level from which we believe it could finally reverse. However, as this is a swing setup, it might take months to complete. We wish you the best in trading and stay careful tomorrow.
Good luck,
Team Setupsfx_

TSLA Triple TopTriple tops = market drop!
As soon as the market tanks, TSLA is in major trouble!
For 5 long years, people have been trying to pump this stock with no good results. Instead, they got a -75% decline and a -66% decline for their efforts.
This stock will fall bidless! All hype with no substance.
The question is, will the market stay up long enough to push it up one more time and sucker in the last fools before the kiss of death? We shall see!
It's now or never!
I am proudly shorting it! As I have successfully done twice before with huge gains. I am telling you, fanboys, point-blank before I get all the hate posts. ))

100k at stake: multi‑TF game plan__________________________________________________________________________________
Market Overview
__________________________________________________________________________________
BTC is in a corrective downswing but sits on a dense demand cluster near 100k; a bounce is possible if a real ≥2H/4H reversal prints. Macro remains risk‑off, so stick to confirmed, measured entries.
Momentum: 📉 Mildly bearish intraday, grinding around 100k with lower highs/lows; rebound depends on a ≥2H/4H trigger.
Key levels:
- Resistances (HTF/LTF): 101,650–102,850 (LTF), 103,450–104,550 (HTF), 105,450 (HTF cap).
- Supports (HTF): 99,700–100,500 (multi‑TF ISPD cluster), 98,350–98,950 (HTF shelf), 97,900 (2H floor).
Volumes: Very High on the 6H sell leg; otherwise normal to moderate by TF.
Multi-timeframe signals: 1D/12H filter Up vs 6H/4H/2H Down — binary area at 99.7k–100.5k; confirmed reversal can target 101.6k–103.5k, failure risks 98.3k–97.9k.
Harvest zones: 100,500 (Cluster A) / 99,600–99,900 (Cluster B) → ideal dip‑buy zones for inverse pyramiding, only on clear rejection and ≥2H close.
Risk On / Risk Off Indicator context: NEUTRAL SELL — aligns with a macro headwind despite buyer cluster proximity.
__________________________________________________________________________________
Trading Playbook
__________________________________________________________________________________
Strategic stance: HTF corrective structure with a major support at 99.7k–100.5k; favor tactical longs only on confirmed ≥2H/4H signals.
Global bias: NEUTRAL SELL bias with selective long attempts on confirmation; key long invalidation: 12H/1D close < 99,700.
Opportunities:
- Tactical buy: Wick rejection + bullish 2H/4H close off 99.7k–100.5k; add above 100,950/101,650.
- Breakout: Reclaim 102,850 then 103,450–104,550 with confirmation → aim 105,450.
- Tactical sell: Firm rejection at 103,450–104,550 with volume → target 101,650 then 100,000.
Risk zones / invalidations:
- Break below 99,700 opens 98,350–98,950 then 97,900.
- Close > 105,450 invalidates tactical shorts and shifts risk higher.
Macro catalysts (Twitter, Perplexity, news):
- Fed: 25 bp cut and end of balance sheet runoff → higher vol, fuzzy guidance.
- US spot ETF flows: persistent outflows streak → macro risk‑off headwind to bounces.
- Elevated geopolitics (Ukraine/Middle East) → headline risk; demand confirmation.
Harvest Plan (Inverse Pyramid):
- Palier 1 (12.5%): 100,500 (Cluster A) + reversal ≥2H → entry
- Palier 2 (+12.5%): 96,500–94,500 (-4/-6% below Palier 1)
- TP: 50% at +12–18% from PMP → recycle cash
- Runner: hold if break & hold first R HTF (103,450–104,550)
- Invalidation: < HTF Pivot Low (98,900) or 96h no momentum
- Hedge (1x): Short first R HTF (103,450–104,550) on rejection + bearish trend → neutralize below R
__________________________________________________________________________________
Multi-Timeframe Insights
__________________________________________________________________________________
Overall, HTFs remain constructively poised while LTFs are still pressured into the cluster.
1D/12H: Up filter but price compressed above 99.7k–100.5k; a ≥2H/4H reversal can extend toward 101,650–103,450.
6H/4H/2H/1H/30m/15m: Intraday downtrends with lower highs; 6H Very High sell volume → need clear absorption at the cluster to flip.
Major divergences/confluences: Strong multi‑TF ISPD floors + HTF shelf 98.35k–98.95k beneath; conflict with risk‑off backdrop → require strong confirmation before sizing up.
__________________________________________________________________________________
Macro & On-Chain Drivers
__________________________________________________________________________________
Macro is mixed‑cautious (risk‑off) while BTC coils on major support — a blend that argues for selectivity and confirmation.
Macro events: Fed cut 25 bp and ends balance sheet runoff from December, keeping directional vol elevated; yields eased modestly with uncertain path; geopolitics stays hot (Ukraine/Middle East).
Bitcoin analysis: US spot ETF outflows persist; equities resilient while BTC lags; key map = 99.7k–100.5k buyers vs 103.45k–104.55k sellers.
On-chain data: Below STH Cost Basis (~112.5k); LTH distribution ongoing; options skew defensive → need inflows/resistance reclaims for sustained recovery.
Expected impact: Risk‑off winds cap bounces; technically a confirmed cluster reversal remains workable, but position sizing should stay prudent.
__________________________________________________________________________________
Key Takeaways
__________________________________________________________________________________
Controlled correction, compressed on a major 100k support.
- General trend: short‑term neutral‑bearish, with conditional rebound if ≥2H/4H confirms.
- Most relevant setup: confirmed tactical buy on 99.7k–100.5k, add above 100,950/101,650, invalidate on 12H/1D < 99,700.
- One key macro factor: persistent ETF outflows reinforcing a risk‑off backdrop.
Stay disciplined: let the market print the signal — act decisively on confirmation, or step aside if 99.7k breaks. 💡

BTCUSD — NY Session🧭 Market Context
Bitcoin just hit 100,966, a key weekly volume level.
This is where big players make their move — either defend or break it.
Right now, patience matters more than prediction.
Let the level show its hand.
📈 Technical View
Structure’s still bearish, but price is testing a major area.
If we close under this weekly level, that shifts the short-term bias.
These volume zones act like algorithmic switches — one move and momentum flips fast.
We’ll see if price pulls back cleanly or just breaks straight through.
No rush — this is the spot to stay calm and read behavior.
🌍 Macro View
The Dollar stays strong because yields are high.
Crypto’s just reacting — not leading.
Money flow’s defensive, and traders are managing risk, not chasing pumps.
Until yields cool off, crypto’s range-bound.
🏛️ Coach’s Take
This level isn’t for guessing.
It’s where pros slow down, not speed up.
React after confirmation — not before it.
🎯 Operator Rule
“Let the level talk before you do.”
— CORE5DAN
Institutional Logic. Modern Technology. Real Freedom.

$MBRX moving averageNASDAQ:MBRX just significantly strengthened its competitive moat with a new Australian patent for Annamycin (stabilized preliposomal lyophilizate), extending protection until at least 2040.
This global IP expansion fuels the bull case, but watch the chart! A sustained move above its key moving average is crucial for a potential stock breakout. #Moleculin #Biotech #Patent

ZKUSDT - A long upward journey is about to beginWe literally caught the bottom in the previous analysis — no doubt about it.
The chart looks extremely bullish and is showing massive upward momentum.
There’s a huge falling wedge pattern that has broken out and been successfully retested on the daily timeframe, with a potential target of 5x from here.
Best Regards:
Ceciliones🎯

$ADEA💥 HUGE patent win for $ADEA! 💥
The Federal Court of Canada ruled Videotron infringed Adeia's key media patents, granting a permanent injunction.
Prediction: This licensing leverage could fuel a massive rally! We see potential for a +50% surge as IP value is unlocked.
#PatentPower #TechLicensing #ADEA #IPWin

Short-term buy tradeA short-term buy trade, with a stop loss below $121.50.
The target profit could be around $137, with the possibility of exiting mid-way if conditions change.

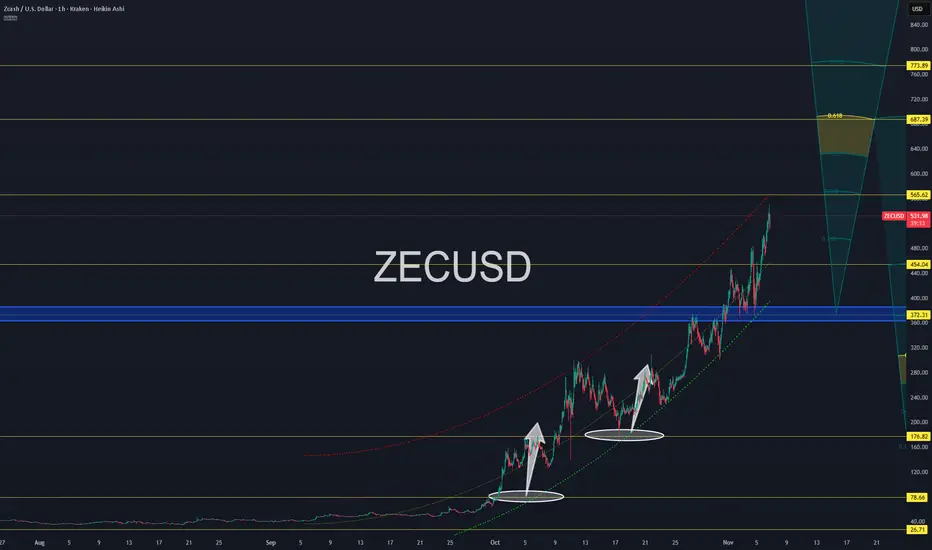
ZECUSD | How I Build Charts From Scratch (Educational Post)ZECUSD | How I Build Charts From Scratch (Educational Post) 🎓📊
This post is a direct follow-up to the video breakdown I shared earlier — and this chart shows the final result after going through the full FXPROFESSOR process .
🧠 What’s different here?
We now see the full level structure come to life . Four main historical zones are layered in. Each level has been respected by price across timeframes — from support flips to breakout launches. It’s all about how memory guides momentum. 🔁
💡 The Fibonacci wedge confirms our structure beautifully, especially the 0.618 zone up at 687.39 — and potentially 773.89 should the move extend.
The blue box around 372.31 is where structure broke out and became acceleration. It’s also the zone where anyone trying to chase early probably gave up — and that’s exactly where structure rewards patience.
This post isn’t a call — it’s an invitation to learn how to read the story inside the candles .
🎥 Watch the full video to see how I built this chart from the ground up, including:
How I pick the best chart version (hint: history wins)
Why true support/resistance is timeless
How to make Fibonacci confirm your bias (not lead it)
📎
Trading Wisdom 📜
Anyone can copy levels — few can understand them. You don’t need 10 indicators to chart like a pro. Just structure, context, and memory. Tools serve the method — not the other way around.
Disclaimer
Disclaimer: What you read here is not financial advice — it’s high-level market philosophy from the FXPROFESSOR himself. Risk is real, and your capital is your responsibility. Learn, adapt, evolve.
One Love,
The FXPROFESSOR 💙
$GBINTR - Britain Interest Rates (November/2025) ECONOMICS:GBINTR 4%
November/2025
source: Bank of England
- The Bank of England voted by a majority of 5–4 to keep the Bank Rate steady at 4%,
in line with expectations.
However, four policymakers voted to reduce borrowing costs by 25bps.
The central bank said inflation has likely peaked and risks of persistent price pressures have diminished. It added that, if disinflation continues, the Bank Rate will probably decline gradually.

ETH - Ranges overviewLet's have a look at ETH and its current trading range.
Similarly to BTC, ETH is currently trading towards its quarterly (3 months) sellside liquidity.
Pretty simple plan on ETH.
IF we fail to hold the current sellside liquidity expect us to trade lower towards the 2.8K-2.5K range.
IF we reclaim the current lows expect us to trade back towards 4K.
No need to frontrun the market. Let it come to you and trade with it.
Stay safe and never risk more than 1-5% of your capital per trade. The following analysis is merely a price action based analysis and does not constitute financial advice in any form.

SOL - Ranges overview Let's have a look at SOL and its current trading range.
I know a lot of you young traders are still hyped and enjoy trading SOL so I'll give you my take on it.
Personally, I've never had a stake in it and don't plan on getting any merely based on the fact that since its inception a hyped fueled and based crypto - BUT for the sake of trading let's have a look at the chart.
We are currently trading back towards the sellside liquidity sitting around 140$.
IF we fail to hold it expect some more pullback towards 120-100$.
IF we hold the 140$ sellside liquidity range (and BTC manages to reclaim 150K) expect SOL to aggressively retrace towards 216$.
As always PATIENCE...PLAN AND EXECUTE.
Stay safe and never risk more than 1-5% of your capital per trade. The following analysis is merely a price action based analysis and does not constitute financial advice in any form.
BTC - Ranges overviewLet's have a look at BTC and its current trading range.
As most are fearing and getting emotional about where BTC 'might be going next' - let's have a look at what the charts are actually telling us.
We are currently trading below the quarterly (3 months) sellside liquidity sitting around 105K.
IF we fail to reclaim it (clean close within the range) expect us to continue lower towards 98-95K.
IF we manage to reclaim 105K expect us to trade back towards the quarterly (3 months) buyside liquidity sitting at 125K.
For the 'bulls' and the 'bears' amongst you guys - the market is like an elevator.
If you want it to eventually 'go up' the elevator first needs to 'go down' . Same logic if you expect the elevator to 'go down' it first needs to 'go up' .
SET YOUR EMOTIONS ASIDE AND FOLLOW THE MARKET...PATIENCE...PLAN AND EXECUTE.
Stay safe and never risk more than 1-5% of your capital per trade. The following analysis is merely a price action based analysis and does not constitute financial advice in any form.

11/6/25 - $rely - Also a smol LT buy here11/6/25 :: VROCKSTAR :: NASDAQ:RELY
Also a smol LT buy here
- really?
- i get the concern. it's priced in fam at high teens growth and 10% fcf yields
- great/ founding mgmt team (that's what to own in this tape)
- "wrong" day to report
- so much to buy here. just avoid the memes that are still trading 2...3...4...5x up on the year (they still have another 90% to go).
- we are now in tax loss season
- this is where the real money is made for the year in 2H of 4Q and 1H of 1Q
- stay awake and grab a cup of joe
V

11/6/25 - $duol - It's a buy... again11/6/25 :: VROCKSTAR :: NASDAQ:DUOL
It's a buy... again
- the future of education
- visionary leader
- taking a step back to take 10 steps forward
- valuation undemanding
- execution flawless
- market being emotional on many thing today
- will revert w/ more targets on downside to buy more
- but it's a 5% position for me today, putting cash to work
V

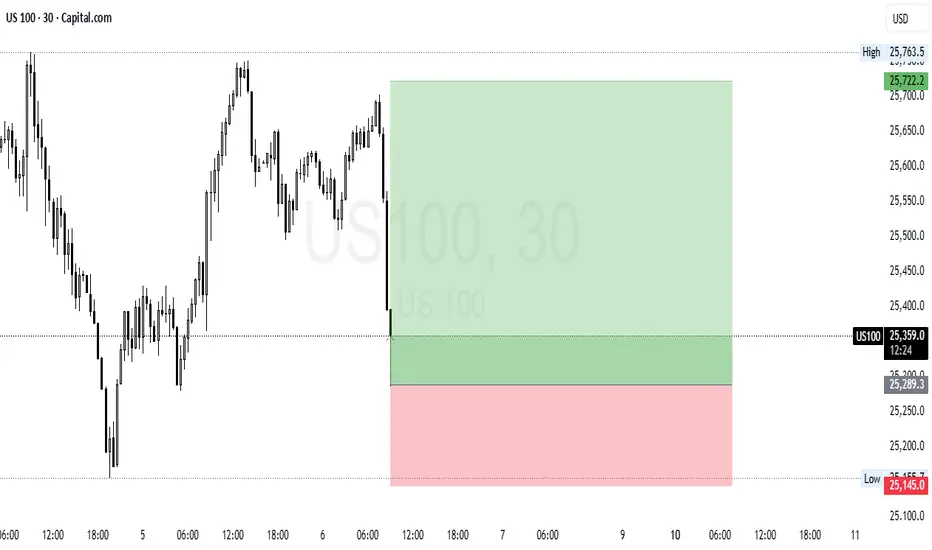
US100 (NASDAQ 100) Long SetupAnalysis:
The market formed a strong bullish leg earlier and is now pulling back to retest a key support zone around 25,300. If price holds this level and shows bullish confirmation (e.g., bullish engulfing or structure break), we could see continuation to the upside.
Bias: Bullish above 25,300
Invalidation: Break below 25,145
Setup Type: Long Position
Entry: Around 25,300 (support retest)
Stop Loss: 25,145
Target: 25,720+
#US100 #NASDAQ100 #PriceAction #TradingSetup #TechnicalAnalysis #ChartAnalysis #BuySetup #TradingView #SmartMoney #Forex #Indices
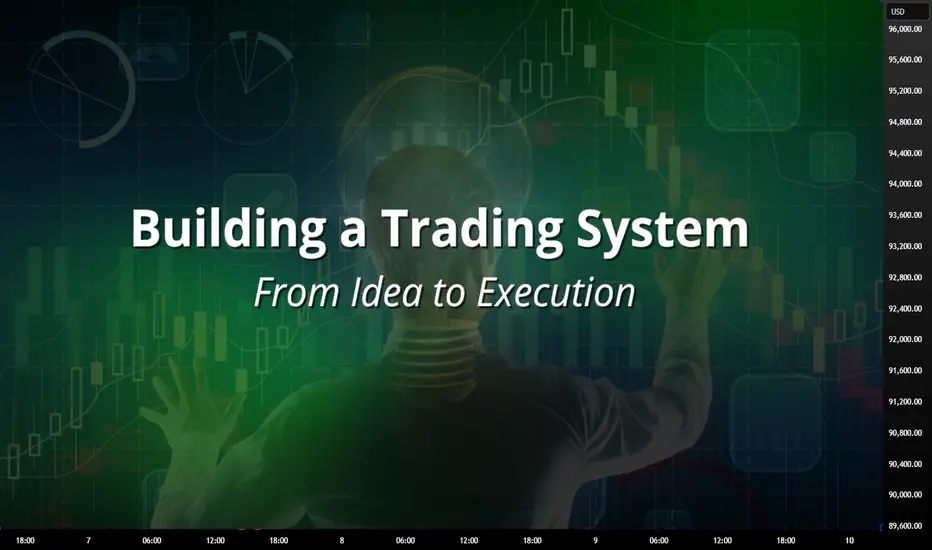
Building a Trading System: From Idea to ExecutionEvery trader starts with an idea — a setup, a pattern, a theory that seems to work.
But until that idea becomes a structured system, it’s just intuition.
A trading system gives your ideas rules, logic, and repeatability.
That’s the difference between a trader who hopes, and a trader who executes.
Define the Core Idea
Every system begins with an observation.
Maybe you notice breakouts after volume spikes, or reversals after RSI divergence.
Whatever the logic, write it down.
A system has to be specific, if you can’t define it clearly, you can’t test it.
Set Your Entry and Exit Rules
Your system should answer three things precisely:
When to enter a trade
When to exit a trade
How much to risk
Ambiguity is the enemy.
Rules make your strategy repeatable, testable, and objective.
Backtest the Logic
Before going live, test your rules on past data.
You’re not looking for perfection, you’re looking for consistency.
If your logic survives bull, bear, and sideways markets, it’s valid.
Track win rate, drawdown, and profit factor — they’ll tell you what’s working.
Execute With Discipline
A system only works if you do.
Follow the rules exactly as tested, even when it feels uncomfortable.
Consistency turns probability into profit — emotions destroy both.
Application
Here we have a very good example from our trading signals where we executed one of our strategies for 10 days. The strategy was designed with detailed inputs, logic and executed with a precise setup in a trading bot.
Refine and Evolve
Once live, keep notes.
Track how the system performs under real conditions.
Make small, measured improvements based on data, not emotion.
A system should evolve, not change its identity.
Redefining and tuning is a part of the process, there is no strategy that lasts forever, everything needs to evolve and adjust!
11/4/25 - $snap - Snap take on stonk and risk11/4/25 :: VROCKSTAR :: NYSE:SNAP
Snap take on stonk and risk
- i actually think we're in a consumer depression at this pt
- there's not a discretionary stock on the planet that's seeing an inflection in consumer sentiment and not also concurrently being whacked over the head by tariffs or some tangential reach around by the current USSA admin
- so i remain heavily cashy
- with that being said
- it's hard to ignore SNAP's MONSTER user base and however you slice it... a daily user of multi-hour attention is worth far more than $100 LTV and it's being priced at a fraction of this
- so while i don't even want to pretend i have a call on the quarter and i've been ice cold lately (so keeping risk small)
- anything that META has done on the ad side can now be probably bootstrapped at SNAP which has shot itself in both feet on this front. so could it be worse under evan's leadership? yeah probs. but we're starting at an obscenely low base here
- second... see "top down" valuation here
- and stock does seem to have found a floor
- finally... the "theme" of next year IMO will include "networks" because those are hard to replicate even in a world of AI and SNAP's user base is not something that gets re-vibe-coded.
- so i'm 1% here leveraged 2-1 on LEAPS (so 2% gross)
- comfy.
- PS - btc is my favorite network
V

$SPY - running out of steam?Macroeconomic backdrop:
Fed uncertainty: Hawkish Fed speak as of this morning and post-Fed interest rate decision overall, the market’s confidence in continuing rate cuts is fading.
Labour market cracks: Ongoing job-cut headlines from large-caps hint at weakness, and continued signs of a cooling job market could weigh on consumer sentiment.
Momentum factor losing strength: High-beta speculative names such as NYSE:IONQ , NYSE:OKLO , NYSE:JOBY , and NASDAQ:KTOS have begun to roll over before the weakness in AMEX:SPY - often an early sign that the broader momentum is weakening.
Technicals:
The rally failed to sustain a breakout above the $685 resistance zone, showing exhaustion near prior swing highs.
Volume divergence and flattening short-term moving averages support the idea that upside momentum is waning.
If macro sentiment stays negative, the next logical retracement target sits near the $642 Fib support, aligning with prior consolidation levels.
Stop-loss: $692 - just above the all-time high, to protect against a renewed momentum leg higher.
Thesis:
After an extended move with minimal pullback, SPY looks vulnerable to a short-term correction. Macro indecision, fading momentum, and sector-wide complacency all point to a market that could start pricing in overvaluation relative to fundamentals.
Bull Flag + breakout catalystBull Flag technical pattern + news of the first US franchise location this morning. Primed for a breakout.

Gold breaks through $4,000, has the bulls returned?You might be surprised if I said gold could continue to decline? But the truth is, I'm not surprised. I see this round of trend very clearly: the break below the 4000 mark was just a brief "acceleration" rather than a true reversal of direction. After the price broke through, it quickly rose to around 4017. This performance is more like an emotional release than a trend reversal. After all, the 4000 level has been breached or recovered many times before. There have been too many short-term fluctuations, and the real significance has already been digested by the market's inertia. I maintain a bearish outlook because the chart structure has reached the testing area of the channel's low point, a key position I have repeatedly emphasized. There are only two possibilities for the trend: either the market will soar upwards and return to the upward channel, or it will begin a new round of decline. What I want to seize is the volatility opportunity in the latter. Looking at the key levels: the highs this week are 4050, 4040, and 4030. If the rebound stops in the 4020-4030 area, then a short-term top has likely appeared. At this point, entering a short position would be extremely cost-effective. As long as the market cannot regain a foothold above 4030, I remain firmly bearish, with targets to watch for a break below 4000 and further down to the 3980-3960 area. I don't strive for perfect predictions, but every move I make must be logical, structured, and valuable. When opportunities arise, do not hesitate or waver; execution is key. Seek victory through stability and do not blindly follow the noise of the market.

#Truecaller 100% profit !!!!Truecaller AB reports 9% revenue growth 📈 to 506 million SEK and a net profit of 118 million SEK 💰. The “For Business” segment rises 53% 🚀, and premium subscribers 48% 🌟. Analysts forecast 17% annual growth 📊 and a target price of 60 SEK — investors could achieve nearly 100% profit 💵.
#Truecaller #StockMarket #Investing #Growth #TechStocks
