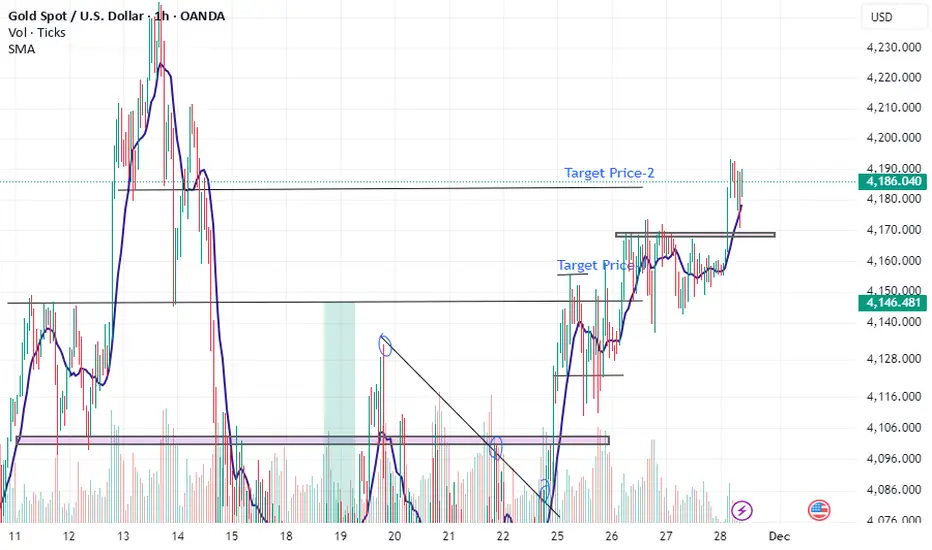
As predicted and analysist, it works 100% and reached Target As posted on 21 Nov, the Gold target prices have been reached as predicted and analysed.
For the references, pls take down my previous post on 21st Nov
Mostly, Traders' activities will be slow at the end of the Year in December. The next post, which will be a prediction, will be posted soon.
Fundamental Analysis
EUR/JPY Price Outlook – Trade Setup📊 Technical Structure
TICKMILL:EURJPY EUR/JPY holds steady above the 180.63–180.79 support zone, maintaining its short-term bullish structure. Price continues to trade above key moving averages and shows a constructive recovery from the support area. As long as the pair stays above support, upside momentum remains favoured.
The chart reflects a bullish continuation pattern:
Support zone: 180.63 – 180.79
Resistance zone / target area: 181.38 – 181.54
While price stays above 180.63, dips into support are likely to attract buyers, with upside potential toward the 181.38–181.54 resistance band. A 4H close below 180.63 would invalidate the bullish scenario and expose the 180.20 region.
🎯 Trade Setup
Idea: Buy dips into support, targeting a move into the 181.38–181.54 resistance zone.
Entry: 180.79 – 180.63
Stop Loss: 180.56
Take Profit 1: 181.38
Take Profit 2: 181.54
Risk–Reward Ratio: ≈ 1 : 2.74
Bias stays constructively bullish while price holds above 180.63–180.79 on a closing basis.
A decisive break below 180.63 would weaken the bullish outlook.
🌐 Macro Background
According to FXStreet, EUR/JPY trades slightly softer near 181.05 as the Japanese Yen finds mild support from verbal intervention by Japanese officials. Market participants also await Germany’s Retail Sales and CPI inflation data, which could influence EUR volatility.
EUR side:
Price action remains supported by a strong medium-term uptrend, trading above the rising 100-day EMA.
RSI stays in bullish territory, signalling healthy but controlled momentum.
JPY side:
Verbal intervention from Japanese authorities provides temporary strength to the Yen.
However, broader market sentiment remains stable, limiting JPY safe-haven demand.
Overall, EUR/JPY maintains a bullish bias while price holds above support, with upside targets aligned toward the next resistance zone.
🔑 Key Technical Levels
Resistance zone: 181.38 – 181.54
Support zone: 180.63 – 180.79
📌 Trade Summary
EUR/JPY preserves a bullish continuation structure above the 180.63–180.79 support band. The setup favours buying dips toward support with targets placed in the 181.38–181.54 resistance zone. Traders should watch German macro data and any new Japanese intervention commentary, which may affect short-term volatility.
⚠️ Disclaimer
This analysis is for reference only and does not constitute trading advice. Trading involves significant risk, and proper risk management is essential.

GOLD: Triangle Breakout Imminent! Dual Setup for Next Big Move🔥 #GOLD — Massive Triangle Breakout Coming!| Dual Trade Setup (Long & Short Ready) 🔥
#Gold is compressing inside a well-defined symmetrical triangle, signaling a major volatility expansion ahead. Price is currently respecting both trendlines, creating a high-probability breakout zone.
I have prepared two trade scenarios depending on where the breakout occurs:
Bullish Scenario
A strong candle close above 4180 will confirm an upside breakout. This level is the key resistance where buyers are expected to take control.
Target remains the upper measured move at 4370, with a protective SL below 4018.
Bearish Scenario
If #Gold fails to break higher and instead breaks below the triangle support and 4018, this will activate a bearish continuation setup.
Downside target sits at 3890, aligning with the next major support area.
The plan is simple: No early entries — wait for confirmation.
This symmetrical triangle is maturing, and the next breakout is likely to be explosive.
Use disciplined risk management and follow the structure.
#GOLD #XAUUSD #GoldAnalysis #PriceAction #TrianglePattern #BreakoutTrading #ForexSignals #TradingSetup #BullishScenario #BearishScenario #RiskManagement #DayTrading #SwingTrading #ChartAnalysis #TradingViewCommunity

EURUSD moving higherEURUSD is holding above 1,1580 and is heading toward a retest of the previous high.
We’re watching for the formation of a higher low, which could provide a potential buying opportunity.
The target remains a test and possible break of the prior high.
Monitor the daily close and look for confirmation of a continued move to the upside.

Indonesia-South Africa Deal
Channel: ANI News
Tittle: Indonesia Vice-President reaches South Africa to join world leaders at G20 Summit
May Peace & Blessings be Upon You ,
He is Raka, the son of Joko Widodo, and he attended the G20 Summit.
There will be lot of investment and policy update:
-Indonesia-South Africa will have Visa Free entry
-Digital Tech(Example-Payment, Land, Crypto etc)
-Energy Sector
-Green Sector
This is Guaranteed. Very soon it will be in media.
Please check our last year 2024 posts / books:
“Jul 12 2024 · 7:05 AM: No New Global Investor should Purchase or Enter the Global Market right now. Let all Election finish , as Huge Global Laws are coming on 2025.”
Related industries must consider this Point in their annual research. Check our “VIP Letter” for
Entry/Exit Strategy.
> Smart people position themselves.> Stop asking what's going up or down today start asking why
>Wealth doesn't come from predicting the future perfectly it comes from preparing for a range of outcomes and positioning yourself accordingly right now with the market
= Win isn't about avoiding risk it's about managing it intelligently
Thank You
Sulaiman Solution

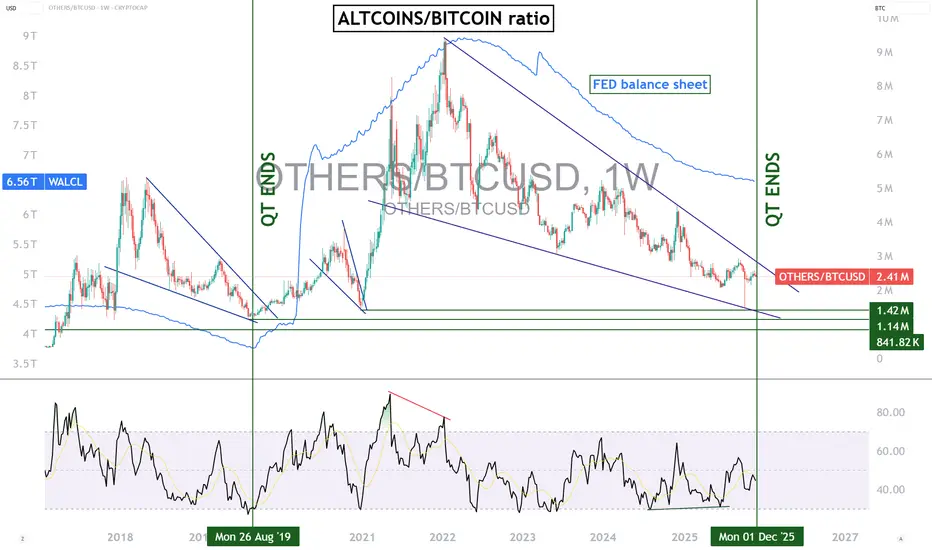
Altcoins, a rebound thanks to the end of the Fed’s QT?The U.S. Federal Reserve is expected to end its quantitative tightening (QT) program starting on December 1, 2025. This prospect raises many questions within the crypto community, particularly regarding the possibility of a scenario similar to that of August 2019, when the end of QT coincided with a renewed strength in the altcoin market relative to Bitcoin. While the comparison is tempting, it nevertheless deserves careful examination.
In 2019, the end of QT marked a turning point: the gradual easing of monetary conditions helped improve investors' risk appetite. The altcoins/BTC ratio then began to rise, reflecting a rotation toward more speculative assets. The macro environment played a role: easing bond yields, greater liquidity, and a still relatively young crypto market where flows could quickly shift.
The situation in 2025 presents some parallels, but also significant differences. On the macroeconomic level, the end of QT could again signal a stabilization of monetary policy, or even a transition toward a less restrictive stance. In this context, renewed interest in riskier assets — including altcoins — remains plausible. Historically, phases of Fed balance-sheet expansion or slowing contraction have often supported overall liquidity, which can benefit cryptocurrencies.
However, several factors temper this analogy. First, the crypto market is now more structured and institutionalized than in 2019. Bitcoin occupies a much stronger place as a macro-correlated asset, supported by the presence of ETFs and growing institutional recognition. This dynamic may limit, at least partly, the massive capital rotation into altcoins observed in previous cycles.
Second, altcoins themselves now evolve in a far more competitive landscape than six years ago. Market "natural selection" could slow down a homogeneous rise: some projects may benefit far more than others.
Ultimately, the end of QT in December 2025 could create a more favorable environment for a relative outperformance of altcoins versus Bitcoin, similar to 2019. But this scenario will depend on many macroeconomic, structural, and crypto-specific factors. Analytical caution therefore remains essential, even if the end of the Fed's QT is clearly a theoretically positive factor for altcoins.
DISCLAIMER:
This content is intended for individuals who are familiar with financial markets and instruments and is for information purposes only. The presented idea (including market commentary, market data and observations) is not a work product of any research department of Swissquote or its affiliates. This material is intended to highlight market action and does not constitute investment, legal or tax advice. If you are a retail investor or lack experience in trading complex financial products, it is advisable to seek professional advice from licensed advisor before making any financial decisions.
This content is not intended to manipulate the market or encourage any specific financial behavior.
Swissquote makes no representation or warranty as to the quality, completeness, accuracy, comprehensiveness or non-infringement of such content. The views expressed are those of the consultant and are provided for educational purposes only. Any information provided relating to a product or market should not be construed as recommending an investment strategy or transaction. Past performance is not a guarantee of future results.
Swissquote and its employees and representatives shall in no event be held liable for any damages or losses arising directly or indirectly from decisions made on the basis of this content.
The use of any third-party brands or trademarks is for information only and does not imply endorsement by Swissquote, or that the trademark owner has authorised Swissquote to promote its products or services.
Swissquote is the marketing brand for the activities of Swissquote Bank Ltd (Switzerland) regulated by FINMA, Swissquote Capital Markets Limited regulated by CySEC (Cyprus), Swissquote Bank Europe SA (Luxembourg) regulated by the CSSF, Swissquote Ltd (UK) regulated by the FCA, Swissquote Financial Services (Malta) Ltd regulated by the Malta Financial Services Authority, Swissquote MEA Ltd. (UAE) regulated by the Dubai Financial Services Authority, Swissquote Pte Ltd (Singapore) regulated by the Monetary Authority of Singapore, Swissquote Asia Limited (Hong Kong) licensed by the Hong Kong Securities and Futures Commission (SFC) and Swissquote South Africa (Pty) Ltd supervised by the FSCA.
Products and services of Swissquote are only intended for those permitted to receive them under local law.
All investments carry a degree of risk. The risk of loss in trading or holding financial instruments can be substantial. The value of financial instruments, including but not limited to stocks, bonds, cryptocurrencies, and other assets, can fluctuate both upwards and downwards. There is a significant risk of financial loss when buying, selling, holding, staking, or investing in these instruments. SQBE makes no recommendations regarding any specific investment, transaction, or the use of any particular investment strategy.
CFDs are complex instruments and come with a high risk of losing money rapidly due to leverage. The vast majority of retail client accounts suffer capital losses when trading in CFDs. You should consider whether you understand how CFDs work and whether you can afford to take the high risk of losing your money.
Digital Assets are unregulated in most countries and consumer protection rules may not apply. As highly volatile speculative investments, Digital Assets are not suitable for investors without a high-risk tolerance. Make sure you understand each Digital Asset before you trade.
Cryptocurrencies are not considered legal tender in some jurisdictions and are subject to regulatory uncertainties.
The use of Internet-based systems can involve high risks, including, but not limited to, fraud, cyber-attacks, network and communication failures, as well as identity theft and phishing attacks related to crypto-assets.
XAU/USD Price Outlook – Trade Setup📊 Technical Structure
OANDA:XAUUSD Gold (XAU/USD) remains supported after rebounding from the 4,154–4,160 support zone, keeping the short-term bullish structure intact. Price has broken above the 4,170–4,175 barrier and is now consolidating just below the 4,190–4,196 resistance zone, with buyers looking to extend gains as long as support holds.
The chart shows a bullish continuation pattern:
Support zone: 4,154 – 4,160
Resistance zone / target area: 4,190 – 4,196
As long as gold stays above 4,154, dips into support are likely to attract buyers, with upside potential toward 4,190–4,196. A decisive 4H close below 4,154 would invalidate the bullish setup and expose the 4,130 region.
🎯 Trade Setup
Idea: Buy dips into support, targeting a move toward the 4,190–4,196 resistance zone.
Entry: 4,160 – 4,154
Stop Loss: 4,149
Take Profit 1: 4,190
Take Profit 2: 4,196
Risk–Reward Ratio: ≈ 1 : 2.76
Bias remains constructively bullish while price holds above 4,154–4,160 on a closing basis.
A break below 4,154 would signal weakening momentum.
🌐 Macro Background
According to FXStreet, gold holds firm near a two-week high as rising expectations for a December Fed rate cut continue to support bullish sentiment. Comments from multiple Fed officials confirmed that further easing is a “live option,” helping gold absorb both a modest USD rebound and the broader risk-on tone.
Key drivers:
Fed rate cut expectations reinforced by dovish remarks from Williams, Waller, and Miran.
Kevin Hassett emerging as the frontrunner for Fed Chair, expected to support aggressive rate cuts.
Mixed US data failed to alter the easing outlook, keeping USD capped.
Russia–Ukraine developments keep geopolitical uncertainty in play, maintaining gold’s safe-haven appeal.
Despite improved risk appetite, gold’s bullish bias remains intact due to persistent USD softness and expectations of lower US rates. The fundamental backdrop continues to favor upside moves.
🔑 Key Technical Levels
Resistance zone: 4,190 – 4,196
Support zone: 4,154 – 4,160
📌 Trade Summary
Gold remains in a bullish continuation structure above the 4,154–4,160 support band. As long as this zone holds, the setup favours buying dips and targeting 4,190–4,196 where previous supply pressure may reappear. Fed rate cut expectations and geopolitical tensions underpin the bullish narrative, while risk sentiment limits immediate downside.
⚠️ Disclaimer
This analysis is for reference only and does not constitute trading advice. Trading involves significant risk, and proper risk management is essential.

XAUUSD – Ascending channel in play, eyes on the 4,240 regionXAUUSD – Ascending channel in play, eyes on the 4,240 region
Brian – Buying the dip within structure, watching for a fade at higher resistance
Market overview & structure
On the H4 chart, gold is trading neatly inside a well-defined ascending channel, printing higher highs and higher lows. The current leg is pushing up towards the 4,237–4,240 area, which lines up with:
The upper boundary of the channel
A key resistance zone
The 1.618 Fibonacci extension and resting liquidity above recent highs
So for now, the broader bias remains bullish, but as price creeps closer to 4,240, the risk of profit-taking and short-term selling naturally increases.
Wave & technical context
This move is an extension of the previous bullish structure after price broke out of the old descending channel and started to build a new bullish one.
Liquidity levels around 4,193 and above suggest the market has been building positions and still has room to drive price into the higher resistance band.
The buy zone around 4,154–4,157, near the lower edge of the channel, is where buyers are likely to step back in to defend the trend.
As long as price holds above 4,150–4,154, the continuation scenario towards 4,240 remains the higher-probability path.
Key zones & trading plan
Primary scenario – Buy with the trend
Buy zone: 4,154–4,157 (channel support + marked buy zone).
Idea: Wait for a pullback towards the lower boundary of the channel, or a brief liquidity sweep into this region, then look for a clear rejection candle on H1/H4 before going long.
Targets:
Short term: 4,190–4,200 (mid-channel / interim liquidity).
Extended: 4,237–4,240 (major resistance + 1.618 Fib extension).
This is a trend-following “buy the dip” setup, more suited to swing and short-term position traders rather than scalpers.
Secondary scenario – Short-term fade from 4,237–4,240
Sell zone: 4,237–4,240 – confluence of strong resistance and the 1.618 Fibonacci extension.
Idea: If price tags this zone and shows clear rejection (long upper wicks, bearish reversal pattern on H1/M15), it may offer a counter-trend short back towards the middle of the channel or the 4,190–4,200 support area.
As this is a counter-trend play:
Keep position size smaller than the main long idea.
Use a tight stop above 4,240 and avoid widening it out of emotion.
Macro and liquidity backdrop
Liquidity is likely to thin out towards the end of the session with the US Thanksgiving period in play, which can lead to the odd sharp spike or stop-hunt, especially around obvious liquidity pools.
On the political front, headlines such as Mr Trump’s comments about “permanently suspending immigration from third-world countries” add to broader policy uncertainty, but the impact on gold is indirect via risk sentiment rather than a direct driver.
It’s also worth noting that silver has been rallying strongly, supported by solar-related demand and supply concerns – a bit of a “silent workhorse” at the moment. That doesn’t remove gold’s role, but it does show that precious metals as a whole are attracting capital.
Strategy & risk management
For now, my focus is on buying dips around 4,154–4,157 in line with the ascending channel, and only looking for tactical shorts if price clearly rejects the 4,237–4,240 band.
I prefer not to open fresh trades when US liquidity is extremely thin or straight into major holiday sessions, as spreads can widen and price can behave erratically.
If we see a decisive close below the buy zone and a clean break of the channel structure, this bullish plan is invalidated – at that point it’s better to step aside and reassess rather than forcing trades.
What do you reckon – does this structure still favour the bulls, or are you leaning towards a deeper correction from the 4,240 region? Feel free to share your view in the comments.

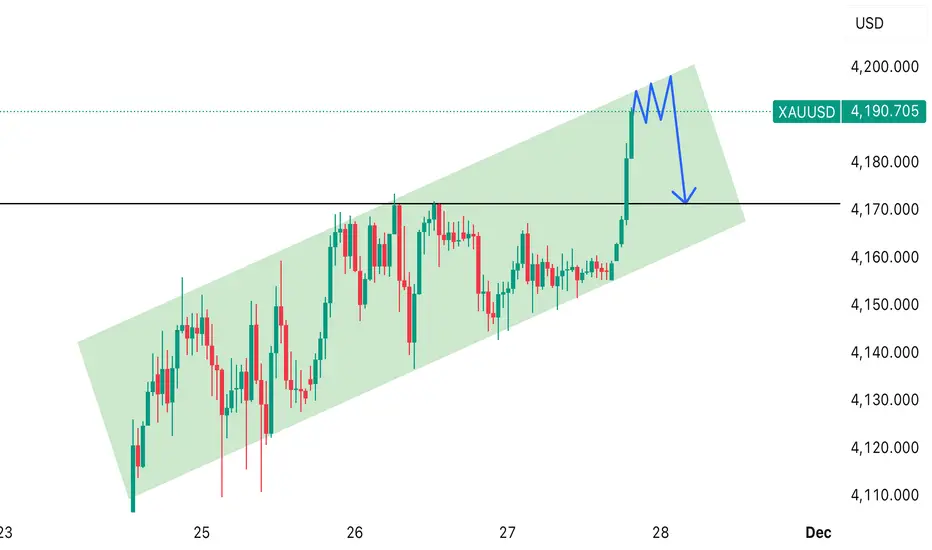
Gold is at the top of the channel and showing rejection, indicatGold (XAUUSD) is moving inside an upward channel. The price has reached the top of the channel and is showing rejection. The blue M-pattern suggests a possible pullback downward, targeting around the 4,170 zone
XAUUSD Roadmap: Multi-Scenario Outlook Into Early DecemberThe chart shows Gold (XAUUSD) on the 4H timeframe approaching a major confluence area:
Price is pressing against a descending trendline resistance (red diagonal).
It is hovering around 4,187–4,190, a short-term supply zone.
Multiple support levels sit below:
4,143–4,131 = important demand / retest zone
4,043 = deeper demand
4,008 = major structural support
You also have an ascending channel, so price is being squeezed between rising support and trendline resistance.
This structure makes a breakout or rejection highly likely in the coming sessions.
🟩 PLAN A – Bullish Breakout & Continuation (Green Path)
Conditions:
Price breaks and closes above the descending trendline.
Bullish candles show momentum continuation.
Expected Movement:
Break above ~4,190–4,200
Retest of the broken trendline
Rally toward the next resistances:
4,209
4,231
4,268 (major target)
Why this plan makes sense:
Structure shows rising lows → bullish pressure increasing.
Breakout above compression often leads to strong follow-through.
Momentum already looks positive given the strong recent push.
Bullish invalidation:
If price falls back below 4,143, Plan A weakens considerably.
🟥 PLAN B – Short-Term Pullback, Then Uptrend Resumes (Pink Path)
Conditions:
Price initially rejects the descending trendline.
Pulls back into the nearby demand zone.
Expected Movement:
Reject around 4,187–4,200
Retrace into 4,143–4,130 demand
Buyers step in
Uptrend resumes, heading again for 4,200 and possibly the 4,231 area
Why this plan makes sense:
Markets often retest key levels before breaking out.
The 4,143–4,130 zone is strong structure + previous liquidity.
When Plan B fails:
A break below 4,130 leads into Plan C.
🟨 PLAN C – Bearish Breakdown Toward Major Support (Orange Path)
Conditions:
Price fails to hold the 4,143–4,130 demand zone.
Bearish momentum increases.
Expected Movement:
Breakdown under 4,130
Acceleration toward deeper liquidity pockets:
4,043
4,008 (major structural support)
Possible bullish reaction at or below these zones
Why this plan makes sense:
Breaking a key demand zone usually triggers a liquidity sweep.
Large downside wicks previously exist near 4,008, showing interest there.
Bearish invalidation:
A reclaim of 4,143 shifts back to neutral/bullish structure.

GOLD ANALYSIS 11/27/2025🟦 1. Fundamental Analysis:
a) Economy:
• USD:
The USD continues to weaken due to expectations that the FED will cut interest rates in 2026. Falling bond yields reduce the opportunity cost of holding gold → positive for GOLD.
• US Stock Market:
The U.S. market remains in the green thanks to expectations of monetary easing and the new administration’s stimulus package. Risk-on sentiment increases but does not pressure gold because the USD is still weak.
• FED:
The FED maintains a dovish tone, implying that inflation is moving in the right direction and they are ready to ease → supports gold’s bullish trend.
• TRUMP:
Plans for tax cuts and increased public spending → risk of a larger budget deficit → markets increase demand for hedging → gold becomes favored.
• Gold ETF – SPDR:
SPDR resumed strong net buying (4.57 tons yesterday), confirming large inflows returning to gold. This reinforces the current bullish trend.
b) Geopolitics:
Tensions in the Middle East remain unresolved, and Ukraine continues to escalate locally.
→ Safe-haven demand stays elevated, supporting gold.
c) Market Sentiment:
Current sentiment: risk-mixed
• Rising stocks → risk-on
• Falling USD + SPDR net buying → risk-off leaning toward gold
→ Overall: gold still holds a bullish advantage. However, the Thanksgiving holiday is reducing trading activity this week.
🟩 2. Technical Analysis:
Trend:
Gold is in a short-term uptrend after breaking the downtrend line, retesting successfully, and continuing upward.
Price Structure:
• Price consolidates around 4.36–4.173
• MA20–MA50 sloping upward
• RSI remains above 50 → buyers dominant
• Technical targets: 4.193 → 4.244
Key Levels:
• Resistance: 4.173 – 4.193 – 4.244
• Support: 4.136 – 4.096 – 4.062
🟧 3. Yesterday’s Market (26/11/25):
GOLD:
• Tapped support at 4.136 and bounced strongly to 4.173
• No bearish reversal candlestick
• Uptrend remains solid with stable volume
USD:
USD weakness is clear → supports GOLD’s bullish continuation.
SPDR:
SPDR continues net buying, confirming strong demand.
🟥 4. Trading Strategy Today (27/11/25):
🪙 SELL XAUUSD | 4195 – 4193
SL: 4199
TP1: 4187
TP2: 4181
🪙 BUY XAUUSD | 4109 – 4111
SL: 4105
TP1: 4117
TP2: 4123

Gold price analysis November 28XAUUSD – Uptrend Continues
Buyers continue to dominate following positive signals in the previous session, reinforcing the strong uptrend that is forming. The price structure remains above important support zones and especially the newly established short-term trendline – a factor that shows that demand is still very sustainable.
The immediate price target is towards the 4250 area, and if the market continues to maintain momentum, the possibility of extending the uptrend to the ATH area around 4375 is entirely possible.
Priority trading strategy continues to BUY following the trend:
📌 Trading plan
Direct BUY around: 4173
Maintain existing BUY orders according to the old strategy
Watch for BUY at support if there is a strong price reaction in the 4112 - 4090 area
Short-term target: 4250
Extended target: 4375 (ATH)
⚠️ Risk management
The uptrend will face obstacles if the price closes below the important support zone of 4090, then it is necessary to consider preserving profits and re-evaluating the trend.

Fundamental Market Analysis for November 28, 2025 EURUSDThe euro is fluctuating near 1.16 after a series of mixed signals: in the euro area, focus is on flash inflation readings in Germany and a broader data block, while the ECB maintains a cautious tone ahead of the December meeting. Comments from Governing Council members indicate it is premature to discuss further easing while core price pressure remains above target, and short-term liquidity is reflected in €STR without signs of a sharp loosening in conditions. Against a modest uptick in U.S. Treasury yields, interest in the dollar is supported, which caps the euro’s upside.
In the U.S., after the short holiday week, the policy path is being reassessed: markets are reluctant to bring forward expectations of rapid Fed easing as some recent macro indicators point to resilient consumption and labor demand. That keeps the dollar from weakening further and pushes participants to cautiously take profits on long-euro positions. An additional factor is cross-asset rotation into dollar assets amid ongoing fiscal risks in several EU countries.
The current setup favors a tactical pullback in EURUSD: neutral ECB communication alongside steady U.S. data supports the dollar around 1.16. Against this backdrop, we prefer selling from 1.15950 with a stop at 1.16250 and a target at 1.14950—the idea rests on the balance of fundamental drivers and the likelihood of flows into defensive assets if sentiment deteriorates.
Trade idea: SELL 1.15950, SL 1.16250, TP 1.14950

Gold price analysis November 27XAUUSD – Sellers appear but the uptrend is still intact
Gold is under profit-taking pressure around the 4172 area, causing the increase to temporarily slow down. However, the bullish structure has not been broken yet as the support Trendline below is still respected by the market. In the context of today being Thanksgiving Day in the US, liquidity may decrease and strong fluctuations are unlikely to appear.
The strategy still prioritizes BUY following the main trend, but needs to be patient and wait for the right safe entry point.
📌 Reference trading plan
BUY around: 4153
BUY when there is a price rejection signal at the support zone 4112 – 4090
BUY DCA when there is a clear break of the resistance 4172
🎯 Target: 4250
⚠️ Risk note: The uptrend will be invalidated if the price closes below the Trendline 4090 – then the strategy needs to be reviewed.

GOLD broke out of the H4 trendline — real breakout or trap? Hello Traders! 👋
Gold has broken out of the H4 descending trendline, boosted by geopolitical tension and a weaker USD.
But the real question is: Is this a true breakout or just FOMO before a drop?
Here are the key zones I’ll be watching today:
BUY Zones (SL 10 – TP 10)
• 4165 – 4155
• 4170 – 4175
• 4140 – 4145
• 411x
• 4099
SELL Reaction Zones (SL 10 – TP 10)
• 4200 – 4203
• 4212 – 4215
• 4230
• 4245 – 4247
👉 If price breaks below 4133, the trendline fails → potential sell-continuation setup.
📌 Bias: BUY is the main play — SELL only for short reaction scalps.
💬 What do YOU think — real breakout or classic bull trap? Drop your thoughts below!
❤️ Let’s discuss & grow together!

XAUUSD – SHORT-TERM TREND UNCLEAR, WAIT FOR PRICE TO REACH ...XAUUSD – SHORT-TERM TREND UNCLEAR, WAIT FOR PRICE TO REACH LIQUIDITY ZONE
1. Fundamental Analysis
In today's session, gold is maintaining a slight correction after hitting the highest price level in nearly two weeks. Market risk sentiment is somewhat more positive, with funds temporarily moving away from safe-haven assets, weakening demand for gold and prompting short-term profit-taking.
However, dovish expectations from the Fed continue to keep the USD weak, which is a foundational factor that could support gold in the medium term. Lana views the current phase primarily as a technical correction, prioritizing waiting for the price to reach important liquidity zones before taking action.
2. Technical Analysis
The H1 chart shows that after a strong upward move, the price is pausing and a confirmation down move is appearing from the resistance zone above. An upward trendline still supports the structure, indicating the larger trend has not been broken, but the upward momentum is slowing and the market is shifting to a state of hesitation. Below, the FVG demand zones around 4113–4111 and deeper at 4085–4088 act as liquidity zones where Lana expects buyers might return. Above, the 4194–4196 zone is a significant resistance, coinciding with the supply and liquidity zone above, suitable for a corrective Sell scenario if the price retests.
3. Price Zones to Watch
Upper Liquidity / Strong Resistance Zone:
4194 – 4196
Lower Liquidity / Support & FVG Zone:
4113 – 4111: first demand zone, near the upward trendline.
4085 – 4088: lower FVG zone, stronger support if a deeper correction occurs.
4. Trading Scenarios
Sell 4194 – 4196
SL: 4200
TP: 4175 – 4160 – 4122 – 4105
Buy 4113 – 4111
SL: 4105
TP: 4133 – 4155 – 4170 – 4190
Buy 4085 – 4088
SL: 4080
TP: 4095 – 4110 – 4133 – 4150 – 4185
👉 Follow Lana on TradingView to read the earliest gold analyses. 💛

Title: FARTCOIN | Breakout Retest and Long-Term Structure PlayAfter a long period of compression, FARTCOIN (FART/USDT) is showing early signs of a potential trend reversal on the 1D chart.
Price has respected a descending resistance line for months while simultaneously forming higher lows on the ascending yellow trendline — signaling that bullish pressure may be building.
Currently, price is testing the intersection point between descending resistance and ascending support, forming what could be a symmetrical triangle breakout setup.
If we can hold above the breakout area and reclaim the mid-structure level (~0.40–0.42), the next technical objectives would be:
TP1: 0.56 – Retest of prior structural resistance
TP2: 0.73 – Measured move from the breakout pattern
TP3: 1.00+ – Potential full cycle expansion target
⚠️ Invalidation:
A daily candle close below 0.30 would suggest a failed breakout and continuation of the prior downtrend.
Educational Breakdown:
This setup is designed to teach how trendline confluence + structural compression can reveal early trend reversal zones.
Notice how the breakout leg aligns with a swing projection pattern, confirming momentum shift probability.
Bias:
Directional Bias: Bullish
Setup Type: Breakout + Retest (Mid-term swing)
Timeframe: 1D

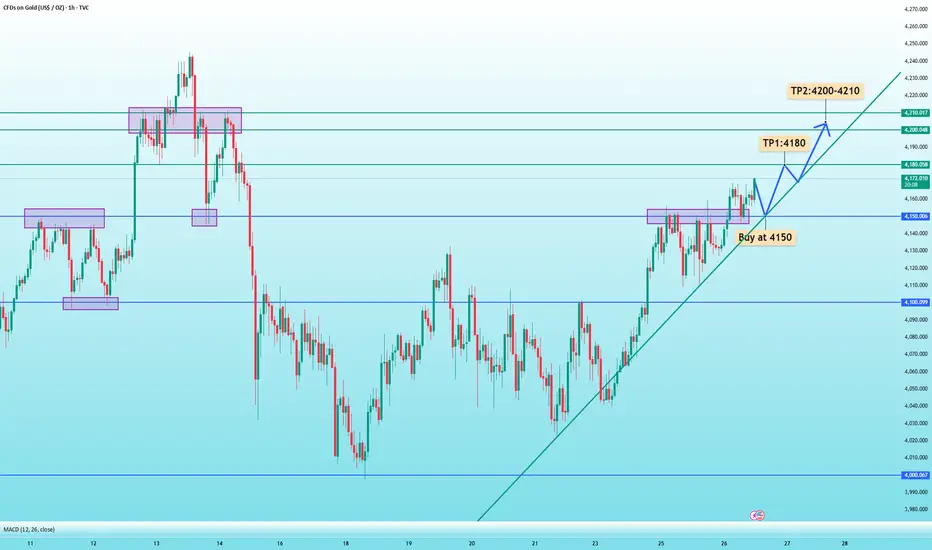
XAUUSD: 4150 is key; buy if it pulls back but doesn't break thisShifts in Global Geopolitical Dynamics:
The global landscape is undergoing noticeable changes, with recent developments showing a clear de-escalation in the Russia–Ukraine situation. This easing of geopolitical tension has placed upward pressure on gold under some constraint, meaning bullish sentiment should not be taken for granted. Entering long positions on pullbacks to support levels would be a more prudent approach.
Today, gold successfully held above $4,150, turning this former resistance into new support. As such, the $4,150 level becomes the key trading pivot for the day.
From the 1-hour chart, as long as prices hold above $4,150, there remains potential for gold to retest $4,180, and possibly challenge the previous highs around $4,200–$4,210.
Trading Strategy:
Buy at $4,150
Target 1: $4,180
Target 2: $4,200–$4,210
Stop-loss: Around $10, adjusted based on individual risk tolerance
Key Data to Watch:
U.S. Initial Jobless Claims (weekly)
U.S. Durable Goods Orders (September, MoM)
XAUUSD Bullish Channel Bounce Setup “Gold (XAUUSD) currently moves inside an ascending channel. Price is holding above the 4,150 support zone. If this support holds, we may see a bullish bounce toward the upper channel levels 4190

TSLA — Bullish Above 317.77, Targeting 544.53TSLA maintains a bullish structure as long as price holds above the key zone at 317.77.
This level represents the foundation of the current upward leg and serves as the invalidation point for the broader trend. As long as buyers protect 317.77, upside continuation remains the dominant scenario.
Price is currently reclaiming the 0.5 Fibonacci level at 424.43. A sustained close above this area strengthens bullish momentum toward 452.77 (0.618), followed by 472.47–484.48 (0.7–0.75). A breakout above these mid-range levels would open the path toward the major extension target at 544.53.
In a bearish scenario, price cannot break above the key support zone; any rally into it while trading below would be considered only a corrective bounce.
But as long as 317.77 holds, the primary outlook remains bullish.

Gold market sustaining its bullish trajectoryGold market remains highly impulsive around the 4170s, sustaining its bullish trajectory as price action sets its sights on the 4240 level, with extended projections reaching toward the 4380s. follow for more insights , comment for more opinions , and boost idea

Bitcoin Analysis October 2025Bitcoin faced correction after last flash crash where bitcoin had 10% pullback, and it now has nice rally to the upside. Fixed volume range showed accumulation of buying orders. I expect price to push to the previous high on the left.

Bitcoin prediction Nov 2025Bitcoin prediction Nov 2025, Bitcoin is expected to push to the upside after it broke previous high and came to test previous low and bullish order block and start to move toward previous high (Bullish Extension). This move may break previous all-time high and break record of 2025 All-time high.
