ETH 1H Analysis - Key Triggers Ahead | Day 26❄️ Welcome to the cryptos winter , I hope you’ve started your day well.
⏰ We’re analyzing ETH on the 1-Hour timeframe.
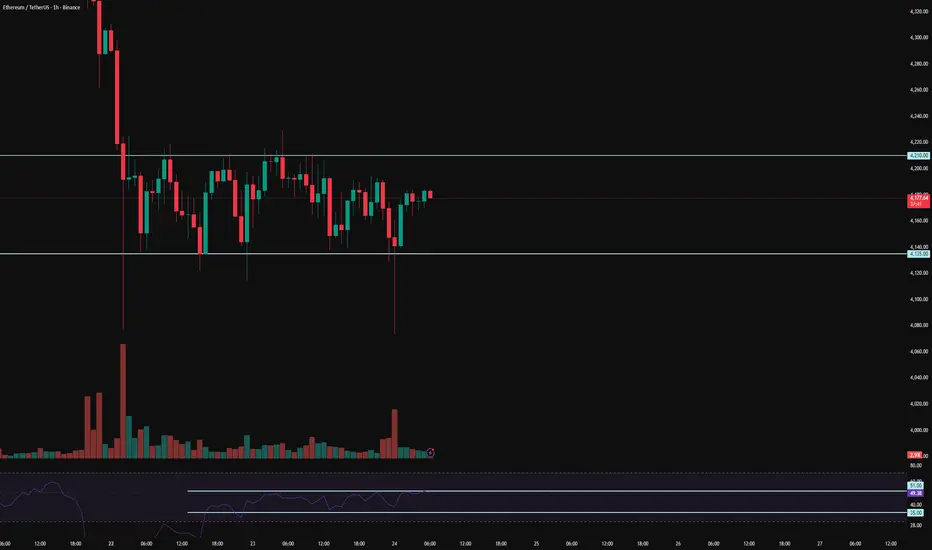
👀 On the 1-hour timeframe, Ethereum is currently ranging after its recent drop, sitting in a decision-making zone. It already faked the range low once and bounced back up, creating a clean trading structure. If ETH breaks above the $4,210 resistance, it could complete its correction and push higher. On the other hand, if ETH continues its deeper correction, a break and confirmation below the $4,135 support would open the way to lower levels.
🧮 Looking at the RSI oscillator, it’s now hovering around the 50 zone. A cross above 51 could trigger a bullish breakout, while a cross below 35 would suggest Ethereum is heading for a deeper correction.
🕯 Candle size and volume have shrunk inside this range, showing clear consolidation. Buyers and sellers are in a tug-of-war, and we’d prefer not to trade in these tight squeezes with heavy volume until a clear winner emerges. A breakout of the range will likely need strong “whale candles” to confirm direction.
💸 The ETH/BTC pair also shows a similar structure — after its recent drop, it has entered a tight consolidation pattern that mirrors the price action seen against USDT.
🧠 For trading ETH, patience is key. Wait to see which side Ethereum chooses to break out from. Once the range high or low (outlined above) is taken out with confirmation, we can look for a position in that direction.
❤️ Disclaimer : This analysis is purely based on my personal opinion and I only trade if the stated triggers are activated .
Fundsrate
BTC 4H Analysis - Key Triggers Ahead | Day 43😃 Hey , how's it going ? Come over here — Winter got something for you!
⏰ We’re analyzing BTC on the 4-Hour timeframe.
👀 On the 4H timeframe of Bitcoin, we see that after the recent interest rate cut news, price started moving down. It seems that the potential upside from the news was already priced in by traders. Right now, BTC is trading in a range between resistance at $117,573 and support at $114,828. A breakout of either side could send the price toward the next support or resistance. For now, the market will likely move into a range condition, where the win rate of most setups drops, so it’s better to trade with lower risk.
🧮 Looking at the RSI oscillator, it is near a support zone below the 50 level. The two key levels to watch are 40 and 70. If RSI breaks above or below these zones, Bitcoin could start a new move.
🕯 Currently, the size, volume, and number of red candles are increasing. As BTC approaches support, some buy orders have been triggered. The key question is whether this support zone is strong enough to hold the price until the new week begins. Since the ATH, every correction has faced strong selling pressure from major sellers (maker sellers).
🧠 At this stage, Bitcoin itself may not provide the best setups for positions. However, altcoins that are showing bullish divergence or relative strength against BTC could present better opportunities. We can track these coins on platforms like TradingView or CoinMarketCap, identify their triggers, and look for long entries if the setups are valid.
❤️ Disclaimer : This analysis is purely based on my personal opinion and I only trade if the stated triggers are activated .

Others.d 4H Analysis - key Triggers Ahead👋🏻 Hey everyone! How’s it going? Hope you’re all doing well.
❄️ Welcome to Crypto Winter.
⏰ Today, we’ll be analyzing Others.d and exploring its potential opportunities.
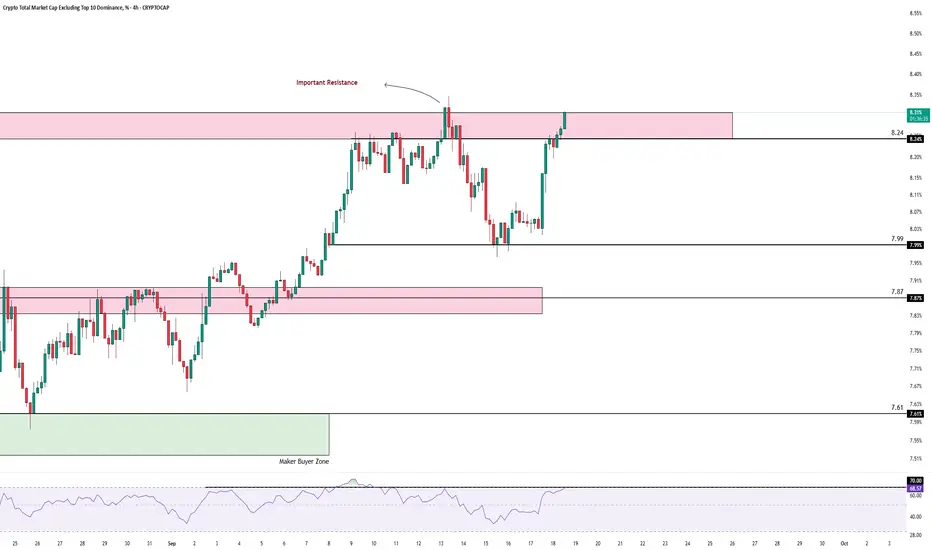
👀 On the 4H timeframe, looking at the Others.D index, we can see that this index moves inversely to Bitcoin dominance (BTC.D) and Tether dominance (USDT.D). It reflects the capital flow into altcoins (excluding BTC and ETH). Currently, it has been consolidating inside a tight box structure. After breaking above the seller’s trigger zone — the top of the box — at 7.87%, it moved upward but got rejected at the 8.3% resistance.
💡 After the rejection, it formed a higher low compared to the previous one, showing respect from buyers. Momentum then picked up quickly, pushing the price back toward the 8.3% resistance with fewer green candles but stronger momentum. We are now retesting this resistance, and a confirmed breakout here could serve as a first small confirmation for a potential altcoin bull run.
🧮 Looking at the RSI oscillator, one critical level stands out: the 70 overbought zone. Considering the recent positive economic data, which fueled capital inflows into equities, this level gains even more weight. It may provide further support for Others.D cap to push higher.
🕯 After breaking out of the box, candle size and volume looked normal, but at the formation of the higher low, buyers strongly respected that level — suddenly the candle size increased sharply, showing FOMO from buyers and fresh capital entering risk assets.
🧠 We now have multiple confirmations for a possible breakout and stabilization above this resistance. If it happens, several altcoins with strong setups should be on the watchlist for entries. A clean breakout could also provide the green light to open long-term futures positions on altcoins, as a stronger rally may follow.
❤️ Disclaimer : This analysis is purely based on my personal opinion and I only trade if the stated triggers are activated .
ETHFI 1H Analysis - Key Triggers Ahead👋🏻 Hey everyone! How’s it going? Hope you’re all doing well.
❄️ Welcome to Crypto Winter.
⏰ Today, we’ll be analyzing ETHFI and exploring its potential opportunities.
👀 On the 1-hour timeframe of the ETHFI coin, we can see that after an upward move and completing a very strong bullish leg, this coin has entered an accumulation phase, and with a breakout and confirmation above the top of this accumulation zone, it can resume its bullish move and continue higher. This coin is one of the strong DeFi coins that is responsible for restaking.
The identified triggers for this coin are the breakout of the taker seller zone and the price level of 1.533, which almost overlap. This means that this zone has both maker seller and taker seller, and with good buying volume, we can pass through this area.
🧮 Looking at the RSI oscillator, we see one important level at 70. Once momentum crosses this zone, the ETHFI could make a strong move with momentum, potentially entering either the overbought area.
🕯 The volume size and number of green candles at the end of this compression have increased, and even several times it has given indecision candles, and then moved to the bottom of this compression. Usually, to break the taker seller zone, we need a whale candle that in the pullback or stop hunt gives us an indecision candle.
💸 On the 1-hour timeframe of the ETHFIBTC pair, this trading symbol is currently in accumulation and moving upward. If this move is maintained and the interest rate news also comes with a multi-level decrease, this trading symbol can eliminate its taker seller zone in the pairs it has, fill the sell orders, and continue moving upward.
🧠 For entering this coin and taking a long trade, we must wait for the taker seller zone to break, and then enter the trade with an indecision candle. We can also set a stop loss, but it is not very safe because if unexpected news comes, the market can have high volatility. Risk management & capital management must not be forgotten, since the news will be released in 30 minutes.
❤️ Disclaimer : This analysis is purely based on my personal opinion and I only trade if the stated triggers are activated .

ETH 1H Analysis - Key Triggers Ahead | Day 20👋🏻 Hey everyone! How’s it going? Hope you’re all doing well.
❄️ Welcome to Crypto Winter.
⏰ Today, we’ll be analyzing ETHUSDT and exploring its potential opportunities.
👀 On the 1-hour timeframe for Ethereum, we observe that after exiting its box, Ethereum entered a downtrend, marked by a trendline. As much as attention was given to it, suddenly it was ignored, and buyers could not keep the price high enough. Ethereum’s triggers are completely defined — with a breakout and confirmation of these zones, Ethereum can create trading opportunities for us.
🧮 The key RSI oscillator levels are 59 and 30. If momentum passes these levels, Ethereum could start its move, although it may be ignored at times. After rejection from the $4,757 zone, red candles were significantly larger than green candles. Today, Ethereum’s volume is increasing, and we need to see what will happen with the news for Ethereum.
💸 The ETH/BTC pair, or Ethereum versus Bitcoin, is currently in a compression resembling multi-timeframe accumulation. Exiting this compression can clearly determine Ethereum’s direction. The upper and lower bounds of this compression can be considered alert zones, where you can observe price behavior when it reaches these levels.
🔴 Today’s news could have a significant effect on Ethereum. Especially if a stepwise interest rate cut occurs, Ethereum could reach targets above $6,000 and create a larger DeFi space, particularly in terms of contract and collateral infrastructure.
🧠 To enter Ethereum positions, we need to wait for a bullish move in ETH/BTC, confirmation in ETH/USDT, and a breakout of key resistances. After these breakouts occur, we can enter at each level and stay in the trades as long as the market allows.
❤️ Disclaimer : This analysis is purely based on my personal opinion and I only trade if the stated triggers are activated .

BTC 1H Analysis - Key Triggers Ahead | Day 39👋🏻 Hey everyone! How’s it going? Hope you’re all doing well.
❄️ Welcome to Crypto Winter.
⏰ Today, we’ll be analyzing BTCUSDT and exploring its potential opportunities.
👀 On the 1-hour timeframe for Bitcoin, we observe that after breaking the $116,000 zone, the price moved upward and buyers drove it to the $117,000 level. Then, sellers pushed the price back down to roughly the same level as yesterday. Currently, Bitcoin has two important triggers: one at $116,860 and another at $114,660. With a breakout of these levels, we can take positions more confidently. I don’t have a specific short scenario in mind because long positions, if taken, could continue with the news of interest rate cuts, and we could even add several funding levels to our positions.
🧮 On the RSI, the two critical zones are 70 and 38. If momentum breaks either, Bitcoin could move with much more strength.
🕯 The size and volume of green candles have increased significantly after micro-buyers entered. However, due to the interest rate cut news and upcoming scenarios, this kind of movement and these candles may not continue. One notable point on the chart is that the buying pressure has caused the size, volume, and number of green candles to be smaller, yet they produce larger moves. Our momentum for further upward movement is stronger and more powerful.
🔴 Today’s news could affect Bitcoin’s future price, so try to take a position aligned with the news. Although it seems risky, Bitcoin’s volatility relative to other coins is lower on news days, meaning less risk for traders.
🧠 There are two scenarios for entering a Bitcoin position:
1️⃣ Place a stop-buy at $116,850 to enter when the stop triggers. The stop size would be 2–3%, which is relatively large, delaying risk-to-reward, and there is a chance the scenario fails and the stop is hit.
2️⃣ Wait for a 15-minute candle setup (Indecision + SMA + Low Volume) to enter, allowing a smaller stop at roughly the same level. This still carries the risk of being stopped out quickly.
Risk management is essential — if we follow it today, nothing adverse should happen.
❤️ Disclaimer : This analysis is purely based on my personal opinion and I only trade if the stated triggers are activated .

USDT.D Analysis 1H - Key Triggers Ahead👋🏻 Hey everyone! How’s it going? Hope you’re all doing well.
❄️ Welcome to Crypto Winter.
⏰ Today, we’ll be analyzing Coin X and exploring its potential opportunities.
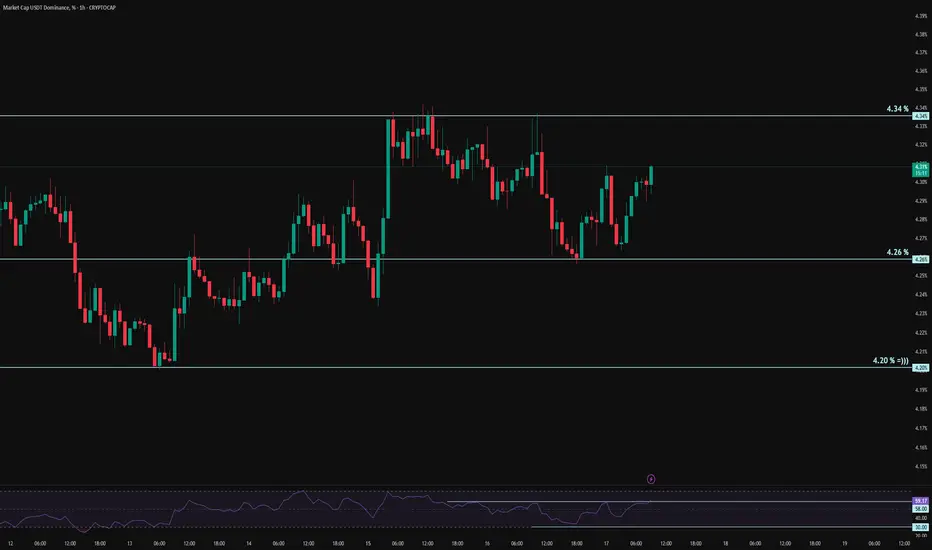
👀 On the 1H Tether dominance chart we can see that after reacting to the 4.20% zone, dominance bounced upward and built a solid base that confirms bullish momentum for the market. Right now, it’s trapped between two key levels: resistance at 4.34% and support at 4.26%. A clean break of either side should give us the market direction. Keep in mind that today’s news brings multiple scenarios into play.
🧮 On RSI, the two critical zones are 58 and 30. If momentum breaks through either, Tether dominance could move with much more strength.
🕯 After the 4.20% bounce, the green candles have grown larger, but now the uptrend shows signs of weakness. Candles forming near these support and resistance zones will be crucial in reading the next move — for example, a red indecision candle on AVAX might line up with a small bullish indecision elsewhere, and the hidden meaning behind that is what matters.
🔴 As for today’s fundamentals, the outlook is mixed. Bullish scenarios depend on a step-by-step rate cut, and if cuts continue, more Tether will flow out into the market.
🧠 For futures trading, Tether dominance is very useful. If dominance breaks down through 4.26% or 4.20%, we can use a candle setup or stop-buy to enter. My personal take: if you didn’t open a position yesterday, you can still take a very low-risk entry here on an altcoin from your watchlist. Keep risk around 0.25% — that would be ideal.
❤️ Disclaimer : This analysis is purely based on my personal opinion and I only trade if the stated triggers are activated .
DXY Bulls Ready — Can Powell Spark the Rally?📊 DXY Pre-FOMC Outlook
In my previous analysis released on Monday, I expected the Dollar Index to fill the gap around the 98.60 zone and range below the key red line at 99.429.
Now, with less than 8 hours left until the highly anticipated FOMC rate decision, it’s time to take a closer look at tonight’s event and what it could mean for the markets.
From a purely technical perspective — setting the news aside — the Dollar Index looks ready to break through the crucial 100 level and kick off a strong bullish rally.
However, recent political pressure from Trump urging rate cuts, along with visible tension between him and Fed Chair Jerome Powell, has created uncertainty. If it weren’t for these conflicting signals, I would’ve confidently expected a clean breakout above 100.
As much as I enjoy trading news-driven events, I’ll likely stay out of the market tonight and observe from the sidelines. The setup is tempting, but the dual narratives make it risky.
That said — if you ask for my final take — I believe the stage is fully set for a bullish dollar and a corresponding drop in gold, EUR, GBP, and other major assets.
Let’s see how it plays out. 👀💥

Gold’s Biggest Day of 2025: Collapse or New High Incoming?🟡 Gold Pre-FOMC Update | Patience Paid Off
In my previous analysis released on Monday, we highlighted the significance of the 3310 key red level on gold. I mentioned that if we got a daily candle close below this zone, it could trigger further downside.
That scenario didn’t play out — price closed above 3310, and that’s exactly why we stayed out of any short positions. No guessing, no forcing. Just patience.
On the flip side, I also said we need a daily close above 3350 to even consider going long. And as you can see, for the past two days, price has been ranging tightly between 3310 and 3330 — with relatively low trading volume across the board.
After 9 years of optimizing this strategy, one core principle remains unchanged:
🛡️ Capital protection and maximum risk control always come first.
And I can confidently say — those filters are working beautifully. I hope you’re benefiting from this approach too.
Now technically speaking, everything is lining up for a bullish DXY and bearish gold —
But tonight’s FOMC meeting and Powell vs. Trump drama will be the final trigger.
Let’s watch closely. Smart trading is patient trading. 🧠⚖️
🔁 This analysis will be updated whenever necessary.
Disclaimer:This is not financial advice. Just my personal opinion.

Recession indicator #2 Just realized that measuring the spread between TVC:US02Y and FRED:FEDFUNDS gives you a pretty accurate heads up of looming recessions. We might be in one from a few months now.

Study of DXY, Gold, and Fed Fund Rates using 200MA indicatorBlack line: DXY (U.S. dollar index)
Green line: DXY 200 week moving average
Yellow line: GC (Gold futures)
Blue line: DFF (U.S. Federal Funds Effective Rate)
Since 1971 when U.S. dollar went off the gold standard, there have been 6 instances when the DXY crossed below its 200 week moving average while it was rising. At closing on 27 September 2024 was the 7th instance of this DXY crossing.
Of interest:
Performance of gold when DXY crosses below, until DXY reaches a local minimum. Results are highlighted in purple boxes.
Of the 7 instances, interest rates were rising in 4, flat in 1, falling in 1, and presumed to be falling in the current scenario. The only rising rate period was 1985-92, when gold had a very marginal 4% gain. This was notably on the backside of the 1970's high inflation period. Technically, gold showed gains in all but 1 of these historical periods, with 1994-95 showing a 2% loss.
Conclusions:
1) DXY trend reversal downward is not always, or often, associated with a U.S. interest rate cutting cycle nor is it strongly correlated with gold price gains.
2) The start of a U.S. interest rate cutting cycle is not predictive of gold price gains.

VIX - is the sell 20, buy 30 strategy done?Throughout 2022 you would have done VERY well taking profit when the TVC:VIX hit 20 and accumulating when the VIX hit 30. But has this trend concluded? This movement and profit/accumulation opportunity is consistent with the most recent tightening from 2017 to 2018 where fed funds were rising, and the yield for 2 year treasuries in the bond market exceeded fed funds. When the yield for 2 year treasuries fell below fed funds the VIX remained below 20 until covid hit. The VIX spiked during covid and consistently descended while the market expanded. This pattern is only observed in the most recent cycle and not something that we see consistently repeated historically. If the 2 year remains below fed funds, should not expect the VIX to range between 20 to 30 or will 20 to become the ceiling?

BTCUSDIn the daily time frame, with increasing expectations of a 0.25% increase in interest rates or even keeping it constant due to the financial crisis of banks in America, Bitcoin will cross the heavy resistance of 25,000 and at the level of 28,500 in lower times, we can see the weakness of the trend, which can indicate The market rest for the next move according to today's economic data and Powell's speech.
If the level of 25000 is rejected, it can be the key support for the correction to continue the upward trend, but with the positive impact of the result of tonight's session, the levels of 32000 and 38000 are the next targets of this accelerated movement, which seems to be different from the very bullish expectations. In the market, it is necessary to continue the upward movement of a correction, which Mr. Pavel can have a surprise for the market. (You have to see if he has the phone in his hand or not 😉)

Fed decisions boost the USD trendThe Fed raised its funds rate by 75 basis point to a target range of 3.00% - 3.25%, its highest since 2008.
DXY remains bullish, even technically, supported by a rising trendline, 20 and 50 SMA on D1.
Even if the RSI starts showing overbought signal with bearish divergence, and Bollinger bands upper limit reached, it isn't in this case a sell signal: strong momentum brings traders into this trap.
Wait for RSI to cross below the 14 SMA as described on the chart to start looking for a correction.
Measuring the corrections shows us strength recently in the momentum ( smaller corrective waves ).
Measuring the impulsive wave shows us that the uptrend hasn't reached yet it's logical goal.
With the good news on the USD, the index can reach the 114 level.
Goodluck,
Joe.

BTCUSDTAccording to the previous analysis, Bitcoin is pulling back to the midline of the ascending channel in the range of 21500 to 21700 after breaking its main support areas, and on the other hand, it is facing the middle resistances of the fork and the 1-hour trend line, and since it has been able to more than from 50% of the previous rising wave, it is more likely to continue the downward trend to the bottom of the channel around the psychological range of 20000, which is symmetrical with the main middle line of the fork, but considering the return from the 0.618 Fibonacci level, if it crosses the 21700 resistance range Its main level is 23,000, and upon its failure, the confirmation of the start of the upward rally up to the range of 28,400 is issued.
Today, the main economic data is the announcement of the interest rate increase for the fifth time in 2022, which increases or decreases the rate 8 times a year.
According to most experts, this rate increase will be 0.75% and will bring the interest rate to 2.5%, and as it is clear in the interest rate graph, 2.5 is the interest rate ceiling in 2019, but if the Federal Reserve Like the European Union, there is a surprise on the way and it increases the interest rate by 1%, this resistance has been broken and it can grow up to the previous ceiling of 5% that happened in 2006-2007 (that is, technically at this level? 😁)
On the other hand, yesterday's economic data, which was the index of consumer confidence and the sale of newly built houses, was significantly lower than the previous period and the expectations of experts (it should be noted that Mr. Biden, who these days has improved the good behavior of the locksmith 😜), it was announced that this data shows a decrease There is a strong demand in the market, and this can be the factor influencing the further increase of the interest rate by the Federal Reserve, because the main determining factors in the American economy are data, not leadership and oversight, and the Federal Reserve and the government operate independently.
With these words, in general, it is more likely that the market will continue to fall, although we are in the most difficult market conditions and new data can affect the market conditions at any moment.
