Crude oil future Decline toward 59$hello,
According to my technical analysis, there is a high probability of a decline toward $59 in the next few hours for two main reasons:
-A breakout below the support level.
-A pullback retesting that broken support.
Futures

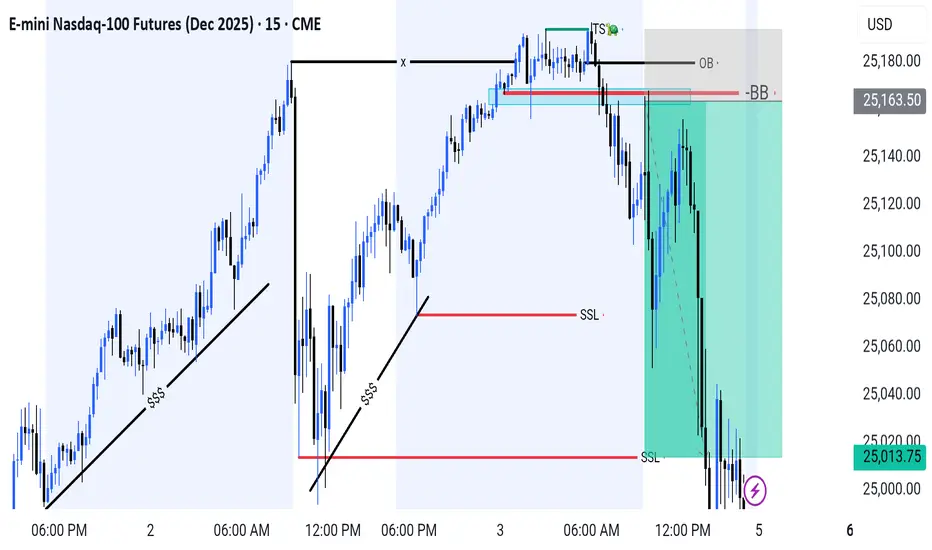
Nasdaq-100 | Textbook OB Rejection SSL Target Hit.Price swept the internal liquidity (TS 🐢) and tapped into a premium Order Block (OB), showing clear signs of rejection. This confirms a potential shift in market structure with bearish momentum building up. Alhumdulillah Target Hit✅️
🔹 Key Points:
Buy-side liquidity (BSL) taken before OB mitigation
Strong rejection from OB + Breaker Block (BB) zone
Market structure shift confirmed on 15m
Targeting sell-side liquidity (SSL) below recent swing lows
As long as price remains below the OB, bearish continuation is expected. Watch for short setups aligned with internal structure breaks.
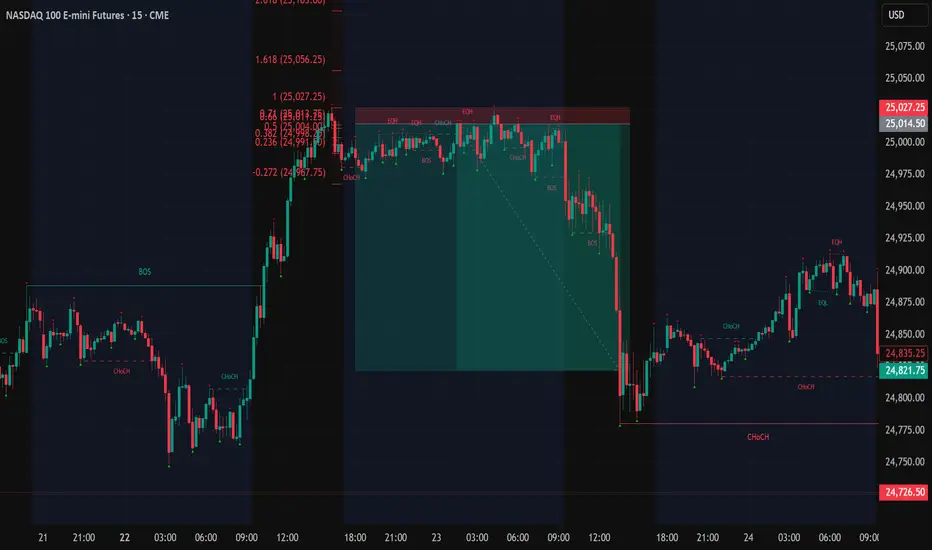
ES continuing with my short stratStructure is key when identifying direction. Overall trend isnt as important as you think. When trading reversals I look for large moves in one direction that allows for large moves back, I capitalize off of finding the structure shift and I enter only on discount. Watch your win rate increase when entering deeper into discount.
Trade for Christ

BUY NASDAQOn the Nasdaq Futures, we went long on the market since it grabbed the minor sellside liquidity and gave us a FVG to ride, our target is the buyside liquidity.
Follow for more!

Futures vs Spot: What Traders Need to Know1. Introduction
In crypto, two of the most common ways to trade are spot markets and futures markets.
Both can be profitable, but they operate differently and knowing the differences is critical for survival.
Spot trading is straightforward: you buy the asset, you own it.
Futures trading is more complex: you speculate on the asset’s price without actually owning it.
This guide explains the differences, benefits, and risks of each so you can decide which suits your style.
2. What Is Spot Trading?
Spot trading is simple. You buy the asset, you own it.
There is no leverage. You pay the full price.
Profit and loss move one-to-one with the asset’s price.
Pros
Simple to understand.
No liquidation risk.
Can benefit from staking or long-term custody.
Cons
Limited upside with small capital.
Cannot profit when the market falls.
3. What Is Futures Trading?
Futures are contracts. You do not own the asset, only exposure to its price.
They allow leverage, often up to 10x or more.
You can go long to profit from rising markets or short to profit from falling ones.
Contracts can have expiry dates or be perpetual.
Pros
Flexibility to trade both directions.
Efficient capital use with leverage.
Useful for hedging spot positions.
Cons
Liquidation risk.
Complex funding fees on perpetuals.
Temptation to overtrade.
4. Key Differences: Spot vs Futures
Spot = You own the asset.
Futures = You own a contract.
Spot = No leverage.
Futures = High leverage possible.
Spot = Profits only when price rises.
Futures = Profits when price rises or falls.
Spot = Best for beginners and investors.
Futures = Best for experienced traders and hedgers.
Spot = simplicity. Futures = flexibility, but higher risk.
5. Why Futures Can Be Risky
Leverage is attractive, but it cuts both ways:
A 10 percent drop with 10x leverage equals a 100 percent account loss.
Liquidations close positions automatically if collateral is too low.
6. When to Use Spot vs Futures
Use spot if you want to own crypto long-term.
Use spot if you prefer simplicity and no liquidation stress.
Use futures if you want to hedge your holdings.
Use futures if you need market exposure with limited capital.
Use futures only if you have strict discipline and risk control.
7. Combining Spot and Futures
Many professionals use both:
Hold spot ETH as a long-term investment.
Use futures shorts to hedge during downturns.
This balances long-term conviction with short-term protection.
Think of it like insurance: futures protect spot positions when markets get volatile.
8. Risk Management Is the Deciding Factor
Whether you trade spot or futures, risk management decides survival:
In spot: limit allocation per asset.
In futures: control leverage, set stop losses, and manage liquidation risk.
In both: size positions by account % risk.
Without a risk plan, futures become gambling and even spot can lead to poor results.
Sugar SB Futures: Extreme COT Divergence – Short Squeeze Ahead?
ICEUS:SB1!
🔎 Market Situation
The latest COT report shows one of the most extreme positioning imbalances in 18 years for Sugar #11:
• Commercials: Net Long 128,130 contracts → 2nd highest since 2007 (only surpassed in Sep/Oct 2020 with ~160k).
• Non-Commercials (Funds): Net Short –125,628 contracts, almost a mirror image.
• COT Index: above 80% since July, peaking at 100% → continuous accumulation by Commercials.
• Open Interest: very high → massive market participation.
• On-Balance Volume (OBV): still negative → typical for final shakeouts before reversals.
📈 Historical Parallels
Looking back at the 5 biggest Commercial Long positions (2011, 2015, 2018, 2020, 2025):
2020: +55% rally within 3–6 months after record Commercial longs.
2015: +30% rally within 90 days.
Other cases: Average performance +10% (T+30), +21% (T+60), +31% (T+90).
👉 Every major COT extreme in Sugar was followed by a double-digit rally.
🟢 Trading Idea (Setup)
Bias: Bullish (expecting potential short squeeze / fund covering).
Entry Trigger: Breakout above key moving averages (e.g. 50-day SMA).
Stop: ATR-based or below recent swing lows.
🎯 Targets
TP1 = partial profit at +1.5R.
TP2 = trend-following → historically, rallies extended 20–30% within 2–3 months.
📅 Seasonality: Q4–Q1 tends to be bullish for Sugar (ethanol demand, Brazil harvest).
⚖️ Risk/Reward
Historical CRV of similar setups: 1:3 to 1:5.
Best rallies occurred when Commercials held positions >100k for several weeks while funds stayed heavily short.
📌 Conclusion
Sugar is showing one of the rarest COT setups of the past two decades.
Commercials are heavily long, funds massively short, and open interest is extreme.
The last time this happened (2020), Sugar rallied more than 50%.
📈 History suggests we could see another powerful move higher.
⚠️ Reminder: Next WASDE report → 09 Oct 2025

#GOLD price record I think #gold pullbacked and continu to ATH and upper resistance zone 3930
- 3950
support area 3871-3855

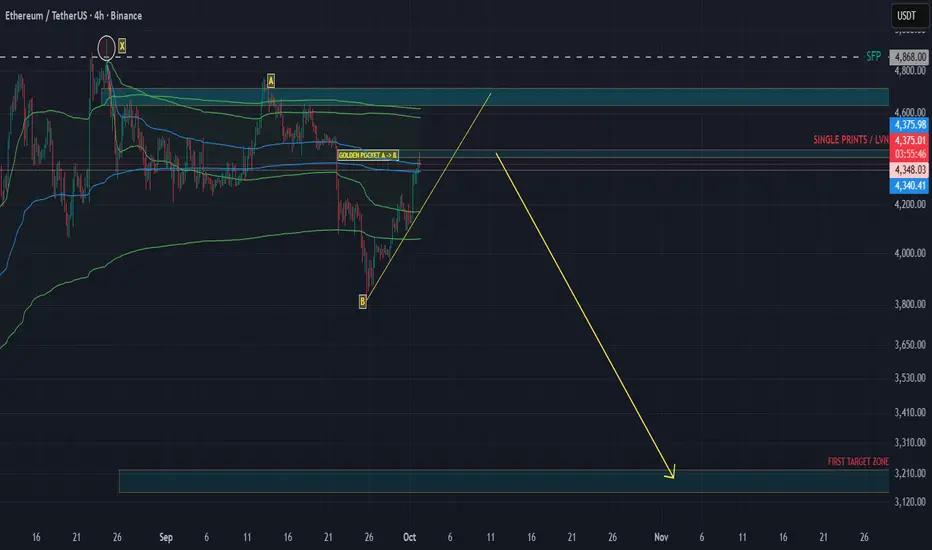
ETHEREUM - THE TRAP IS UNFOLDING – EXPECT A BLOODBATH!As I mentioned in my latest Bitcoin and ChainLink analysis , I believe the crypto market is setting up for a huge long squeeze. Let’s break down why this move looks fragile and why you should be cautious.
What do we need for a healthy rally?
Spot demand – Real buyers (spot market) need to step in and absorb supply. Without this, rallies are built on leverage and tend to collapse quickly.
Controlled leverage – A healthy move isn’t fueled by overleveraged longs. If open interest keeps spiking while spot demand is flat or negative, that’s a recipe for a squeeze.
Auction structure support – Price should build strong bases (value areas, balanced profiles) instead of just ripping up through inefficiencies.
Right now? We don’t have these ingredients.
Step 1: Look at CRYPTOCAP:TOTAL3
For those unfamiliar, CRYPTOCAP:TOTAL3 is the crypto market cap excluding BTC and ETH. It’s a great index to measure the “altcoin market” and often shows where broader crypto is heading.
Now let’s apply some tools:
Anchored VWAP (AVWAP): Tracks the average position of buyers/sellers from a specific swing (like a cost-basis anchor).
Fixed Range Volume Profile (FRVP): Shows where most trading occurred (value area, POC, low/high volume nodes).
What CRYPTOCAP:TOTAL3 shows:
The upper AVWAP band from the swing low (A) is at 1.12T.
The upper AVWAP band from the swing high (B) is also at 1.12T.
Price is retracing into the Value Area High (VAH). This lines up with:
An ascending trendline retest and a Fib retrace (0.75–0.786 zone).
When AVWAP bands from opposite swings collide like this, it’s a double-sided supply zone.
Longs from the low see this area as “expensive” → they reduce risk.
Shorts from the top defend their break-even.
This creates a congestion zone where strong reversals often happen unless fresh spot demand breaks through.
Example: Imagine two teams pushing on opposite sides of a door at the same time. Unless one side gets backup (spot demand), the door doesn’t move — it slams shut.
Step 2: Apply This to CRYPTOCAP:ETH
Now, let’s clear one thing up: CRYPTOCAP:TOTAL3 excludes both Bitcoin and Ethereum. It’s basically the “altcoin index,” showing how the rest of the market behaves without the two giants.
But here’s why it still matters for ETH:
ETH often moves in strong correlation with altcoins, especially during risk-on or risk-off events.
When CRYPTOCAP:TOTAL3 is at a critical resistance or AVWAP collision zone, it usually signals that risk appetite across alts is stretched.
And since ETH trades like a “bridge asset” between BTC and alts, it tends to get caught in the same flows.
So while ETH isn’t included in CRYPTOCAP:TOTAL3 , the technical structure of CRYPTOCAP:TOTAL3 gives us strong hints about where ETH and the altcoin market could be heading.
Step 3: Check USDT Dominance (USDT.D)
Yes, you can chart USDT dominance, and it’s often a leading indicator. Why?
If USDT.D goes up → money flows into stablecoins → crypto selling pressure.
If USDT.D goes down → money flows into crypto → bullish risk-on move.
Right now:
USDT.D broke out of a descending trendline and is retesting the breakout region.
It’s also printing a harmonic pattern that suggests upside continuation.
Step 4: Order Flow – who’s really buying ETH?
This is where the story gets clear:
Aggregated Spot CVD = trending down heavily.
Price goes up while spot CVD goes down = spot is selling into strength → no real demand.
Futures CVD (stablecoin-margined) = trending up heavily.
This means perps are pushing price higher with leverage.
Futures CVD (coin-margined) = trending down.
Another divergence → no strong confirmation from that side either.
Stablecoin OI:
First impulse up = OI dropped → shorts closing, not buyers entering.
Since Oct 1, OI rising → new longs piling in.
ByBit Order Flow: heavy leveraged longs entering, but looks like absorption.
For those that don't understand it:The rally is built on FOMO leverage longs, not real buyers. That’s fragile.
Conclusion
All the ingredients are here for a mega squeeze:
CRYPTOCAP:TOTAL3 at double AVWAP + VAH + Fib confluence,
ETH backfilling inefficiencies into double AVWAP supply,
USDT dominance signaling risk-off,
Order flow showing no spot demand, only leveraged perp longs.
When this unwinds, it won’t just be ETH. Expect broad crypto to follow.
The trap is unfolding. Don’t get caught on the wrong side.
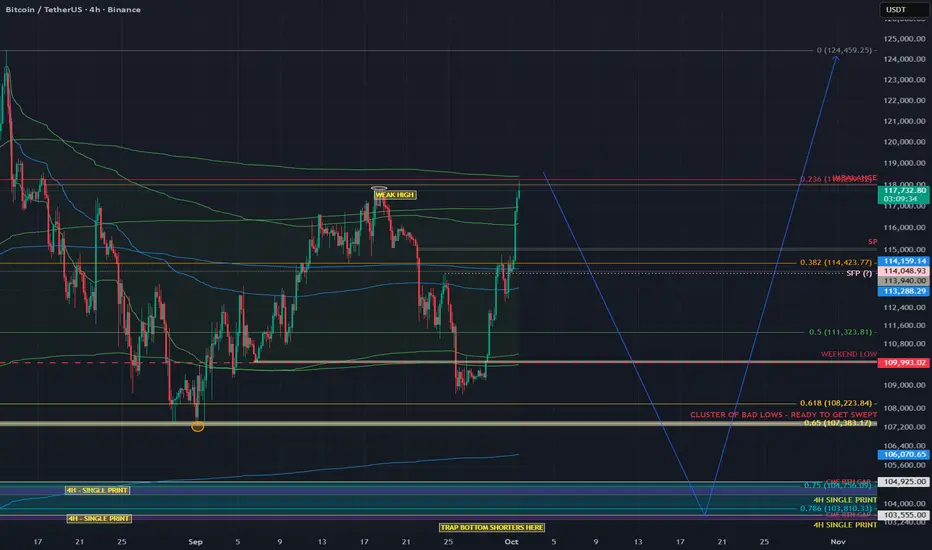
BITCOIN’S PUMP BEFORE THE DUMP — CRYPTO ABOUT TO CRASHTRADERS, WE ARE STARING RIGHT INTO THE EYE OF THE STORM. BITCOIN’S “TOO GOOD TO BE TRUE” RALLY IS BEING PROPPED UP BY LEVERAGED PERPS, NOT REAL SPOT BUYING. THE CHART IS SCREAMING EXHAUSTION: AVWAP BANDS COLLIDING, ORDER FLOW MAXED OUT WITH AGGRESSIVE LONGS, AND A DANGEROUS IMBALANCE AROUND 118K. THIS IS THE PERFECT BREEDING GROUND FOR A MEGA LONG SQUEEZE THAT WILL NOT ONLY RIP THROUGH BITCOIN BUT DRAG THE ENTIRE CRYPTO MARKET DOWN WITH IT. THE PUMP IS THE TRAP. THE DUMP IS LOADING
TLDR;
This leg looks futures-driven, not spot-backed. We’re pushing into AVWAP outer-band confluence with imbalances near 118k while leveraged longs pile in. Base case: sweep the mid-Sept Weak High, fail, rotate down toward 104k (and maybe 98.5k). I’ll flip only if spot CVD takes the lead and price accepts above the AVWAP band cluster.
Why I think the “mega long squeeze” is loading
1) Who’s actually buying? (Spot CVD vs Futures CVD)
Spot CVD: still negative/underwhelming across the push → real buyers (spot) aren’t lifting.
Futures CVD (stablecoin-margined): rising with Open Interest → perps are doing the heavy lifting.
Translation: Leverage is pushing price, not genuine spot accumulation. These moves are fragile and unwind hard when OI compresses.
2) AVWAP confluence (the auction math)
I’m tagging anchored VWAPs from opposing pivots (swing low→high and swing high→low).
The outer bands from these anchors are overlapping in the same zone → both bottom-anchored longs see it as expensive (profit-taking), and top-anchored shorts defend their break-even.
That overlap = double-sided supply. Historically, these reject unless fresh spot demand blows through (which we don’t have… yet).
Still have bad September lows that are likely to be swept at 107k~
3) 118k imbalance
There’s an inefficient push / imbalance around 118k. Thin structure often gets tapped/swept, then mean-reverts if the follow-through is purely leveraged.
4) Order flow is too aggressive (late longs)
OI up + positive delta into resistance = new longs chasing.
On footprint, you can see buy-side aggression meeting absorption near the top of the move. That’s classic trap fuel if we print an SFP.
Trade idea (conceptual, not financial advice)
Base case path (bearish):
✅ Sweep the Weak High (mid-Sept) into 117.8–118.8k (imbalance + AVWAP band confluence).
✅ Print a Swing-Fail Pattern (SFP) / rejection wick on 5–15m with:
Spot CVD NOT confirming (stays flat/negative),
OI spikes while delta stalls (late longs absorbed).
Short after the reclaim/failure back below the swept high; stop above the SFP high.
Targets / magnets:
113.2–114.1k (0.382 zone / local AVWAP midlines)
111.3k (0.5 retrace / prior balance edge)
109.9–109.3k (weekend low / prior node)
106.0–104.9k (SP + LVN cluster, high-prob test area)
Stretch: 103.5k (4H single print) → 98.5k if liquidation cascade extends.
validation / flip criteria:
Acceptance above the AVWAP outer-band cluster and 118.8k with:
Spot CVD turning positive and making higher highs,
OI stable or down on further upside (less leverage dependence).
If that happens, I stand down on the short idea and reassess for continuation
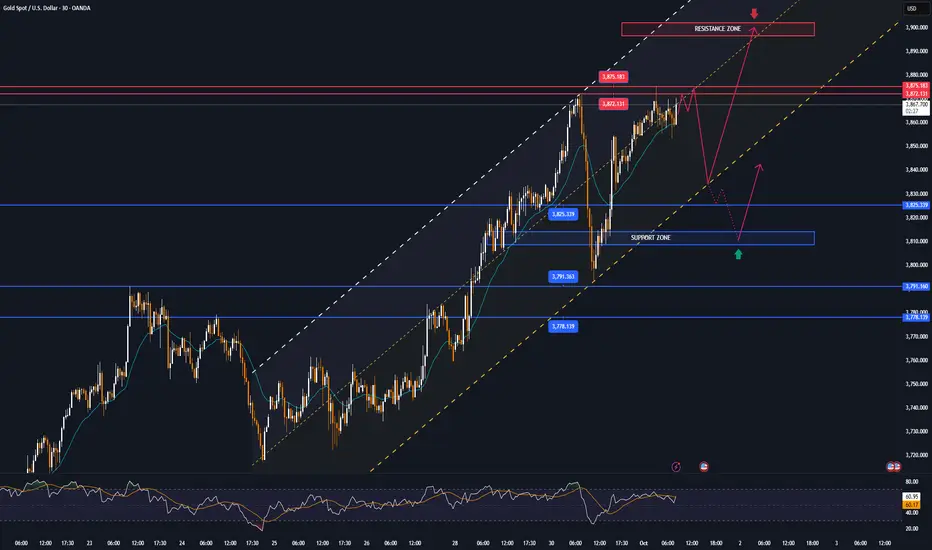
US budget deadlock causes GOLD to break peak, USD to plummetOn September 30, spot OANDA:XAUUSD prices jumped $24.7 to close at $3,858.23 an ounce, after hitting a new record high of $3,871.73 an ounce.
The main reasons came from two factors: concerns about a possible US government shutdown and weak employment data, which raised expectations that the Federal Reserve (Fed) would continue to cut interest rates. This put pressure on the US dollar and boosted demand for safe-haven gold.
According to the US Department of Labor, the number of jobs increased only slightly in August, while the demand for recruitment decreased sharply. Consumer confidence also fell to a five-month low. The US dollar index (DXY) therefore fell 0.17% to 97.78 - the lowest level in a week.
Experts say gold benefits from the weaker dollar and the prospect of the Fed cutting interest rates in October, with the probability of up to 97% according to the CME FedWatch tool.
Meanwhile, the stalemate between the two parties in Congress has put the US government at risk of running out of budget by midnight on September 30. If no agreement is reached, the shutdown will disrupt the release of many important economic data, including the non-farm payroll report.
If the US government shutdown lasts longer, the negative impact on the economy could force the Fed to loosen policy more strongly, thereby further boosting the gold price rally.
Technical outlook analysis of OANDA:XAUUSD
Main trend:
• Gold is still in a narrow uptrend channel (parallel uptrend channel).
• Candlesticks are sticking close to the upper edge of the uptrend channel ⇒ buying power is quite strong but also showing signs of “overextending”.
• RSI above 70 ⇒ Gold is in the overbought zone, risk of short-term correction.
Important levels (Fib + Resistance/Support):
• Strong resistance: 3,872 – 3,875 USD/oz (Fib 0.618 + psychological block).
• If broken, the next target is 3,938 – 4,022 USD/oz.
• Nearby support: 3,825 USD (Fib 0.5) and 3,778 – 3,791 USD (confluence of Fib 0.382 + horizontal support).
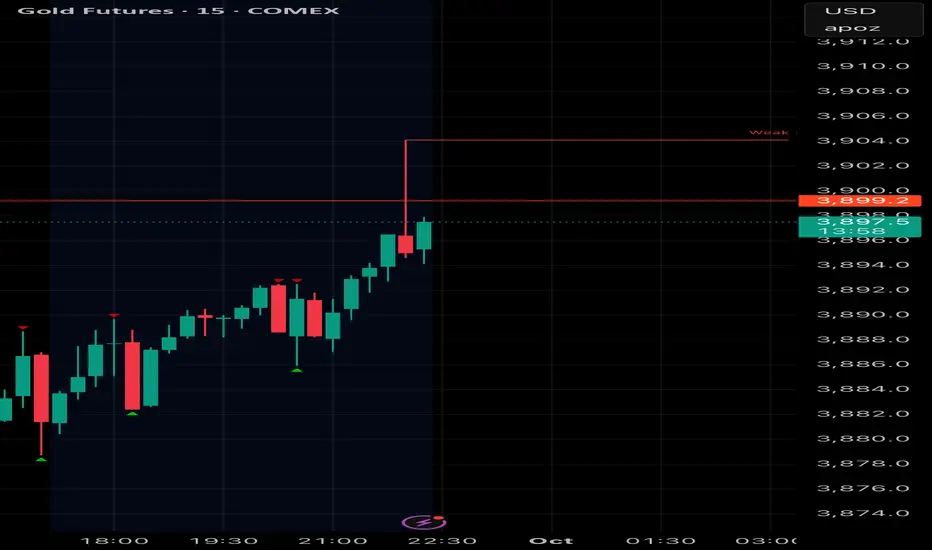
SELL XAUUSD PRICE 3901 - 3899⚡️
↠↠ Stop Loss 3905
→Take Profit 1 3893
↨
→Take Profit 2 3887
BUY XAUUSD PRICE 3810 - 3812⚡️
↠↠ Stop Loss 3806
→Take Profit 1 3818
↨
→Take Profit 2 3824
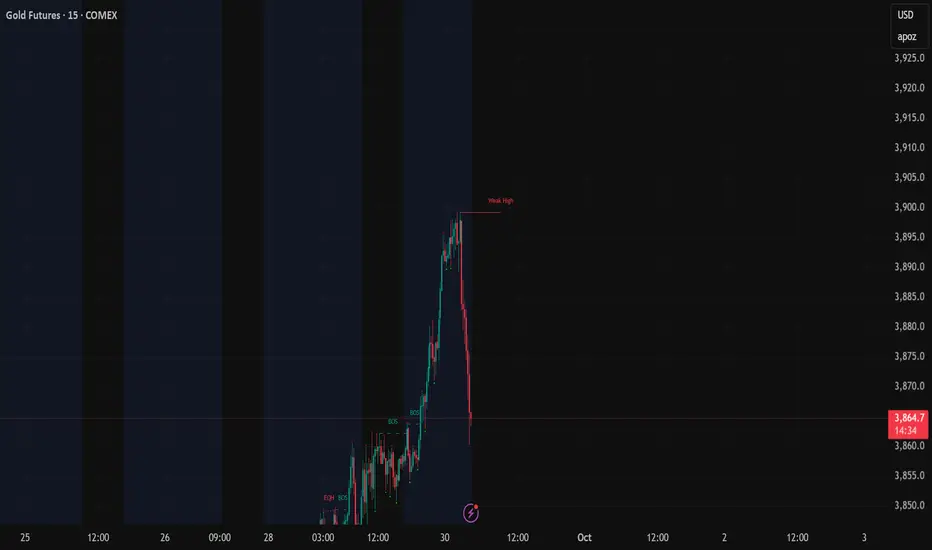
GC quick pullback?I’m looking to take another quick pullback here with tight stops and targeting higher timeframe lows. Here goes.
Platinum for a short?after a bullish run, the fundamentals on platinum have shifted sharply into bearish bias, aligning perfectly with a key weekly supply zone. The recent weekly rejection candle confirms seller presence and validates the zone.

SPX500 – Bearish Below 6,662 as Shutdown Risks Cloud Fed OutlookSPX500 – Overview
SPX500 is trading cautiously as Wall Street weighs the risk of a potential U.S. government shutdown and the Fed’s next policy steps.
The lack of clarity over upcoming economic data—especially if NFP is delayed—adds to volatility and makes short-term moves highly data- and headline-driven.
Technical Outlook
The index has stabilized below the 6,662 pivot, which supports ongoing bearish momentum.
→ As long as price stays under 6,662, downside targets are 6,635 and 6,617, with a further extension toward 6,580 if momentum accelerates.
However, if price stabilizes above 6,673, the bullish trend could resume toward 6,699 and higher.
Pivot: 6,662
Support: 6,635 – 6,617 – 6,580
Resistance: 6,674 – 6,699 – 6,742

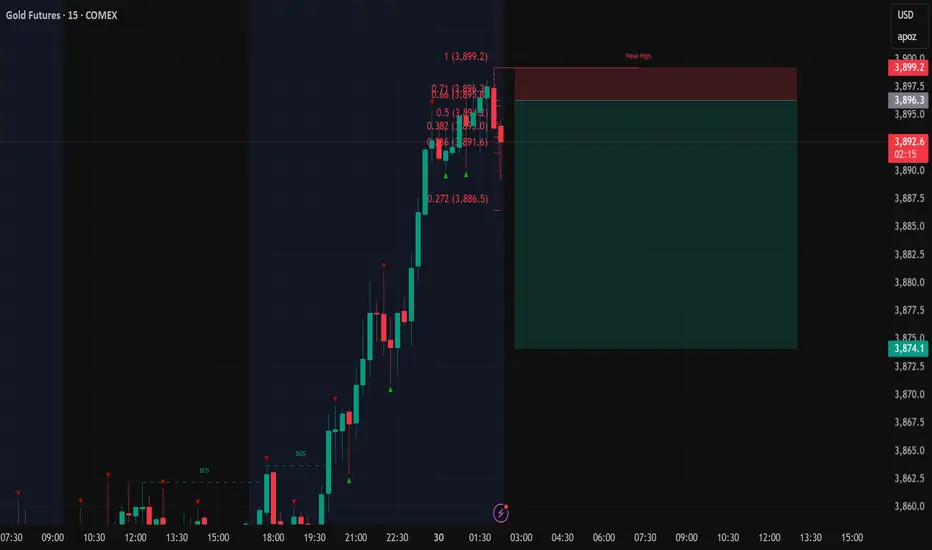
GC pullbackMy setup here I will consider shorts
The best trades come to the patient, not the impulsive. Heaven rewards the same!
We Trade for Christ not profits. Profit is temporary, you cant take it with you.
and in doing so, trading becomes very easy.
GOLD surges, US faces risk of government shutdownOn September 29, the spot price of OANDA:XAUUSD increased by nearly 2%, surpassing the threshold of 3,800 USD/ounce and setting a record high. At the end of the session, the gold price reached 3,833.53 USD/ounce, up 74.13 USD compared to the previous session. During the day, this precious metal had reached a peak of 3,834.18 USD/ounce.
The sharp rise in gold prices is due to many factors: concerns about the risk of a US government shutdown, expectations that the Federal Reserve (Fed) will soon cut interest rates and escalating geopolitical tensions.
US President Donald Trump met with senior leaders of both parties in Congress on September 29 to find a solution to extend the budget. If no agreement is reached, the federal government will begin to shut down on October 1, right when the 2026 fiscal year begins. The US Department of Labor also confirmed that it will temporarily suspend the release of economic data, including the September jobs report, if this scenario occurs.
On the geopolitical front, the Russian Defense Ministry said its troops had taken control of the village of Shandryholove in the Donetsk region, adding to the uncertainty and boosting safe-haven demand for gold.
Falls in US Treasury yields also helped support gold prices. The 10-year yield fell 3 basis points to 4.141%, while real yields fell 3.5 basis points to 1.761%.
The US dollar also weakened, with the DXY index down 0.27% to 97.91, making gold cheaper for holders of other currencies.
According to forecasting platforms Kalshi and Polymarket, the possibility of a US government shutdown on October 1 has increased to 70%, compared to about 50% at the end of last week. This has further increased the uncertainty in the market. Since the beginning of the year, gold prices have increased by more than 43%, thanks to the demand for reserves from central banks and expectations of the Fed easing monetary policy. Many major financial institutions, including Goldman Sachs and Deutsche Bank, continue to forecast that gold has room to increase in the coming time.
Technical analysis & trading strategies OANDA:XAUUSD
Quick Summary
Price is in a clear ascending channel on the daily chart, short-term MAs are moving up to support and RSI has some momentum. Fibonacci on the chart shows clear targets: 3.872 (0.618) → 3.938 (0.786) → 4.022 (1.00). Immediate support is in the ~3.791–3.777 range. Overall: the main trend is still up, trade with the trend is preferred.
Main setup, Long in trend (Safety / Swing)
Idea: Buy when price returns to support zone in rising channel (pullback) or confirms touching the lower edge of the channel and bounces up.
Breakout (Strong, Confirmed)
Idea: If price closes Daily & has a strong bullish bar above the resistance level 3.872 (Fibo 0.618) or closes above the channel top with high volume → buy chasing the strong trend.
Breakdown scenario
• If the daily close is below 3,720–3,706 (MA + channel bottom), the bullish structure is considered damaged — exit long or switch to wait for deeper buy-on-dip.
• In that case, a reasonable new buy point would be at 3,630–3,680 (deep support zone, fib 0).
Risk Management
• Risk events: NFP, Fed speeches, US government shutdown risk — strong volatility can wipe out SL. Before big news: reduce order size or limit trade.
• RSI: high (near overbought zone) → technical correction is likely to appear; therefore, prioritize entry at pullback rather than catching the top.
• Capital management: risk per trade ≤ 1–2% of capital; use order size appropriate to SL distance.
Big Attention!
• Price enters Entry zone or closes on the day of Breakout confirmation.
• Support volume (Breakout with increased volume is a strong signal).
• Clear SL, TP divided into 2-3 parts.
• Reduce weight before big news (NFP / Fed / risk-off).
SELL XAUUSD PRICE 3867 - 3865⚡️
↠↠ Stop Loss 3871
→Take Profit 1 3859
↨
→Take Profit 2 3753
BUY XAUUSD PRICE 3782 - 3784⚡️
↠↠ Stop Loss 3778
→Take Profit 1 3790
↨
→Take Profit 2 3796

NQ Shorts re entryAfter the recent win I saw a new clear break above my set levels. And a perfect textbook reversal formed. Entere more shorts.
Setting alerts and waiting patiently is how consistency starts, once you form those small habits over time it becomes simple repition and then profitability flows from there.
I didnt find this consistency until I aligned my trading with Christ.

GOLD surpasses historical peak - waiting for boost from NFPNews of the past week: OANDA:XAUUSD approaches historical peak, benefits from US tariffs and geopolitical tensions
• In the trading session on September 26, the spot gold price surpassed the $3,760/ounce mark and fluctuated around $3,780, just a short distance from the historical peak of $3,791 set earlier this week. This is also the sixth consecutive week of increase for the precious metal, thanks to increased demand for safe havens in the context of new US tariffs and escalating geopolitical tensions.
• The August personal consumption expenditures (PCE) inflation report contained few surprises: Core PCE rose 0.2% month-over-month, in line with forecasts and below July's initial 0.3% reading (which was later revised down). Year-over-year, core PCE held steady at 2.9%, still above the Fed's 2% target. Total PCE rose 0.3% month-over-month, up from July's 0.2% reading; year-over-year, it edged up to 2.7% from 2.6%.
• This inflationary trend has weakened the US dollar, providing additional support for gold prices. However, the Fed’s monetary policy picture remains cautious. After cutting interest rates by 25 basis points last week, many Fed officials have stressed that there is no need to rush to ease further as price pressures persist despite signs of a slowdown in the labor market.
• Meanwhile, U.S. economic data released on Thursday, including stronger-than-expected second-quarter GDP growth and lower jobless claims, added to the Fed’s concerns, potentially complicating the path to rate cuts, while gold continues to benefit from haven demand and a fraught political and trade environment.
This week: Global markets await US jobs data and signals from the Fed
• From September 29 to October 4, global financial markets will be watching the speeches of US Federal Reserve (Fed) officials after the September interest rate cut. The biggest highlight is the non-farm payroll (NFP) report released on Friday, a factor that could shape the interest rate path at the Fed's meeting in late October.
• At the start of the week, the Eurozone will release a series of data on economic sentiment, consumer confidence and industrial climate, important indicators to check the possibility of escaping the risk of stagflation. On Tuesday, Australia decides on its benchmark interest rate, Japan publishes its policy summary, while China releases its manufacturing PMI. Germany also releases CPI and retail sales on the same day. In the US, Chicago PMI and JOLTs employment data will be released, along with a series of speeches from regional Fed presidents, where views on interest rate cuts are clearly divided.
• Wednesday will see the US ADP jobs report and the Eurozone harmonized CPI, which are key data for ECB policy. In addition, the final PMIs from the Eurozone, Germany, France and the UK will be released. The Fed continues its series of speeches, including from the Vice Chairman, which will further focus the market on the employment-inflation balance.
• The climax comes on Friday when the US releases its September non-farm payrolls. If the data is weaker than expected, the chances of the Fed cutting interest rates by another 25 basis points in October will increase, weakening the USD and supporting gold prices. Conversely, strong data could reverse expectations and strengthen the greenback. On the same day, Japan releases its unemployment rate, adding to the currency market.
• Overall, this week is a clash of economic data and policy guidance. NFP will be a key measure to break the Fed’s current balance, while European and Japanese data reflect global policy divergence. For investors, gold and the US dollar are likely to be volatile, while crude oil will be influenced by inventory data and Chinese PMIs.
Technical Outlook Analysis OANDA:XAUUSD
Summary: Gold on the daily chart is running in a clear uptrend channel, buyers are still in control but need to pay attention to the accumulation phase and high RSI before entering orders.
Technical perspective
• Main trend: Strong increase — price is fluctuating in a clear uptrend channel, tops/cores/bottoms are all making lower and higher lows → bullish structure is intact.
• Moving average (MA): Short-term MA is pointing up, price is above MA → confirms the uptrend and MA acts as dynamic support when there is a pullback.
• Key support: ~3,720–3,738 USD/oz (near support/lower consolidation band); stronger support around 3,629–3,630 (previous bottom).
• Technical resistance/target: immediate resistance ~3,791 USD (recent top). Fibonacci targets if broken: 3,825 (0.5) → 3,872 (0.618) → 3,938 (0.786) → extension to ~4,022 (extension).
• RSI & momentum: RSI is in high territory but not yet giving strong reversal signals — momentum remains positive but warns of technical correction risk.
Risk management tips & signals to watch
• Split orders, don't go all-in; limit risk to 1–2% of account per order.
• Monitor RSI: if you see a negative Divergence + a strong bearish candle closing below the lower channel boundary, postpone the Buy.
• Macro news (PCE, NFP, Fed speech) can create a strong gap, it is best to use Stop Trading around those events.
• If it breaks below 3,630 with high Volume, the Bullish Scenario is null, need to switch to capital preservation.
Basic scenario: still prioritize long because of the bullish structure and MA support. However, smart Trades buy with a plan, have disciplined Stop, and don't forget: gold likes macro Drama, so keep a flexible mentality.
SELL XAUUSD PRICE 3813 - 3811⚡️
↠↠ Stop Loss 3817
→Take Profit 1 3805
↨
→Take Profit 2 3799
BUY XAUUSD PRICE 3753 - 3755⚡️
↠↠ Stop Loss 3749
→Take Profit 1 3761
↨
→Take Profit 2 3767

Nq shorts at the momentI took a short position here and am looking to trail it down for a decent RR.
Glory to Christ!

#BTCUSDT.P (15m Chart)#BTCUSDT.P
(15m Chart)
🔹️ Bitcoin Futures Analysis 🔹️
✅ Entry Zone: 109,800 – 109,500
❌ Stop Loss: 108,000
🎯 Targets:
🔰 Target 1: 111,000
🔰 Target 2: 111,800
🔰 Target 3: 112,400
🔰 Target 4: 113,600
🔰 Target 5: 114,500
📌 Based on the current conditions of Bitcoin and USDT dominance, I expect a bullish move in the market this week.
📍 This is the setup I expect to play out for Bitcoin.
⚠️ Important Notes:
Keep leverage below 10.
Follow risk management strictly.
Do not place pending orders. I’m monitoring the market myself, and if the entry zone is reached and conditions look good, I’ll announce the entry.
🆔 @Rasoolahmadi

GOLD MARKET ANALYSIS AND COMMENTARY - [Sep 29 - Oct 03]This week, after opening at $3,683/oz, OANDA:XAUUSD prices jumped to $3,791/oz after NATO forces intercepted three Russian MiG-31 fighter jets when they violated Estonian airspace, causing investors to worry about an escalation of the NATO-Russia conflict. However, after that, Fed Chairman Jerome Powell's cautious tone about further interest rate cuts, along with the US GDP data in the second quarter soaring to 3.8%, pushed gold prices down to $3,717/oz. Gold prices then recovered and closed the week at $3,760/oz.
Next week, the US will announce the non-farm payroll (NFP) figures for September, which are expected to reach 51,000 jobs, much higher than the 22,000 jobs in August. The recovery in NFP figures compared to the previous period is also natural when the US economy still maintains its growth momentum.
However, according to many experts, the September NFP may only be around the expected level, and it is unlikely to exceed the expected level of 51,000 jobs, because US businesses are still facing difficulties due to tariffs and have not expanded their recruitment activities this month. If the NFP is only below 51,000 jobs, this will still be a concern for the FED, forcing the agency to consider further interest rate cuts, supporting the gold price next week to move closer to 3,800 USD/oz, or even exceed this level.
📌In terms of technical analysis, the average price calculated for the D1 chart corresponds to 3,425-3,450 USD/oz. Since breaking through the peak of 3,500 USD/oz, the gold price has increased by approximately 300 USD. Technical indicators signal an overbought state, but the gold price has not shown any signs of a correction. The next resistance zones are based on round resistance levels such as 3,800-4,000 USD/oz. In the near future, if the gold price continues to increase, it may touch around 3,800-3,850 USD/oz. In case of a correction, the price will return to around 3,650 USD/oz.
Notable technical levels are listed below.
• Key support: ~3,720–3,738 USD/oz (near support/lower consolidation band); stronger support around 3,629–3,630 (previous bottom).
• Technical resistance/target: immediate resistance ~3,791 USD (recent top). Fibonacci targets if broken: 3,825 (0.5) → 3,872 (0.618) → 3,938 (0.786) → extension to ~4,022 (extension).
SELL XAUUSD PRICE 3824 - 3822⚡️
↠↠ Stop Loss 3828
BUY XAUUSD PRICE 3659 - 3661⚡️
↠↠ Stop Loss 3655

My past present and Futures with Christ!We have been doing things quite different lately.
One setup is all we do.
It is quite boring.
But it works
and Christ is the center of it all!