Options Blueprint Series [Intermediate]: Lunar Timing and ThetaIntroduction
This edition of the Options Blueprint Series focuses on gold futures and micro gold futures, using an iron condor options structure to explore how time decay (theta) can be positioned in an environment where signals conflict rather than agree.
Gold has been trading at elevated levels, attracting strong participation from momentum-driven traders while simultaneously showing signs of short-term exhaustion. This creates a valuable learning environment for options traders, particularly those interested in non-directional strategies that rely more on time and range behavior than outright price direction.
This article is presented as a case study. All tools, indicators, and trade structures discussed are used for educational purposes only. Lunar timing, in particular, is included as a belief-based analytical lens used by some market participants, not as a predictive mechanism.
Market Context: Gold at Elevated Levels
Gold futures have experienced a powerful rally since the reopening of U.S. Sunday evening trading hours, extending an already strong longer-term uptrend. Price is now operating at new all-time highs, a condition that often amplifies emotional behavior among trend followers.
In such environments, markets frequently display two competing forces:
Continued upside pressure driven by momentum and fear of missing out
Short-term vulnerability driven by overextension, crowding, and mean-reversion dynamics
Rather than attempting to resolve which force will dominate, this Options Blueprint explores how options structures can be used to frame uncertainty itself.
Analytical Inputs Used in This Case Study
This framework combines multiple analytical perspectives. None are presented as definitive signals; instead, they are used to illustrate how diverse inputs can shape options structure selection.
Lunar Timing (Moon Phases Indicator)
The chart highlights waxing and waning moon phases:
Waxing moons are displayed in blue
Waning moons are displayed in gray
The current market condition coincides with a waxing moon phase, which some traders interpret as a potentially bearish timing window. It is important to stress that lunar analysis is belief-based, not empirically causal. Its inclusion here is intentional for educational diversity and contextual layering, not validation.
Bollinger Bands® on Multiple Timeframes
Two Bollinger Bands® sets are applied:
One based on the daily timeframe
One based on the weekly timeframe
Price is approaching, and in some instances penetrating, the upper bands on both timeframes simultaneously. This alignment often signals volatility expansion and late-stage trend behavior, increasing the probability of range stabilization or consolidation, even if the broader trend remains intact.
RSI and Divergence
The Relative Strength Index is set to standard parameters: Length = 14
A bearish divergence is visible, where momentum fails to confirm new price highs. Notably, the
RSI length coincides numerically with half of a lunar cycle. This coincidence is observational only and does not imply a functional relationship.
Structural Support Below Price: UFO Context
Below current price, the chart highlights UFOs (UnFilled Orders) clustered near 4,527. These represent areas where prior price discovery was incomplete, often acting as zones of liquidity and structural interest.
This region introduces an important counterbalance:
While short-term indicators lean bearish
Structural market mechanics suggest potential downside cushioning
This combination reinforces the idea of a bounded market environment, rather than a clean directional thesis.
Why an Iron Condor Fits This Environment
When markets present conflicting directional evidence, strategies that benefit from price containment and time decay become particularly relevant.
An iron condor:
Does not require a bullish or bearish forecast
Defines risk in advance
Benefits from theta as time passes
Allows strike placement around known volatility and structure zones
In this context, the iron condor serves as a framework for uncertainty, not a directional expression.
Iron Condor Structure (Illustrative Example)
This case study uses a January 27 expiration within the GCG contract cycle.
Call Side
Short 4,850 call
Long 4,900 call
Put Side
Short 4,500 put
Long 4,450 put
The strikes are positioned at approximately equal distance from current price, with the downside aligned near known UFO structural support.
Key Characteristics
Net theoretical credit: approximately 10.3 points
Theoretical maximum risk: approximately 39.7 points
Lower break-even: near 4,490
Upper break-even: near 4,860
As long as price remains within this range through expiration, the structure benefits from time decay. If price exits the range, losses are predefined and limited.
Theta: Time as the Primary Variable
In short-option structures, theta becomes the dominant driver of performance when price remains stable.
Key educational takeaways:
Theta accelerates as expiration approaches
Time decay is not linear
Volatility changes can amplify or offset theta
Direction matters less than location and pace
This structure highlights how patience and risk definition often matter more than directional conviction.
Managing an Iron Condor
There are many ways traders manage iron condors as conditions evolve. Without going into procedural detail, common approaches include:
Rolling positions forward in time
Adjusting strikes to rebalance risk
Reducing exposure on one side of the structure
Management decisions depend on price behavior, remaining time, volatility, and individual risk tolerance.
Contract Specifications: GC vs MGC
Gold Futures (GC)
Contract size: 100 troy ounces
Tick size: 0.1
Tick value: $10
Outright margin: $22,900
Micro Gold Futures (MGC)
Contract size: 10 troy ounces
Tick size: 0.1
Tick value: $1
Outright margin: $2,290
Both contracts follow the same structural logic, allowing traders to scale exposure while maintaining identical analytical frameworks.
Margin requirements for futures and futures options are dynamic rather than fixed, meaning they may vary over time in response to changes in market volatility, price levels, and risk conditions as determined by exchanges and clearing firms.
Depending on the broker and clearing arrangements, the specific margin requirement for an iron condor is frequently set near the position’s maximum theoretical risk; in this illustrative case study, that risk is approximately 39.7 points ($397), though margin treatment can vary.
Risk Management Considerations
Even defined-risk strategies carry meaningful risk. Key principles include:
Position sizing relative to account equity
Awareness of gap and volatility risk
Understanding assignment and expiration mechanics
Options limit risk by design, but do not eliminate uncertainty.
Final Thoughts
This Options Blueprint demonstrates how lunar timing, volatility structure, RSI behavior, and UFO context can coexist within a single framework, without requiring directional certainty.
The iron condor is not presented as a solution, but as a lens through which uncertainty can be structured, with time decay acting as the central variable.
Markets rarely offer clarity. Options allow traders to respond to that reality with structure, discipline, and predefined risk.
Data Consideration
When charting futures, the data provided could be delayed. Traders working with the ticker symbols discussed in this idea may prefer to use CME Group real-time data plan on TradingView: www.tradingview.com - This consideration is particularly important for shorter-term traders, whereas it may be less critical for those focused on longer-term trading strategies.
General Disclaimer
The trade ideas presented herein are solely for illustrative purposes forming a part of a case study intended to demonstrate key principles in risk management within the context of the specific market scenarios discussed. These ideas are not to be interpreted as investment recommendations or financial advice. They do not endorse or promote any specific trading strategies, financial products, or services. The information provided is based on data believed to be reliable; however, its accuracy or completeness cannot be guaranteed. Trading in financial markets involves risks, including the potential loss of principal. Each individual should conduct their own research and consult with professional financial advisors before making any investment decisions. The author or publisher of this content bears no responsibility for any actions taken based on the information provided or for any resultant financial or other losses.
Futurestrading

Silent pressure: 6EH6 futures on the brink of a breakAfter the late-2025 rally, EUR/USD enters early 2026 in a far more fragile configuration. Since the first half of January, momentum has clearly shifted: implied volatility has fallen back toward multi-year lows, flows have refocused on the US dollar, and the market now appears concentrated on a small set of key technical levels. The March 2026 Euro FX futures contract (6EH6) reflects this transition well, with price oscillating above major supports but failing to rebuild a convincing bullish trend. In this context, the daily scenario is less about anticipating a large directional move than about exploiting a gradual imbalance in favor of the dollar, as long as certain key zones remain under pressure.
Fundamental analysis
From a macro standpoint, the divergence in momentum between the United States and the euro area remains the primary underlying driver. In the US, recent activity and employment data confirm persistent resilience. Regional Fed surveys, labor-market figures, and steady consumer spending support the idea of a slower, more cautious rate-cutting cycle than was anticipated at the end of 2025. The FedWatch tool shows a very high probability of a near-term hold, keeping US yields relatively attractive.
In the euro area, the picture is more mixed. Growth remains sluggish, inflation continues to normalize, and the European Central Bank has little incentive to adopt a restrictive tone. The expected rate differential between the Fed and the ECB has widened again in favor of the dollar, mechanically weighing on the euro. Added to this is a still-unstable geopolitical backdrop, marked by latent trade tensions and political uncertainty, which periodically favors safe-haven flows into the greenback.
Overall, fundamentals do not argue for a clear bullish recovery in the euro in the short term. Rather, they create an environment in which rebounds are viewed as selling opportunities, as long as the macro structure does not improve.
Technical and volume analysis
On spot EUR/USD, the daily structure has turned distinctly defensive since the break below short- and medium-term moving averages. The market is now trading below the 10, 21, and 55-day averages, with constant pressure on the 200-day moving average area.
The 6EH6 futures contract reinforces this view. The visible volume profile over the recent period highlights a dense value area built between 1.1650 and 1.1700, corresponding to a former balance zone that has now turned into resistance. Recent trading activity is concentrated below this area, suggesting that the market is gradually accepting lower prices. Below that, volumes thin significantly as price approaches 1.1550–1.1500, a zone that aligns with the base of the November–December move and several Fibonacci retracement levels.
Sentiment analysis
On the retail side in spot markets, data still show a majority of long positions in EUR/USD. This persistence of retail optimism, despite technical deterioration, is a classic contrarian signal. Rallies are often used to add to long exposure, increasing the risk of further liquidation phases if supports give way.
The COT report on euro futures confirms an uncomfortable setup. Net long positions held by speculators have been reduced since the December peak but remain elevated by historical standards. This indicates that the market has not yet fully purged the bullish excesses accumulated during the previous rally. Until this normalization is complete, the risk of a downside move driven by additional position unwinds remains.
Options analysis
The options market provides further insight. Implied volatility is extremely low, indicating that the market is not pricing in an abrupt shock for now. However, demand is skewed toward downside protection.
Open-interest clusters also suggest that a clean break below 1.1600 would flip dealers’ hedging dynamics, making the move self-reinforcing toward lower levels, initially 1.1550, then 1.1500, and potentially 1.14.
Trade idea (6EH6)
In this context, the preferred scenario remains a continuation of bearish pressure via selling into rallies.
Entry zone: 1.1690–1.1700 on 6EH6
Stop loss: above 1.1790, beyond the resistance zone and a clear technical invalidation level
Primary target: 1.1550
Secondary target: 1.1450 in case of acceleration after the first breakouts
Final thoughts
EUR/USD is at a delicate equilibrium point. The combination of dollar-supportive fundamentals, a weakened technical structure, and still-imbalanced positioning argues for a cautious yet opportunistic approach. As long as the 1.1650–1.1700 zone caps rebounds, risks are skewed toward further downside extension. In a compressed-volatility environment, breaks tend to be faster and more directional than expected. This is precisely the type of setup the 6EH6 contract appears to be offering at present.
---
When charting futures, the data provided could be delayed. Traders working with the ticker symbols discussed in this idea may prefer to use CME Group real-time data plan on TradingView: tradingview.com/cme/ .
This consideration is particularly important for shorter-term traders, whereas it may be less critical for those focused on longer-term trading strategies.
General Disclaimer:
The trade ideas presented herein are solely for illustrative purposes forming a part of a case study intended to demonstrate key principles in risk management within the context of the specific market scenarios discussed. These ideas are not to be interpreted as investment recommendations or financial advice. They do not endorse or promote any specific trading strategies, financial products, or services. The information provided is based on data believed to be reliable; however, its accuracy or completeness cannot be guaranteed. Trading in financial markets involves risks, including the potential loss of principal. Each individual should conduct their own research and consult with professional financial advisors before making any investment decisions. The author or publisher of this content bears no responsibility for any actions taken based on the information provided or for any resultant financial or other losses.

Bitcoin H1 Price Rejected From 96400 Supply With FRVP ResistanceBTCUSD H1 Timeframe After the formation of the order block, Bitcoin showed strong bullish momentum, pushing price up toward the 96,400 level. From this area, a clear supply zone has formed, where selling pressure is visible.
At the same time, the Fixed Range Volume Profile POC is acting as a key level, functioning as both resistance and support. Due to this confluence, Bitcoin is currently facing rejection from the upside. If this rejection continues and price holds below the supply zone, a move toward lower levels is likely. The first downside target is around 92,000. If this level fails to hold, the next major support comes near 90,000.

SOL - Descending Wedge Rejection at $145 | FVG Retest Incoming
What's up traders! 👋
SOLUSD is setting up for a key move. We've got a symmetrical wedge pattern with price respecting the descending resistance perfectly - hitting it and getting rejected. Let me break down what I'm seeing on the 45-minute chart.
The Setup
SOL is trading at $144.85 on the 45-minute timeframe. Price is inside a symmetrical wedge pattern - descending resistance on top (lower highs) and ascending support on bottom (higher lows). The key here: price just hit the descending resistance near $145-$147 and got REJECTED.
This is textbook wedge behavior. Price respects the trendlines until breakout. Right now, it's following the wedge DOWN toward the FVG zone.
Why I'm Leaning Bearish (Short-Term)
Price rejected from descending resistance at $147
Failed to clear $150 resistance - sellers defending
Dropped below $146 and $145 - now below 100-hour SMA
Hourly RSI below 50 - bearish momentum
MACD showing bearish pressure
Long/short ratio at 0.7569 - traders leaning short
$10.5M in liquidations - $7.7M were longs
3M performance: -20.40% | 1Y: -29.60% - macro downtrend
The Wedge Structure
DESCENDING RESISTANCE (Top): Lower highs forming - sellers capping rallies at $145-$147
ASCENDING SUPPORT (Bottom): Higher lows forming - buyers defending around $138-$140
CURRENT ACTION: Price hit descending resistance and rejected
FVG ZONE: $140-$142 is the next target for retest
TREND: Following the wedge DOWN until breakout
The News Context - January 16, 2026
Mixed signals but leaning bearish short-term:
SOL failed to hold above $146 - entered short-term correction
Price below 100-hour simple moving average
Broke below 61.8% Fib retracement of $138-$149 move
$10.5M liquidations - mostly longs ($7.7M)
Long/short ratio 0.7569 - traders positioning short
RSI below 50, MACD bearish
Bullish Catalysts (Watch For Breakout)
Solana ETF inflows $23.57M - highest in 4 weeks
Forward Industries building largest SOL treasury (6.9M SOL)
Alpenglow upgrade coming - transaction finality 100-150ms (from 12.8s)
RWA ecosystem hit $1.15B record valuation
Network processed $1.6T in 2025 trading volume
68M active addresses (up 14%) - most used network
Open Interest jumped from $6.8B to $8.8B
"Clarity Act" could ease SEC requirements for SOL
Key Levels I'm Watching
Resistance:
$145.50 - Day's high / immediate resistance
$146 - First major resistance
$148.29 - MAJOR RESISTANCE (breakout level)
$150 - Psychological round number
$155 - Next target if breakout
$162 - Extended bullish target
$200 - Analyst target (if network growth continues)
Support:
$144.85 - Current price
$141 - Bullish trendline support
$140-$142 - FVG ZONE (key retest target)
$140.23 - MAJOR SUPPORT (76.4% Fib)
$138 - Swing low
$137.72 - CHANNEL BOTTOM
$132 - Next support if breakdown
$124 - Extended bearish target
Two Scenarios
BEARISH CONTINUATION (PRIMARY):
Price continues following the descending wedge. After rejecting from $145-$147 resistance, SOL drops to retest the FVG zone at $140-$142. If FVG fails to hold, continuation to $137.72 channel bottom.
First target: $141 (trendline support)
Second target: $140.23 (major support / 76.4% Fib)
Extended target: $137.72 (channel bottom)
Breakdown target: $132, then $124
Triggers: Continued rejection at descending resistance, break below $140, risk-off sentiment, no major bullish catalyst.
BULLISH BREAKOUT (ALTERNATE):
Big news hits and price breaks above the descending wedge resistance. SOL clears $148.29 with volume and targets higher levels.
First target: $150 (psychological)
Second target: $155 (next resistance)
Extended target: $162, then $173
Moon target: $200 (if network growth accelerates)
Triggers: Break above $148.29 with volume, major ETF news, Alpenglow upgrade hype, institutional buying.
My Take - BEARISH BIAS (Short-Term)
I'm leaning BEARISH here. Here's why:
1. Price respecting descending resistance - SOL hit the wedge top at $147 and got rejected. This is textbook - follow the trend until breakout.
2. Technical indicators bearish - RSI below 50, MACD bearish, below 100-hour SMA. Momentum favors sellers.
3. Liquidation data bearish - $7.7M in long liquidations vs $2.8M shorts. Longs getting squeezed.
4. Long/short ratio bearish - At 0.7569, traders are positioning short. Smart money leaning bearish.
5. Macro structure weak - Down 20.40% in 3 months, down 29.60% in 1 year. Still well below $295 ATH.
BUT - Watch for the Breakout
The bullish catalysts are real:
ETF inflows strongest in 4 weeks
Alpenglow upgrade is massive (100ms finality)
Institutional adoption growing (Forward Industries)
Network fundamentals strong (68M addresses, $1.6T volume)
If big news hits, SOL could spike above $148.29 and invalidate the bearish thesis. But until that happens, I'm following the wedge DOWN.
Trade Plan
Bearish Entry (PRIMARY):
Entry: Rejection at $145-$146 resistance OR break below $141
Stop: Above $148.29 (above major resistance)
Target 1: $141 (trendline)
Target 2: $140.23 (major support)
Target 3: $137.72 (channel bottom)
R:R: ~1:2
Bullish Entry (if breakout):
Entry: Break above $148.29 with volume
Stop: Below $144
Target 1: $150 (psychological)
Target 2: $155
Target 3: $162
R:R: ~1:2.5
The Bottom Line
SOLUSD is respecting the symmetrical wedge perfectly. Price hit descending resistance at $147 and got rejected - now heading toward the FVG zone at $140-$142 for a retest.
Short-term, I'm BEARISH. Follow the wedge until it breaks. The FVG zone at $140-$142 is the next target. If that fails, $137.72 channel bottom is in play.
Long-term, the fundamentals are strong (ETF inflows, Alpenglow upgrade, institutional adoption). But technicals say DOWN until we break above $148.29.
Watch the FVG zone. That's your tell.
What do you think? Continuation down or breakout up? Drop your thoughts below! 👇

ES (SPX, SPY) Analysis, Key Levels, Setups for Thur (Jan 15)
The E-mini S&P 500 (ES) closed at 6,961.50, down 40.25 points or 0.57% from the previous day's close of 7,001.75. This marks the second consecutive decline, with the technology sector leading the losses.
Session Highlights:
- Prior Day High (PDH): 6,979.75
- Prior Day Low (PDL): 6,923.25
- Overnight High (ONH): 7,002.50
- Overnight Low (ONL): 6,963.50
- Volume Weighted Average Price (VWAP): 6,947.00
- Value Area High (Y-VAH): 6,957.50
- Point of Control (Y-POC): 6,940.50
- Value Area Low (Y-VAL): 6,927.50
The session featured a cautious tone, opening at 6,972.25 and briefly testing a low at 6,926.50 through New York afternoon hours. Buyers emerged near a critical cluster of support, allowing for a slight recovery ahead of the close, although the overall day ended on a negative note. The market is seeing a risk-off rotation as technology underperforms, whereas energy stocks reached all-time highs and precious metals rallied, with silver increasing by over 6% to above $92.
---
Key News and Catalysts
1. Semiconductor Tariffs (High Impact)
President Trump has implemented a 25% tariff on advanced computing chips including NVDA’s H200 and AMD’s MI325X. Certain exemptions are in place for chips used in data centers, startups, and public sector applications. The White House cautioned that additional tariffs could be imposed soon.
2. CPI/PPI Data (Released January 14)
December's Consumer Price Index (CPI) met expectations, but the Core CPI revealed weaker-than-anticipated results. The Producer Price Index (PPI) rose by 0.2% in line with forecasts. Analysts believe this data will likely lead the Federal Reserve to maintain its current stance through at least March.
3. Retail Sales (Released January 14)
November retail sales data were released post-shutdown, showing a better-than-expected increase of 0.6%, surpassing the predicted growth of 0.5%, thus reinforcing the narrative of consumer strength.
4. Bank Earnings
Bank of America reported earnings exceeding projections (98 cents vs 96 cents expected), while Wells Fargo fell short on revenue targets. The market awaits reports from Goldman Sachs, Morgan Stanley, and BlackRock, which could further influence the financial sector.
5. Geopolitical Developments
- Ongoing discussions regarding Greenland in the White House
- A Supreme Court ruling on tariffs may come soon
- Arguments concerning Federal Reserve independence are scheduled for January 21
---
Economic Calendar for January 15
8:30 AM ET (6 releases):
- Initial Jobless Claims: Expected 215K | Prior 208K
- Empire State Manufacturing Index: Expected +1.1 | Prior -3.9
- Philadelphia Fed Manufacturing Index: Expected -2.9 | Prior -10.2
- Import Prices MoM: Expected 0.0% | Prior +0.1%
- Export Prices MoM
- Continuing Claims
10:00 AM ET:
- Business Inventories: Expected +0.1%
- Existing Home Sales
Note: Future retail sales release dates remain to be determined by the Census Bureau due to ongoing data verification from the shutdown period.
---
Overnight Session Forecast
Asia Session (6:30 PM - 2:00 AM ET)
Bias: Neutral to Slightly Bearish
- Markets in Japan, China, and Hong Kong will react to the chip tariff announcements, while India is closed for local elections. Initial volatility is anticipated with a test of the overnight low at 6,963.50 expected, particularly focusing on Asian semiconductor stocks like TSMC and Samsung.
London Session (2:00 AM - 6:00 AM ET)
Bias: Neutral, Range-Bound
- With several significant UK data releases approaching, including GDP and Industrial Production, market participants should monitor for potential movements in the Euro Stoxx 50, which is at record highs. The anticipated trading range is set between 6,940 and 6,980, pending US data developments.
Pre-Market/NY Open (6:00 AM - 9:30 AM ET)
- Earnings from Goldman Sachs, Morgan Stanley, and BlackRock will influence market sentiment. The upcoming Philly and Empire Fed surveys will offer insights into the manufacturing sector, along with initial jobless claims data expected to provide a gauge on the labor market.
---
Key Resistance Zones
R1: 6,979.75 | PDH
R2: 7,002.50 | ONH + Psychological level at 7K
R3: 7,040 - 7,050 | January Swing High
R4: 7,094.50 | 1.272 Fibonacci (1H)
R5: 7,113.25 | 1.272 Fibonacci (4H)
R6: 7,149.75 | 1.272 Fibonacci (Daily)
R7: 7,161.75 | 1.618 Fibonacci (4H)
Key Support Zones
S1: 6,947 - 6,952.50 | VWAP + Asian Session Low
S2: 6,927.50 - 6,940.50 | Y-VAL to Y-POC cluster
S3: 6,923.25 | PDL / Equilibrium
S4: 6,880 - 6,900 | PWL zone
S5: 6,800 - 6,788 | PML + Major Weekly Support
The 6,923-6,940 range presents a significant confluence of support.
---
Trade Setups for Tomorrow
Primary Setup: Value Area Bounce (Long)
Context: With the bull market intact, the price is positioned within a value area, finding support below.
- Entry Zone: 6,927 - 6,940
- Trigger: Bullish displacement from support
- Stop Loss: Below 6,918
- Targets:
- Target 1: 6,965
- Target 2: 6,979.75
- Target 3: 7,002.50
Risk-Reward Calculation (for an entry at 6,935 and stop at 6,918):
- Risk: 17 points
- Target 1 Reward: 30 points → 1.76:1
- Target 2 Reward: 44.75 points → 2.63:1
- Target 3 Reward: 67.5 points → 3.97:1
Invalidation: A close below 6,918 with follow-through.
Secondary Setup A: ONH Breakout (Long)
- Entry Zone: Above 7,002.50
- Trigger: 15-minute close above ONH with volume
- Stop Loss: Below 6,985
- Targets:
- Target 1: 7,020
- Target 2: 7,040
Note: Target 1 alone presents unfavorable risk-reward; focus on achieving Target 2 with partial at Target 1.

ES (SPX, SPY) Analysis, PMI, Key Levels, Setups for Wed, Jan 14Overnight-to-NY Session Forecast: Market Consolidation with Bearish Sentiment
In the latest market outlook, a consolidation phase with a bearish tilt is anticipated (60% probability) as prices are expected to remain capped below the resistance levels of 7,000 to 7,014 during the Globex trading hours. This comes amid a risk-off sentiment observed as the market approaches the close. Traders should prepare for a trading range between 6,976 and 7,005 overnight, particularly aware of the potential for false breakouts typical of the thinner trading volumes in the Asian session. Pre-PPI positioning could keep prices compressed around the value area of 6,988 to 6,993 established yesterday.
Should the Producer Price Index (PPI) report come in soft either in-line with expectations or below 0.2% a rally towards the 7,014 to 7,024 range might be seen in the New York morning session. Conversely, if the PPI indicates rising prices, a move below 6,976 could target the equilibrium range of 6,954 to 6,960.
In a bullish scenario (25% probability), a soft PPI reading would bolster the disinflation narrative, potentially triggering a squeeze that pushes through the 7,000 mark, with upward momentum likely aimed at the 7,024 to 7,040 zone. For this to materialize, a sustained bid above the volume-weighted average price (VWAP) of 6,998 and a breach of the overnight high will be crucial. Traders should look for a cumulative volume delta (CVD) divergence as confirmation, where prices make higher lows while the CVD registers higher highs.
On the other hand, the bearish scenario (15% probability) could develop with a hot PPI release or heightened geopolitical tensions, such as a response to Iran’s tariffs. A break below 6,976 would pave the way towards the 6,954 to 6,960 range, with further bearish pressure potentially targeting the 6,911 price level if the equilibrium fails to hold. This scenario may gain traction, especially if the Nasdaq leads the downturn, reflecting the broader tech sector's sensitivities to changing rate expectations.

NDQ - Ascending Channel at FVG Decision Zone | Break 25,873?
Hey TradingView!
NASDAQ 100 is at a critical decision point right now. Let me break down what I'm seeing on the 15-minute chart.
The Setup
NDQ is trading at 25,741 inside an ascending channel, currently consolidating in the FVG zone around 25,780-25,830. Price keeps pushing up, pulling back into the FVG, then bouncing - classic accumulation pattern.
The key level is 25,873.01. Break above that = liftoff. Reject = back down to test lower supports.
Why This Level Matters
Ascending channel intact - higher highs, higher lows
FVG zone acting as decision zone - price consolidating here
25,873.01 is the KEY resistance - break above = bullish continuation
CPI came in cooler than expected - supports Fed rate cut narrative
S&P 500 and Dow at record highs - NASDAQ lagging slightly
Intel and AMD upgraded by KeyBanc - chip sector bullish
The News Context
Mixed but leaning bullish:
Core CPI cooler than expected (0.2% vs 0.3%) - bullish for rate cuts
S&P 500 hit record high Monday - broad market strength
JPMorgan beat earnings but stock dropped (credit card cap fears)
Intel +3.4%, AMD +1.9% on KeyBanc upgrades
Alphabet briefly hit $4 trillion market cap - AI momentum
Global central banks releasing coordinated support for Fed independence
Small caps outperforming (Russell 2000 +6.2% YTD vs S&P +1.9%)
Key Levels I'm Watching
Resistance:
25,873.01 - KEY BREAKOUT LEVEL (must break for bulls)
25,930 - Upper channel resistance
26,000+ - Bullish target if breakout confirms
Support:
25,780-25,830 - FVG zone (current consolidation)
25,642 - Day's low / immediate support
25,500 - Channel midline support
25,400 - Lower channel support
My Game Plan
Bullish scenario: If NDQ breaks above 25,873.01 with volume, we fly to 25,930 upper channel, then 26,000+. The ascending channel is intact, CPI was bullish, and chip stocks are getting upgraded. Break the resistance = momentum kicks in.
Bearish scenario: If we reject at 25,873 and lose the FVG zone, next stop is 25,642 (day's low), then 25,500 channel midline. High impact news (Fed drama, earnings misses) could trigger the breakdown.
Range scenario (MOST LIKELY short-term): Price continues to consolidate in the FVG zone, bouncing between 25,780-25,873. Wait for the breakout confirmation before committing.
The Bottom Line
I'm NEUTRAL with a bullish lean. The ascending channel is intact and CPI was supportive, but we need to break 25,873.01 to confirm the next leg up. Until then, we're just consolidating in the FVG zone.
Watch that 25,873 level closely. Break above = bullish. Reject = more consolidation or pullback.
What do you think? Breakout or rejection? Let me know in the comments! 👇

ES - Ascending Channel Near ATH | FVG Retest in Play
Hey TradingView community! 👋
S&P 500 futures are consolidating just below all-time highs. Let me break down what I'm seeing on the 45-minute chart.
The Setup
ES1! is trading at 7,001 inside an ascending channel, currently retesting the FVG zone around 6,970-6,990. Price keeps pushing up to resistance, pulling back to the FVG, then bouncing again. Classic consolidation near highs before the next move.
We're literally 0.19% away from the record high. The question is: breakout or rejection?
Why I'm Cautiously Bullish
Ascending channel intact - higher highs, higher lows
FVG zone holding as support - buyers defending this level
Third highest close in HISTORY yesterday
Up 19.39% over the past year - strong momentum
CPI came in line with expectations - Fed cuts still on table
Forward curve pricing 8,000+ by 2031 - long-term bullish
The News Context
Mixed signals but leaning bullish:
S&P 500 hit record high 6,977.27 on Monday - just 0.19% away
CPI in line with expectations - supports Fed rate cut narrative
JPMorgan beat earnings but stock dropped 4% (credit card cap fears)
Trump vs Powell drama continues - "that jerk will be gone soon"
Financials dragging (Visa, Mastercard down 4%+)
Gold hitting record highs - safe-haven demand elevated
Up 22.80% since tariffs announced in April 2025
Key Levels I'm Watching
Resistance:
7,036 - Day's high / immediate resistance
7,040 - Major resistance zone
7,050+ - BREAKOUT TERRITORY (new ATH)
Support:
6,970-6,990 - FVG zone (current retest)
6,955 - Horizontal support
6,900 - Lower channel support
6,858 - 2026 low (major support)
My Game Plan
Bullish scenario (PRIMARY): If ES holds the FVG zone (6,970-6,990) and bounces, we push back to 7,036-7,040 resistance. A break above 7,040 with volume = new all-time highs. Target 7,050+, then 7,100. The ascending channel is intact and we're consolidating near highs - this is typically bullish.
Bearish scenario: If we lose the FVG zone and break below 6,955, next stop is 6,900 lower channel support. Financial sector weakness (JPM, V, MA) could drag the index lower. Watch for Fed drama escalation.
Range scenario: Price continues to oscillate between FVG support (6,970) and resistance (7,040). Trade the range until breakout.
The Bottom Line
I'm CAUTIOUSLY BULLISH. The ascending channel is intact, we're consolidating just below all-time highs, and the FVG zone is holding as support. This is textbook bullish structure - consolidate near highs, then break out.
The risk is the financial sector weakness and Fed drama. But as long as we hold the FVG zone, the path of least resistance is higher.
Watch for the breakout above 7,040. That's the trigger for new ATH.
What do you think? New highs incoming? Let me know in the comments! 👇

How to Trade Opening Range on TradingViewMaster the opening range strategy using TradingView's charting tools in this comprehensive tutorial from Optimus Futures.
The opening range captures the high and low established during a defined period at the market open. It represents the first consensus between overnight positioning and new session orders, often setting the tone for the rest of the trading day.
What You'll Learn:
Understanding the opening range as a key price zone formed during the first minutes of a session
How the Opening Range High (ORH) marks the ceiling of early session activity and acts as a breakout trigger
How the Opening Range Low (ORL) marks the floor and signals potential bearish momentum when broken
Why range width matters — narrow ranges often precede explosive moves, while wide ranges may indicate exhaustion
Recognizing failed breakouts when price breaches the range but reverses back inside
How to use the range midpoint as a magnet for price and a target for profit-taking
Identifying breakout entries when price closes outside the range with conviction
Why breakouts should be confirmed with volume and price action, not used in isolation
How to add the Opening Range indicator to a TradingView chart via the Indicators menu
Understanding session settings and how to customize the time window (15, 30, or 60 minutes)
Practical examples on the E-mini S&P 500 futures chart to illustrate opening range signals in real market conditions
Applying opening range analysis across different sessions and products for higher-confidence setups
This tutorial will benefit futures traders, day traders, and technical analysts who want to incorporate opening range strategies into their trading process.
The concepts covered may help you identify early directional bias, breakout opportunities, and potential entry or exit points across different markets and timeframes.
Learn more about futures trading with TradingView:
optimusfutures.com
Disclaimer
There is a substantial risk of loss in futures trading. Past performance is not indicative of future results. Please trade only with risk capital. We are not responsible for any third-party links, comments, or content shared on TradingView. Any opinions, links, or messages posted by users on TradingView do not represent our views or recommendations. Please exercise your own judgment and due diligence when engaging with any external content or user commentary.
This video represents the opinion of Optimus Futures and is intended for educational purposes only.
Chart interpretations are presented solely to illustrate objective technical concepts and should not be viewed as predictive of future market behavior. In our opinion, charts are analytical tools — not forecasting instruments.

MYM!/YM1! Day Trade Plan — Week of 01/12/2026🎯 **MYM!/YM1! Day Trade Plan — Week of 01/12/2026** 🎯
Huge thanks to all my followers! Your support drives this content. Please like & share! 🤓📈💰
**Sample Trade Setup:**
- **Entry:** 49,286
- **Stop Loss:** 49,236
- **Take Profit:** 49,447
> 3RR! For every $100 risked, $300 is the reward.
How to Trade This Chart (Simple & Repeatable):
**🟢 LONG TRADES:** When price approaches ABOVE **orange support level**, enter long with stop below and target the next resistance level above.
**🔴 SHORT TRADES:** When price hits BELOW **orange support level**, enter short with stop above and target the next support level below.
**The Process:**
1. Wait for price to reach a marked level
2. Enter in the direction indicated by color
3. Set your stop loss tight (50 points)
4. Let it run to the next level for profit (150+ points)
5. Repeat at every level—same rules, consistent execution
*These levels are built from comprehensive backtesting and quantitative analysis with proven accuracy. Price often exceeds initial projections—trade with discipline!* NOT FINANCIAL ADVICE.
Let's capitalize on these setups this week! 📉📈🚀

ES (SPX, SPY) Analysis, CPI, Levels for Tue (Jan 13)
CPI Day Setup: Key Levels, Scenarios & Trade Ideas
FUNDAMENTAL BACKDROP
Increasing Pressure on Federal Reserve Independence
The political landscape surrounding the Federal Reserve is growing increasingly turbulent, as recent developments have raised concerns about potential interference in monetary policy. The Department of Justice served Fed Chair Jerome Powell with grand jury subpoenas on Friday, prompting Powell to defend the integrity of the Fed in a video statement, labeling the subpoenas as a "pretext" for a concerted effort to pressure the central bank into lowering interest rates. Senator John Thune has commented on the challenges this investigation poses for any future confirmation of Powell.
In a recent address, Fed President John Williams emphasized a cautious outlook, projecting U.S. economic growth to land between 2.5% and 2.75% for 2026. He noted that inflation is anticipated to peak in the first half of the year at rates between 2.75% and 3.0%, with a return to the 2% target expected by 2027. Williams reassured markets, stating that the Fed is “not under strong pressure to change rates,” and he acknowledged that the current market calm reflects an underlying uncertainty regarding these developments.
Geopolitical Tensions Rising
President Donald Trump has initiated a significant trade move, imposing 25% tariffs on nations conducting business with Iran, effective immediately. In a swift response, Iran’s foreign minister stated that Tehran is prepared for either “war or dialogue,” adding a layer of geopolitical risk that could influence market volatility in overnight trading sessions.
Foreign Exchange and Global Market Insights
In the global currency markets, the Dollar/Yen pair has reached a one-year high, trading at 158.25. Meanwhile, the Chinese Yuan continues to weaken, with the People’s Bank of China’s mid-point rate floating around 6.9734. Additionally, gold prices remain buoyed near record highs, driven by persistent demand for safe-haven assets amidst ongoing political and economic uncertainties.
TUESDAY'S KEY EVENT: CPI REPORT SET FOR 8:30 AM ET
Consensus Expectations:
- Headline CPI MoM is expected at 0.3%, up from the previous 0.2%.
- Headline CPI YoY is anticipated to remain steady at 2.7%.
- Core CPI MoM is projected at 0.3%, an increase from last month’s reading of 0.2%.
- Core CPI YoY is forecasted at 2.7%, slightly up from 2.6% previously reported.
Important Context:
Recent data collection for October and November has been impacted by the government shutdown, leading to some analysts warning of potential upside risks due to a "payback" effect from previous artificially low readings. Shelter inflation continues to be stable at around 3.0% year-over-year. The Core CPI month-over-month figure is expected to be the most immediate market mover, making it a critical focus for investors.
CPI Scenario Matrix:
- Much Lower (<0.2% Core MoM): Potential market rally of 30-50 points.
- Lower (0.2%): Anticipated rally of 15-25 points.
- In-Line (0.3%): Expected to result in market fluctuations of ±10-15 points.
- Higher (0.4-0.5%): Predicted market sell-off of 25-40 points.
- Much Higher (>0.5%): Market "flush" could lead to a drop of 40-60 points.
Technical Structure:
- Daily: Current prices are at a "Strong High 90%," indicating an extended phase while still maintaining trend integrity. Multiple higher high structures are currently showing signs of exhaustion, with a key support level at 6,900.
- 4-Hour: A change in character has been confirmed from the lows of 6,968, resulting in a sequence of higher lows at 6,950, 6,968, and 6,998. A higher low at 6,988 must hold for bullish continuation.
- 1-Hour: Prices are currently in a premium zone above 7,009, with a break of structure confirmed following recovery from the morning lows. Consolidation is forming ahead of the CPI catalyst.
Overnight Market Forecast
In the Base Case scenario, traders are positioned for a consolidation phase within the range of 7,004 to 7,013, driven by thin liquidity and pre-CPI positioning. As market participants reduce risk ahead of key data releases, expect choppy price action.
On the Bullish Case front, there’s a 25% likelihood of probing levels between 7,017 and 7,021, fueled by short covering prior to the CPI announcement. The calming tone from Fed's Williams is supporting risk appetite, but a stall is expected below the 7,025 mark.
Conversely, the Bearish Case carries a 20% probability of a dip to the 6,996 to 6,998 range, influenced by headline risks related to the Fed and tensions in Iran. There is pre-CPI hedging pressure that could lead to a bounce at the Y-VAL.
Post-CPI Scenarios
Scenario A Bullish Acceptance (35% Probability)
- Trigger: A 15-minute close above 7,025.25.
- Targets: 7,040 and then 7,058-7,065.
- Invalidation: Falling back below 7,021.
Scenario B Rejection/Fade (40% Probability)
- Trigger: A sweep above 7,021-7,025 followed by a failure to hold above 7,021.
- Targets: 6,996.50, moving down to 6,968.75.
- Invalidation: Acceptance above 7,025.
Scenario C - Breakdown (25% Probability)
- Trigger: A 15-minute close below 6,996.50.
- Targets: 6,968.75 and then 6,950.00.
- Invalidation: A reclaim and hold above 6,996.50.
BIAS & SUMMARY
Overall Lean: Slight bearish into CPI, but data-dependent
Bull Case: Cool CPI + Williams' calm tone = squeeze to 7,040+
Bear Case: Hot CPI + Fed/Iran headlines = flush to 6,968 or lower
Key Zones to Watch:
7,025 cap - break = bullish continuation
7,005 VWAP - pivot zone
6,996 Y-VAL - break = bearish acceptance
6,968 PDL - critical support
Risk Management Note: CPI releases create significant volatility. IV crush post-print is real if trading options, take profits quickly on directional moves rather than holding for extended targets.

ES (SPX, SPY) Analysis, Key Levels, Setups for Mon, (Jan 12)MACRO/FUNDAMENTAL OVERVIEW
Primary Driver: Fed Independence Crisis Signals Major Risk-Off Environment
The predominant headline today revolves around a significant development concerning Federal Reserve independence. Fed Chair Jerome Powell revealed that the Justice Department issued a subpoena to the central bank, intimating the possibility of a criminal indictment. Powell described this as part of the administration's ongoing pressure to influence rate decisions, emphasizing, "The threat of criminal charges arises when the Federal Reserve prioritizes its best assessments for public service over the President's preferences."
Market Implications:
Analysts at Evercore ISI anticipate a "sell-America" narrative reminiscent of last April's peak tariff shock, predicting declines for the dollar, bonds, and equities in Monday's trading. Following the news, the markets showed muted initial responses; the U.S. dollar slipped 0.2% against a basket of currencies, while S&P 500 futures decreased by 0.5% and Nasdaq 100 futures fell 0.8%.
Political Risk Calendar:
In a noteworthy legal development, the Supreme Court is scheduled to hear arguments regarding Fed Governor Lisa Cook's potential removal on January 21. Additionally, former President Trump is reportedly interviewing BlackRock's Rick Rieder for a Fed chair position this week. Sen. Thom Tillis (R-NC) has indicated he will oppose any Trump nominee for the Fed "until this legal matter is fully resolved."
Safe Haven Flows:
Gold witnessed a notable rise of over 1%, surpassing $4,590 per ounce, reaching record highs as concerns over Federal Reserve independence and geopolitical tensions stoked demand for safe-haven assets. Silver also experienced a significant uptick, climbing 4.4% in spot trading to $83.50 an ounce after briefly reaching $83.96. The Swiss Franc emerged as the strongest performer among G10 currencies.
Secondary Drivers:
Ongoing unrest in Iran has intensified, with reports of protests resulting in hundreds of fatalities and Trump hinting at military strikes, propelling oil prices to a one-month high (Brent above $63, WTI above $58). The banking and financial sectors experienced weakness amid Trump's intentions to freeze credit card interest rates. Meanwhile, 30-year Treasury yields climbed 4 basis points to 4.86%, driven by inflation concerns. Lastly, December's weak non-farm payroll figures (averaging just 29,000 jobs per month in Q4 compared to 57,000 in Q2-Q3) complicate the Fed's path, although inflation risks remain a significant factor.
Market Analysis: SMC Structure Overview (4H/1H)
Daily Overview: The market has recently seen a rejection from the premium zone, exceeding 7,000, leading to a sequence of lower highs following a recent higher high at approximately 7,020. A break of structure (BOS) was confirmed at these recent highs, with the market now retracing.
4-Hour Perspective: The higher-low (HL) structure remains intact, with key support located in the 6,950-6,960 range. The pivotal weekly low (PWL) at 6,900 is a crucial level that must be maintained for bullish continuation. The premium zone is clearly delineated above 7,000.
1-Hour Insights: A change of character (CHoCH) is apparent, with an HL being constructed around 6,956. However, the recent sequence of lower highs/lower lows suggests prevailing short-term bearish pressure, with an equilibrium around 6,940.
The oscillator matrix indicates a bearish momentum divergence across multiple timeframes, particularly with the RSI remaining compressed within the 50-70 range.
Primary Sentiment: Bearish to Neutral
The prevailing risk-off sentiment is underscored by the technical structure reflecting distribution from the premium zone.
Scenario 1: Fade Rally into Y-POC/Prior Close (High Probability)
The overnight gap down sets the stage for the potential to fade any rally toward the 6,995-7,005 area, which encompasses the Y-Point of Control (POC) and the prior close, contingent on confirming order flow rejection.
- Entry Zone: 6,995-7,005
- Confirmation: Look for cumulative volume delta (CVD) divergence, iceberg selling on Bookmap, and any failed breakouts at the Y-Volume Area High (VAH).
- Targets: 1) 6,968 (overnight low), 2) 6,950-6,955 (prior day low/London low), 3) 6,900 (PWL).
- Stop Loss: Above 7,020 (previous day high, PDH).
Scenario 2: Long from Discount Zone (Countertrend Play)
Should price sweep past the prior day low (PDL) and reach the 6,950 HL zone or delve deeper to the 6,900 PWL, traders should monitor for absorption signals and CVD reversal to consider a countertrend long position.
- Entry Zone: 6,945-6,955 (initial attempt) or 6,890-6,910 (PWL area).
- Confirmation: Look for robust bid absorption, CVD divergence, and visible iceberg buying.
- Targets: 1) 6,970-6,975 (mid-range), 2) 6,995 (Y-POC).
- Stop Loss: Below 6,880 for PWL entries.
Headline Risk: The market remains sensitive to headlines related to further Federal Reserve/Department of Justice developments, comments from former President Trump regarding Powell, or any rulings from the Supreme Court. Traders are advised to adjust positions in light of potential volatility.
CPI Preview: As markets position ahead of the CPI release on Wednesday, a hotter print could instigate a hawkish posture, supportive of the dollar but bearish for equities.
Good Luck

GOLD - Ascending Channel Holding Strong | FVG Retest in Play
Hey TradingView community! 👋
Gold is looking really interesting right now. Let me break down what I'm seeing on the 45-minute chart.
The Setup
XAUUSD is trading at 4,477 inside a well-defined ascending channel that's been holding since early January. After that sharp rejection from the 4,550 resistance zone, price pulled back and is now consolidating right above a key FVG (Fair Value Gap) zone around 4,460-4,480.
This is exactly the kind of structure I love to see - higher highs, higher lows, and now a healthy retest of the imbalance zone.
Why I'm Bullish
Ascending channel structure intact - buyers defending the rising trendline
FVG zone acting as support - price reacting positively here
Safe-haven demand returning amid geopolitical uncertainty
Performance is insane: +68.24% over the past year, +3.66% YTD already
52-week high at 4,550 - we're knocking on the door
Key Levels I'm Watching
Resistance:
4,500 - Psychological level and recent rejection
4,550 - 52-WEEK HIGH / Major resistance
Support:
4,460-4,480 - FVG zone (current test)
4,408 - Channel support / horizontal support
4,275 - Lower channel boundary
My Game Plan
Primary scenario: If gold holds above the 4,460 FVG zone and respects the rising channel support, I expect buyers to push price back toward 4,500-4,550 resistance. A clean break above 4,550 opens the door for 4,600+.
Risk scenario: A decisive break below 4,408 would weaken the bullish structure and could trigger a deeper pullback toward 4,300-4,350.
The Bottom Line
Structure remains constructive. The ascending channel is intact. Safe-haven flows are supporting gold amid all the Trump policy chaos and geopolitical headlines. As long as we hold above 4,408, I'm staying bullish with targets at 4,500 and 4,550.
What do you think? Are you bullish or bearish on gold here? Drop your thoughts in the comments! 👇
If this analysis helped you, please comment what you want me to analyze next!

ES (SPX, SPY) Analysis, Levels, Setups for Tue (Jan 6)U.S. stock markets closed on a positive note today, buoyed primarily by gains in the energy sector and large banking institutions. This upside was propelled by headlines related to Venezuela, which invigorated both the energy market and investor risk sentiment. Meanwhile, the ISM Manufacturing Index for December showed a contraction, remaining below the 50 threshold, which reinforces the narrative of uneven economic growth and places increased emphasis on upcoming services data scheduled for release later this week.
Looking Ahead to Tuesday:
The macroeconomic calendar for Tuesday appears relatively light, suggesting that the equity markets may engage in a more directional trading pattern unless unexpected geopolitical developments emerge overnight. The primary risk window looms larger later in the week with significant reports on ADP employment, ISM Services, and the EIA energy outlook, culminating in the Nonfarm Payrolls report.
Overnight Outlook into New York:
The most probable scenario sees a rotation around the 6948.50 level (VWAP), with a two-sided trading dynamic expected. Key support is identified at the 6942.50/6940.00 range, while the first resistance ceiling is placed between 6955.25 and 6963.50. A bullish scenario would emerge with a stable hold above 6942.50 and a successful move through 6955.25, paving the way toward the 6963.50 resistance level and beyond. Conversely, bearish pressure may materialize if the index falls below 6940.00, with a failure to reclaim 6942.50 potentially exposing levels around 6932.75 and the 6912.75-6906.00 range.
Trade Setups for Tomorrow
A++ Long Setup (Preferred):
Entry: 6932-6935 (PDL / NYAM.L test)
Stop: 6927
Target: 6948-6955
B+ Short Setup (Fade Rally) :
Entry: 6950-6955 (VWAP / Y-POC rejection)
Stop: 6960
Target: 6935-6940
Deep Discount Long (If Major Flush):
Entry: 6906-6912 (LO.H / AS.H zone)
Stop: 6900
Target: 6940-6950
Good Luck !!!

How to Trade with Volume Profile in TradingView Master Volume Profile using TradingView's powerful charting tools in this step-by-step tutorial from Optimus Futures.
Volume Profile is an advanced charting indicator that helps traders identify key support and resistance levels, areas of price acceptance, and potential breakout zones by showing where trading activity is concentrated at different price levels.
What You'll Learn:
Understanding Volume Profile as a price-based volume tool that displays trading activity horizontally across price levels
How the Point of Control (POC) represents the price level with the highest traded volume
How the Value Area encompasses approximately 70% of all traded volume, bounded by the Value Area High (VAH) and Value Area Low (VAL)
Why High Volume Nodes signal areas of price acceptance and potential support or resistance
Why Low Volume Nodes signal areas of price rejection where markets tend to move quickly
Recognizing when price trades above or below the previous session's Value Area for directional bias
Why these levels aren't automatic buy or sell triggers, and how to confirm them with other tools like traditional support/resistance or trend analysis
Identifying the "low volume node breakout," a setup where price accelerates through thin areas
Spotting potential mean-reversion trades when price returns to the POC after an extended move
How to add Volume Profile tools on TradingView via the drawing tools panel
Understanding Fixed Range, Anchored, and Session Volume Profile options and when to use each
Practical examples using futures charts
Applying Volume Profile across daily, weekly, and intraday timeframes for market structure analysis and trade planning
Learn more about futures trading with TradingView:
optimusfutures.com
Disclaimer
There is a substantial risk of loss in futures trading. Past performance is not indicative of future results. Please trade only with risk capital. We are not responsible for any third-party links, comments, or content shared on TradingView. Any opinions, links, or messages posted by users on TradingView do not represent our views or recommendations. Please exercise your own judgment and due diligence when engaging with any external content or user commentary.
This video represents the opinion of Optimus Futures and is intended for educational purposes only. Chart interpretations are presented solely to illustrate objective technical concepts and should not be viewed as predictive of future market behavior. In our opinion, charts are analytical tools — not forecasting instruments.

ES (SPX, SPY) Analysis, Key Levels, Setups for Fri (Jan 2nd)Market Overview: Context for Friday
As the market transitions from year-end positioning, traders should anticipate a choppy session influenced by holiday-thinned activity. Initially, expect fluctuations without a clear directional trend, but anticipate more definitive movements once New York cash volume resumes its normal pace.
From a structural standpoint, higher timeframes continue to reflect an uptrend. However, a recent decline from the 6980s has initiated a fresh pullback, leading to a short-term bias focused on “repair mode.” A shift in sentiment could occur if prices can reclaim and hold the mid-6940s.
Currently, prices are stabilizing around the 6920 mark following a sharp decline and subsequent bounce. This positioning places the E-mini S&P 500 (ES) in a mean-reversion zone, where oscillations between key value levels are expected as traders navigate the current landscape.
Forecasting Potential Market Movements
Base Case: Expect a range-bound market with a focus on repairing price levels.
Overnight Activity: The market has shown rotation around key levels of 6916 and 6922.50, with buying interest emerging above 6908.50.
Opening Analysis: As the New York session begins, we anticipate attempts to breach the 6922.50 to 6935.25 range. Should buyers fail to maintain support above 6922.50 during retests, the market is likely to rotate back towards 6916, followed by support at 6908.50.
Bullish Scenario: A strong upward movement could materialize with a decisive breakout above 6922.50.
- Trigger Point: A 15-minute close above 6922.50, followed by pullbacks that maintain support above 6921.50.
- Target Levels: Initial target at 6935.25, with further upside potential towards 6947.50 to 6951.50.
Bearish Scenario: A downward failure could emerge if the market loses the 6908.50 level.
- Trigger Point: Persistent failures to sustain above 6916, accompanied by a 15-minute close below 6908.50.
- Target Levels: An initial downside target at 6895.25, followed by 6890.25 to 6888.00. If 6888 is breached and held, the next level of interest would be 6873.
Events to watch tomorrow (timing is ET)
• 09:45 - S&P Global US Manufacturing PMI (final)
• 16:30 - Fed H.4.1 balance sheet update (released on the next business day when the usual Thursday release falls on a federal holiday)
A++ SETUP 1 (LONG) - Rejection Fade
Entry: 6888.00-6892.25 (buy only after a flush into the pocket, then reclaim)
Stop: 6878.00
• TP1: 6922.50
• TP2: 6935.25
• TP3: 6947.50
• Invalidation: 15m body closes below 6888.00 and does not reclaim quickly
A++ SETUP 2 (SHORT) - Rejection Fade
Entry: 6947.50-6951.50 (sell only after a push up, then fail back under 6947.50)
Stop: 6962.00
• TP1: 6922.50
• TP2: 6916.00
• TP3: 6890.25
• Invalidation: 15m closes and holds above 6951.50 (or a clean push above 6962.00)
Good Luck !!!

When Indexes Stop Agreeing, Markets Start TalkingEver notice how markets can look strong… yet feel a little off?
That’s usually when indexes stop marching in sync — and right now, that’s exactly what’s happening.
Let’s break it down, no jargon overload, no crystal balls.
Four Indexes, Four Different Stories
Here’s the current lineup in US equity index futures:
S&P 500 (ES) → Pushing to fresh all-time highs
Dow Jones (YM) → Also holding above prior highs
NASDAQ 100 (NQ) → Lagging below its peak
Russell 2000 (RTY) → Still stuck under its highs
When all four move together, trends tend to behave.
When they don’t? Markets usually get… interesting.
Why This Disagreement Matters
The NASDAQ is packed with technology and AI-related names — the same group that carried much of the upside through 2025. Its failure to confirm new highs raises an eyebrow.
Meanwhile:
The Dow (YM) is strong, despite being less tech-heavy
Small caps (RTY) aren’t joining the party
Leadership is narrowing, not expanding
That’s not a signal by itself — but it is a clue.
Momentum Is Whispering (Not Shouting)
Momentum indicators aren’t screaming danger, but they are quietly tapping the mic:
NASDAQ shows a bearish divergence
Dow also shows a bearish divergence (yes, even while strong)
Russell goes a step further with a divergence and a momentum crossover
The S&P 500? Still holding up — but increasingly alone.
When momentum fades while price stays elevated, markets often shift from trending to fragile.
The Levels That Actually Matter
Here’s where structure comes in.
Two UFO (UnFilled Orders) support zones sit right below price:
NASDAQ (NQ): ~25,608
Dow (YM): ~48,127
Above these levels, structure is intact.
Below them? That’s when momentum warnings could start turning into price action.
Think of these zones as market tripwires — nothing happens until they’re crossed.
Condition-Based Thinking (No Guessing Required)
Instead of asking “Will the market drop?”, a better question is:
What would need to happen for risk to expand?
A simple framework:
NQ below support + YM below support
Weakest and strongest indexes failing together
Divergences resolving through price, not time
That’s when downside scenarios become more relevant — not before.
Quick Note on Contract Specs & Margin
All four index futures discussed are available in E-mini and Micro E-mini versions, moving tick-for-tick with the same underlying index.
At a glance:
Micro contracts = 1/10 the tick value of E-minis
Typical tick values:
ES / MES: $12.50 vs. $1.25
NQ / MNQ: $5.00 vs. $0.50
YM / MYM: $5.00 vs. $0.50
RTY / M2K: $5.00 vs. $0.50
Margin context (approximate):
ES / MES: $22,500 vs. $2,250
NQ / MNQ: $33,500 vs. $3,350
YM / MYM: $14,250 vs. $1,425
RTY / M2K: $9,500 vs. $950
Same market, same analysis — just different risk granularity. This becomes especially useful when markets are hovering near key structural levels.
The Big Takeaway
Markets don’t usually turn when everyone expects them to.
They turn when participation fades, leadership narrows, and structure starts cracking.
Right now:
Some indexes are strong
Others are lagging
Momentum is diverging
Key levels are close
No conclusions. No assumptions.
Just evidence — and levels worth paying attention to as 2026 approaches.
Want More Depth?
If you’d like to go deeper into the building blocks of trading, check out our From Mystery to Mastery trilogy, three cornerstone articles that complement this one:
🔗 From Mystery to Mastery: Trading Essentials
🔗 From Mystery to Mastery: Futures Explained
🔗 From Mystery to Mastery: Options Explained
When charting futures, the data provided could be delayed. Traders working with the ticker symbols discussed in this idea may prefer to use CME Group real-time data plan on TradingView: www.tradingview.com - This consideration is particularly important for shorter-term traders, whereas it may be less critical for those focused on longer-term trading strategies.
General Disclaimer:
The trade ideas presented herein are solely for illustrative purposes forming a part of a case study intended to demonstrate key principles in risk management within the context of the specific market scenarios discussed. These ideas are not to be interpreted as investment recommendations or financial advice. They do not endorse or promote any specific trading strategies, financial products, or services. The information provided is based on data believed to be reliable; however, its accuracy or completeness cannot be guaranteed. Trading in financial markets involves risks, including the potential loss of principal. Each individual should conduct their own research and consult with professional financial advisors before making any investment decisions. The author or publisher of this content bears no responsibility for any actions taken based on the information provided or for any resultant financial or other losses.

ES (SPX, SPY) Analysis, Key Levels, Setups for Wed (Dec 31st)Market Outlook for December 31, 2025 (NY Session)
As we approach the end of the year, investors should be aware of key economic data slated for release that could influence the equity markets, particularly the E-mini S&P 500 (ES).
Economic Calendar (All Times Eastern)
07:00 – MBA Mortgage Applications
While typically seen as a low-impact indicator, this data will be closely watched for any surprises due to its sensitivity to interest rates.
08:30 – Initial Jobless Claims
This report has been advanced this week as Thursday is a federal holiday. Given its implications for labor market strength, it could have noteworthy effects on investor sentiment.
10:00 – NY Fed Corporate Bond Market Distress Index
This indicator serves as a pulse on credit market conditions. A significant change here could signal broader market stress.
10:30 – EIA Weekly Petroleum Status Report
The release of this report comes at a time of heightened scrutiny on energy prices and inflationary pressures. It's advisable to keep an eye on potential spillover effects into the broader indices.
Market Structure Note
Please note that while the US stock market will be open for regular trading hours, the US bond market will have an early close at 2:00 PM ET. This adjusted schedule may influence trading volumes and market dynamics as we wind down the year.
Market Analysis: The Path Ahead Amid Holiday-Induced Thin Trading
The trading session was marked by subdued yet erratic price movements, a natural consequence of reduced market participation during the holiday season. Despite some fluctuations, traders largely refrained from aggressively pursuing dips, while upward movements faced difficulties in maintaining momentum.
In the macroeconomic landscape, the recently released Federal Reserve minutes underscored significant internal divisions regarding prospective interest rate cuts. This lack of consensus diminishes certainty about future rate adjustments, extending uncertainty into early 2026.
As we approach year-end, upcoming trading dynamics will be affected. With Wednesday signaling the final trading day of the year, participants should anticipate a landscape characterized by uneven liquidity. This could lead to increased volatility, particularly around key support and resistance levels, with a heightened potential for stop hunts as markets test widely recognized highs and lows.
Overnight NY Market Forecast: A Scenario Analysis
As we observe the market dynamics, we present a scenario plan that outlines potential movements for the coming hours.
Base Case: Currently, the market is oriented towards a bearish sentiment while trading below the 6950-6953 range. We anticipate a two-way trading environment within the 6928-6950 band, characterized by sharper price fluctuations than typically expected as we approach year-end.
Bullish Scenario: A definitive reclaim and sustained trading above 6953.50 would open pathways for an upward movement into the 6958-6961 range, and potentially to the psychological level of 6969-6970 thereafter.
Bearish Scenario: Conversely, a significant breach below 6928.25 could trigger a cascade towards 6926.25, followed rapidly by 6918.00. Should selling pressure intensify, the 6900 mark may become the next focal point for traders.
SETUP 1 (A++) - Long - Reclaim and go (support to value)
Entry
• Buy 6934.00-6935.00 (only after the reclaim hold is visible)
Hard SL
• 6925.75 (below 6926.25, with extra buffer)
Targets
• TP1 6953.50
• TP2 6957.75
• TP3 6961.50
SETUP 2 (A++) - Short - Rejection fade from upper cap (premium to PDL)
Entry
• Sell 6956.75-6958.00
Hard SL
• 6964.00 (above the 6961.50/6960.75 cap with buffer)
Targets
• TP1 6940.75
• TP2 6930.00
• TP3 6918.00
Good Luck !!!

When Indexes Disagree: Evidence-Based Clues Heading Into 2026Market Context: Why Futures-Based Index Analysis Matters
When equity markets approach historical extremes, surface-level price action often hides important structural information. This is especially true when analyzing cash indices alone. Futures markets, by contrast, provide continuous pricing across all trading sessions, including the Globex (Extended Trading Hours) session, offering a more complete picture of participation, liquidity, and risk transfer.
By focusing on US equity index futures rather than cash indices, traders gain visibility into how markets behave outside regular trading hours — often where meaningful positioning occurs. This becomes particularly important when markets are near all-time highs and internal alignment begins to fracture.
In this analysis, attention is placed on the four most relevant US equity index futures:
E-mini S&P 500 Index Futures (ES)
E-mini NASDAQ 100 Index Futures (NQ)
E-mini Dow Jones Index Futures (YM)
E-mini Russell 2000 Index Futures (RTY)
Together, these markets represent large-cap growth, broad market exposure, industrial and value-oriented components, and small-cap participation. When these indexes move in harmony, trends tend to persist. When they diverge, conditions often become more fragile.
All-Time Highs in Focus: Who Is Leading and Who Is Lagging
A defining characteristic of the current environment is disagreement among indexes, despite elevated price levels.
The E-mini S&P 500 Index Futures (ES) has recently pushed to a new all-time high. This reflects ongoing strength in the broader market and confirms that headline risk appetite remains intact.
In contrast, the E-mini NASDAQ 100 Index Futures (NQ) has failed to confirm this strength. Despite previous leadership, NQ is currently trading below its all-time high. This matters because the NASDAQ is heavily weighted toward technology and growth-related stocks, including those linked to artificial intelligence (AI) — sectors that provided a significant portion of upside momentum throughout 2025.
Meanwhile, the E-mini Dow Jones Index Futures (YM) is trading above its prior all-time high. This is notable because the Dow has a more diversified sector composition and is less concentrated in high-growth technology names. Its relative strength suggests that current market resilience may be coming from areas outside of the technology complex.
Finally, the E-mini Russell 2000 Index Futures (RTY) remains below its all-time high. Small- and mid-cap stocks often act as a confirmation layer for broader economic participation. When large-cap indexes make new highs while small caps lag, it can signal uneven economic traction and rising internal imbalance.
This combination — ES and YM showing strength, while NQ and RTY lag — forms the foundation of the current intermarket tension.
Momentum Evidence: What MACD Is Revealing Across Indexes
Price alone rarely tells the full story near extremes. Momentum indicators, when used correctly, help evaluate the quality of participation behind price movement.
In this case, the MACD indicator reveals important divergences across multiple indexes.
The NQ is displaying a bearish momentum divergence, where price remains elevated but momentum fails to confirm. This suggests that upside participation is narrowing rather than expanding.
The YM — despite being one of the strongest indexes — is also showing a bearish divergence on MACD. This is particularly important because divergences forming in strong markets often precede broader shifts, not because price must reverse immediately, but because momentum strength is no longer accelerating.
The RTY presents the most advanced signal set. It is not only showing a bearish divergence, but also a MACD crossover, which can be interpreted as early-stage downside momentum attempting to assert itself.
The ES, while not currently exhibiting the same degree of momentum weakness, stands increasingly isolated. When leadership narrows to one index, risk becomes asymmetric rather than evenly distributed.
Structural Risk Zones: Interpreting UFO (UnFilled Orders) Support
Momentum divergences alone do not constitute actionable signals. They require structural confirmation.
This is where UFO support and resistance levels (UnFilled Orders) become relevant. UFO zones represent areas where liquidity previously failed to transact fully, often acting as structural support or resistance when revisited.
In the current structure, two UFO support zones stand out due to their proximity to price and their relevance to both the strongest and weakest markets:
NQ: UFO support ending near 25,608.25
YM: UFO support ending near 48,127
These levels are significant because they sit directly beneath current price action. As long as price remains above these zones, structure remains intact despite momentum warnings.
However, a violation of such UFO supports would represent a meaningful shift. It would indicate that buyers previously willing to defend these levels are no longer present, allowing momentum divergences to express themselves more fully.
Conditional Scenarios: What Would Confirm a Broader Risk Shift
Rather than anticipating outcomes, evidence-based analysis focuses on conditions.
From a structural standpoint, bearish scenarios would gain credibility if:
NQ trades below 25,608.25, violating its nearby UFO support
YM trades below 48,127, removing structural support from the strongest index
Weakness emerging simultaneously in both the weakest and strongest indexes would suggest that divergence is resolving through price rather than consolidation. In such a case, broader downside expansion could develop, potentially manifesting as a sharp corrective phase.
Importantly, this framework does not assume that such a move must occur. It simply defines what conditions would matter if they do.
Illustrative Trade Framework (Educational Example Only)
For traders studying downside scenarios, a hypothetical bearish framework could be structured as follows:
Trigger: Confirmed daily close below relevant UFO support
Risk Definition: Invalidation above reclaimed structure
Objective: Next lower structural liquidity zone
Reward-to-Risk: Favorable only if structure breaks decisively
This framework is illustrative and intended solely to demonstrate how structure, momentum, and confirmation can align. It does not imply expectations or outcomes.
E-mini vs. Micro E-mini Contracts
All four equity index futures discussed — ES, NQ, YM, and RTY — are available in both E-mini and Micro E-mini formats. Both versions track the same underlying index and move tick-for-tick together. The difference lies in how risk is expressed.
ES / MES Tick size: 0.25 index points = $12.50 (ES) | $1.25 (MES)
NQ / MNQ Tick size: 0.25 index points = $5.00 (NQ) | $0.50 (MNQ)
YM / MYM Tick size: 1 index point = $5.00 (YM) | $0.50 (MYM)
RTY / M2K Tick size: 0.10 index points = $5.00 (RTY) | $0.50 (M2K)
Across all four indexes, Micro E-mini contracts represent one-tenth of the tick value of their E-mini counterparts.
Margin requirements vary by broker and market conditions. From a structural perspective:
ES / MES required margin = ~$22,500 (ES) | ~$2,250 (MES)
NQ / MNQ required margin = ~$33,500 (NQ) | ~$3,350 (MNQ)
YM / MYM required margin = ~$14,250 (YM) | ~$1,425 (MYM)
RTY / M2K required margin = ~$9,500 (RTY) | ~$950 (M2K)
This difference allows traders to express the same market thesis with far greater precision, especially when working around tight structural levels or conditional triggers.
With momentum divergences developing and key structural zones nearby, position sizing flexibility becomes critical. Micro E-mini contracts make it possible to:
Scale exposure gradually
Reduce concentration risk
Align risk more closely with invalidation levels
The analysis remains identical across E-minis and Micros — only the risk calibration changes.
Risk Management Considerations
Divergences can persist longer than expected, especially in strong trends. Acting without confirmation often leads to premature positioning.
Key principles include:
Waiting for structural validation
Defining risk before engaging
Managing exposure across correlated instruments
Avoiding overconfidence near historical extremes
Markets rarely turn because of opinion. They turn when structure and participation change.
Final Takeaway: Evidence Over Assumptions
As 2025 comes to a close, US equity index futures present a market that is strong on the surface but fractured underneath. Leadership is narrowing, momentum is diverging, and structural levels are increasingly relevant.
Whether these signals resolve through consolidation or correction remains unknown. What matters is that the evidence is now visible — and futures markets provide the clarity needed to observe it.
Data Consideration
When charting futures, the data provided could be delayed. Traders working with the ticker symbols discussed in this idea may prefer to use CME Group real-time data plan on TradingView: www.tradingview.com - This consideration is particularly important for shorter-term traders, whereas it may be less critical for those focused on longer-term trading strategies.
General Disclaimer
The trade ideas presented herein are solely for illustrative purposes forming a part of a case study intended to demonstrate key principles in risk management within the context of the specific market scenarios discussed. These ideas are not to be interpreted as investment recommendations or financial advice. They do not endorse or promote any specific trading strategies, financial products, or services. The information provided is based on data believed to be reliable; however, its accuracy or completeness cannot be guaranteed. Trading in financial markets involves risks, including the potential loss of principal. Each individual should conduct their own research and consult with professional financial advisors before making any investment decisions. The author or publisher of this content bears no responsibility for any actions taken based on the information provided or for any resultant financial or other losses.
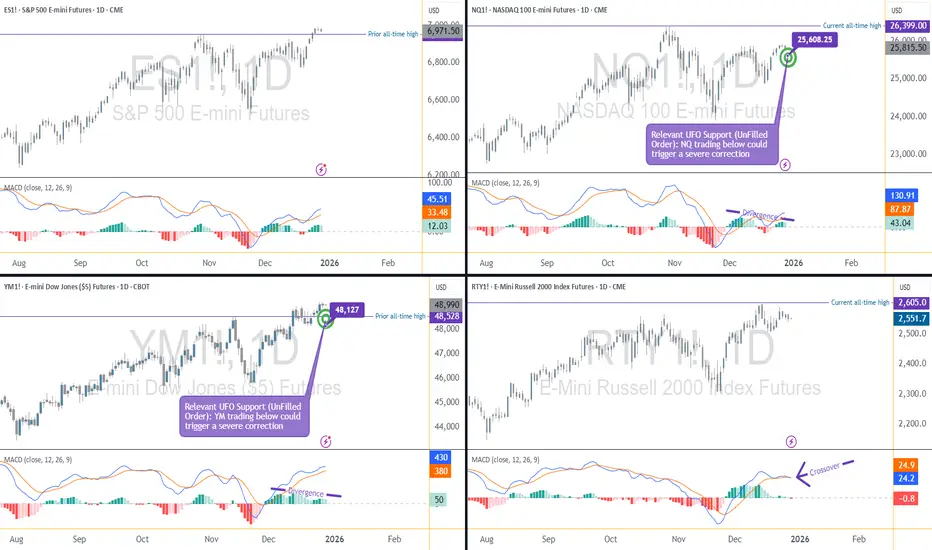
ES (SPX, SPY) Analysis, Key Zone, Setups for Fri (Dec 26)Market Overview: Context for Tomorrow
Trend Analysis: The market maintains a risk-on sentiment as we approach the holiday period, characterized by strong index performance accompanied by light trading volume. This condition often results in a “grind up or chop up” scenario, although we may witness abrupt price movements due to diminished liquidity.
E-mini S&P 500 (ES) Positioning: Currently, prices are situated in the upper range of the recent swing high, indicating a premium area. This positioning heightens the probability of a retracement towards mid-range levels before any further upward momentum takes place.
Looking Ahead to Tomorrow: Investors should anticipate one of two scenarios: (a) a decisive dip that finds support at the Volume Weighted Average Price (VWAP) or Value Area Low (VAL), followed by a re-acceleration towards the Previous Day High (PDH) or Value Area High (VAH), or (b) a definitive rejection at the PDH/VAH that results in a retracement back to the VWAP/VAL zone.
Event Risk - Friday Schedule (ET):
Macro Releases: No major U.S. economic data is scheduled for release tomorrow.
Notable Item: The NY Fed Staff Nowcast will be published at 11:45 a.m. ET, though it typically produces limited market impact relative to key indicators like CPI or NFP.
Implications for the Market: With fewer scheduled economic shocks on the calendar, we can expect a market environment driven more by trading flows than by significant data releases, indicative of a "holiday hangover" effect.
New York Session Forecast
As we head into the New York trading session, the anticipated price path for the day suggests a cautious approach.
The primary range rotation is centered around key levels at 6982.50 (Y-POC) and 6976.75 (VWAP). We expect two-way trading to persist within the confines of 6971.50 to 6988.50 until we see a clearer indication of cash volume dynamics in New York.
Bullish Scenario:
In a bullish scenario, we would need to maintain support in the range of 6976.75 to 6971.50 on any pullbacks. A sustained rally would then target upward moves, aiming for 6988.00 to 6988.50. A decisive break above 6988.50 could trigger a significant advance towards the 6996 to 7000 range.
Bearish Scenario:
Conversely, if we experience a failed attempt to break into the 6988.00 to 6996 area—indicative of a lack of acceptance—we may see a pullback towards 6976.75. A breach of the critical support at 6971.50 could lead to testing lower levels at 6962.75 and 6957.25.
A++ SETUP 1 - LONG (pullback reclaim)
Entry: 6976.75-6971.50
Trigger: 15m tags pocket and closes back above 6976.75 -> 5m higher-low -> 1m pullback holds then push
SL: 6966.00
• TP1: 6988.50
• TP2: 6996.00-7000.00
• TP3: 7006.00-7012.00
A++ SETUP 2 - SHORT (top rejection)
Entry: 6988.00-6996.00
Trigger: 15m pushes into band then closes back below 6988.50 -> 5m lower-high -> 1m pullback fails then drop
SL: 6999.00
• TP1: 6971.50
• TP2: 6962.75
• TP3: 6957.25
Good Luck !!!

Forget the Textbook: A 30-Year Reality CheckA Big Policy Moment
A central bank (BOJ) just pushed interest rates to levels not seen in 30 years.
That’s not a routine tweak — that’s a regime shift.
Textbooks might suggest a clean, logical market response.
Reality? Markets got emotional. Fast.
Selling Got Loud
Instead of an orderly adjustment, selling pressure exploded.
Not just “price going down,” but effort going through the roof.
That’s where Volume Delta comes in — the net difference between buying and selling volume. It tells us who is pressing the gas pedal.
And in this case, sellers floored it.
When an Indicator Starts Yelling
Now here’s the interesting part.
Bollinger Bands weren’t applied to price…
They were applied to Volume Delta itself.
Result?
Volume Delta plunged far below its lower Bollinger Band.
That’s not normal selling.
That’s everyone trying to get out at the same time.
Does that mean price must reverse?
Nope. But it does suggest selling is becoming inefficient.
No Safety Net Below
Here’s the catch.
There are no meaningful UFO supports (UnFilled Orders) below current price.
No obvious institutional “safety net.”
Instead, only two old technical floors remain:
0.0063330
0.0062415
Think of them as floors, not trampolines. Price may react… or punch straight through.
Reaction Beats Guessing
This is where patience matters.
Extreme selling doesn’t mean “buy now.”
It means watch closely.
At those levels, traders are looking for:
Selling pressure slowing down
Price stabilizing
Daily closes showing acceptance or rejection
No assumptions. Only reactions.
Don’t Forget the Ceiling
Even if price bounces, there’s a ceiling waiting above.
A clear sell-side UFO resistance sits near 0.0065640.
That’s leftover supply — the kind that often stops rallies in their tracks.
So any upside move?
Treat it as corrective until structure says otherwise.
Contract Specs
This analysis uses both standard and micro futures to illustrate scalable risk. Japanese Yen Futures (6J) have a tick size of 0.0000005 with a $6.25 tick value and currently require roughly ~$2,800 in margin per contract, while Micro JPY/USD Futures (MJY) use a 0.000001 tick size with a $1.25 tick value and margin closer to ~$280. Margin requirements vary by market conditions and broker policies, and micro contracts can be especially useful when volatility expands following major macro events.
The Big Takeaway
Historic policy decisions don’t end stories — they start messy chapters.
Extreme Volume Delta shows stress, not certainty.
Structure decides what comes next.
When markets digest big shocks, the edge doesn’t come from predicting —
It comes from staying disciplined while everyone else reacts.
Want More Depth?
If you’d like to go deeper into the building blocks of trading, check out our From Mystery to Mastery trilogy, three cornerstone articles that complement this one:
🔗 From Mystery to Mastery: Trading Essentials
🔗 From Mystery to Mastery: Futures Explained
🔗 From Mystery to Mastery: Options Explained
When charting futures, the data provided could be delayed. Traders working with the ticker symbols discussed in this idea may prefer to use CME Group real-time data plan on TradingView: www.tradingview.com - This consideration is particularly important for shorter-term traders, whereas it may be less critical for those focused on longer-term trading strategies.
General Disclaimer:
The trade ideas presented herein are solely for illustrative purposes forming a part of a case study intended to demonstrate key principles in risk management within the context of the specific market scenarios discussed. These ideas are not to be interpreted as investment recommendations or financial advice. They do not endorse or promote any specific trading strategies, financial products, or services. The information provided is based on data believed to be reliable; however, its accuracy or completeness cannot be guaranteed. Trading in financial markets involves risks, including the potential loss of principal. Each individual should conduct their own research and consult with professional financial advisors before making any investment decisions. The author or publisher of this content bears no responsibility for any actions taken based on the information provided or for any resultant financial or other losses.

ES (SPX, SPY) Analysis, Key Zones, Setups for Wed (Dec 24th)Market Overview: Insights from Today's Trading
U.S. equities closed higher once again, reaching fresh highs primarily driven by large-cap technology and AI stocks, although broader market participation appeared mixed. The momentum was fueled by stronger-than-expected Q3 GDP data, which, combined with a dip in consumer confidence, suggests that economic growth may remain robust even as interest rates trend lower in the future. As we approach the holiday season, thinner liquidity in the markets is becoming increasingly relevant, often resulting in subdued trading activity punctuated by abrupt moves in response to key economic releases.
Analyzing the structure, the E-Mini S&P 500 (ES) is positioned in the upper range of recent trading and is approaching a notable overhead supply zone, characterized by the recent swing highs. The recent upward movement was significant, demonstrating a rapid recovery from the low 6900s to the mid-to-high 6900s; however, the price is currently stalling beneath a well-defined resistance level. This scenario typically leads to one of two potential developments:
1. A prolonged period of consolidation beneath the resistance, followed by a sharp breakout, often triggered by key economic data released at 8:30 AM.
2. A failure to maintain support at mid-range levels, which could result in a downward rotation toward previous demand zones, commonly aligning with metrics such as VWAP, Y-VAL, or PDL.
Market Update: Key Economic Indicators and Early Closures
This Wednesday, investors should pay close attention to the following economic releases:
- 8:30 AM ET: Initial Jobless Claims report, adjusted for the holiday schedule.
- 8:30 AM ET: Advance Durable Goods Orders and the Philly Fed Non-Manufacturing Survey will also be released.
- 11:30 AM ET: Weekly Economic Index will provide additional insights into economic trends.
Please note that equity markets will close early at 1:00 PM ET, while bond markets are set for an even earlier close at 2:00 PM ET.
In noteworthy news from the energy sector, the EIA Weekly Petroleum Status Report will not follow its regular schedule this week. The next anticipated release is slated for December 29, 2025.
Overnight Forecast into the NY Session
Base Case Scenario:
Expect a period of consolidation overnight, with prices likely fluctuating within the range of 6948 to 6964. The key moment will come during the 8:30 AM ET data announcement, which should provide a clearer directional bias. If the support level at 6948-6938 holds through this data window, we anticipate another attempt to test the resistance levels at 6963.75 and 6968.75. However, a failure to surpass 6968.75 typically leads to a retraction back towards the 6947-6943 region, with a potential dip to 6938.
Upside Potential:
A decisive push above 6968.75, particularly if it sustains on a pullback rather than merely wicking through, could pave the way for movement toward the 6985-7000 range. Given that tomorrow marks a shortened trading session, these higher targets may be more suitable for “runner” strategies unless we see significantly robust momentum.
Downside Risk:
Conversely, if the 6938.50 level gives way and fails to rebound swiftly, the market is likely to rotate towards the 6919-6913 zone. This area represents the initial support level where buyers may have a viable opportunity to regain control.
A++ Setup 1 - Short rejection from the top
Entry: 6962.50-6966.00 (only after a test into 6963.50-6968.75 fails and price closes back below 6963.75)
Stop: 6974.25
TP1: 6943.50
TP2: 6938.50
TP3: 6919.25-6918.75
A++ Setup 2 - Long breakout and hold
Entry: 6970.50-6972.25 (only after a 15m close above 6968.75, then a pullback that holds above 6963.75)
Stop: 6961.75
TP1: 6998.75-7000.00
TP2: 7012.50
TP3: 7036.75-7040.00
If you enjoy our analysis, please consider boosting and sharing our post.
Good Luck !!!

Why is gold fluctuating in futures towards the target of 5120?Since 1975, with the increasing decline in the value of the world's most worthless currency, the dollar, all holders of this worthless fiat have been facing losses day by day against a valuable peak in physical assets!
Currently, the dollar is proud to be at the peak of worthlessness with rulers with a brilliant record of abusing children and girls at a very young age, even less than 5 years old, for sexual slavery, and every day, the yellow pumpkin head with a flat stomach the color of its own impurity, with a speechless tongue, is showing the consequences of accompanying these impurities and its fellow cups.
What makes us think is at what moment in history this swamp will drown all its companions forever. With the hope that this will happen soon!!
Good luck
