EURJPY top-down analysisHello traders, this is the full breakdown of this pair. We will take this trade if all the conditions are satisfied as discussed in the analysis. Smash the like button if you find value in this analysis and drop a comment if you have any questions or let me know which pair to cover in my next analysis.
Fxanalysis


EURJPY top-down analysisHello traders, this is the full breakdown of this pair. We will take this trade if all the conditions are satisfied as discussed in the analysis. Smash the like button if you find value in this analysis and drop a comment if you have any questions or let me know which pair to cover in my next analysis.

Usdcad prediction It’s been awhile I traded usdcad but I felt the current structure I’m seeing might be useful. Let’s see how things will go on it.

USDCNH top-down analysisHello traders, this is the full breakdown of this pair. We will take this trade if all the conditions are satisfied as discussed in the analysis. Smash the like button if you find value in this analysis and drop a comment if you have any questions or let me know which pair to cover in my next analysis.

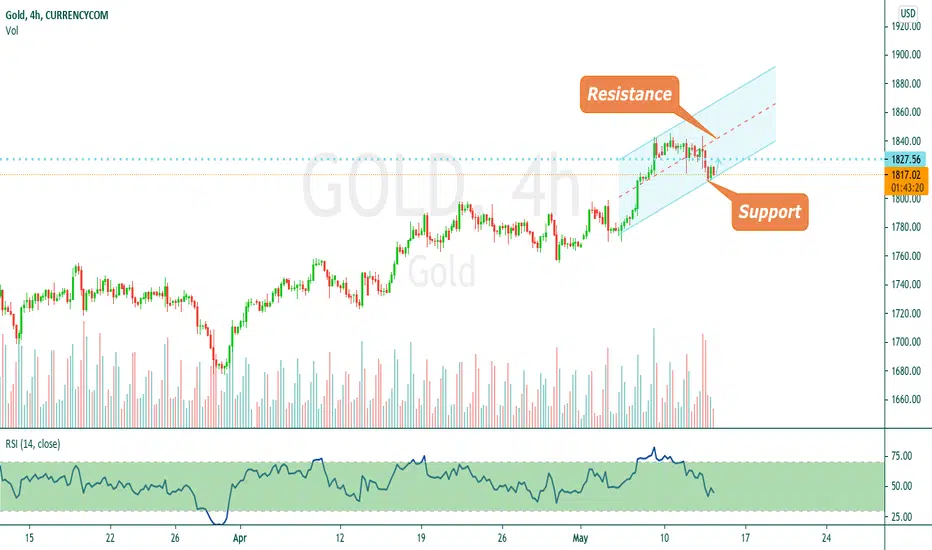
GOLD - DAY TRADE VIEWGOLD - As per the price action, trend lines , & technical indicators gold is expected to go up from the current price.
My approach will be a buy in the range 1815-1817
Potential upside target 1825-1828
Maintain stop loss around 1807
Trade as per your risk appetite, I will be glad to see your likes & comment.
Ripple Sell off Ripple Heading towards 0.80300 Bearish wait for pull back to stop and then you look too short it to 0.80300 to clear the original consolidation

CADJPY H4 - Long Trade SetupCADJPY H4
So evident we saw GBP, AUD and NZD correct negatively last week with month end flows, and subsequently CHF, USD and YEN corrected/balanced positively. ***YEN pairs are still on the backfoot as we approach retest areas, keen to see how these pairs develop.
Looking for a double bottom or second retest of that 83.700 price to try and get involved long with this pair.

GOLD - DAY TRADE VIEWGOLD - As per the price action, trend lines , & technical indicators gold is expected to go up from the current price.
My approach will be a buy here at current price 1873
Potential upside target 1884
Maintain stop loss around 1864
Trade as per your risk appetite, I will be glad to see your likes & comment .
Why you should follow this tradingview account ?
Managed by top most renowned trader - Pulak Priyesh
10 + years of trading experience
Professional Day trader
Excellence award winning mentor
Professional chart, clear chart without junks.
Major S/R levels with inner insights
Frequent Day & Swing trade levels
All major and minor FX/INDICES covered. Thanks

GBPUSD - LONG - TARGET 1.3300 TO 1.34000IN MY VIEW GBP IS BULLISH - GBPUSD - DAILY TREND LINE RESISTANCE - AND TARGET

EURAUD Big PictureHello, Friends!
I've been trading EURAUD for the past few months and has netted consistent profits. This is the large picture of EURAUD.
Technicals, Technicals, Technicals.
1. We are still in an upwards weekly channel with a strong support and strong bounce off of it.
2. We are still creating higher highs.
3. RSI still in the buyzone with another week or two of buying.
The market moves in waves. I expect price to close at 1.6600 area then ready for a retrace before the next push up into 1.6800 zone.
Good luck trading! Please help like these free analysis as others will benefit from seeing them as well.
Let me know how I can help.
Charles V
www.cvfxmanagement.com
Trading made Simple


EUE/NZD Shorting 2 optionsWhat do u think about shorting Eur/Nzd. It looks like it will fall back to support levels. What do u think?

CADCHF SHORT CADCHF SHORT POSITION 24 pips TP RRR= 2,74 SL 8,7 pips Let me know what do you think . SIMPLE TRADING= PROFITABLE TRADING


EURUSD Bear signal down to 1.09, 20+Month bear channelEURUSD has been in a strong bear channel, nearly 2 years straight. A lot of its due to the ECB monetary policy that has an extremely dovish tone, which puts downside pressure on the Euro. On a technical basis on the weekly chart we got a really strong reversal at the top of the channel at 1.117 and a recent broken low that was tested and held really well by the bears at 1.109 with a long wicked candle that closed the week bearish and identified a higher probability short down to a new low.
The target to the downside is the GAP start from April 2017 at 1.073.
Disclaimer: This is not trading or investment advice, this is analysis used for educational purposes only.

GBPUSD Long (Algorithmic)Our Trend Smart Algorithm predicted a short term analysis for GBPUSD to go Long.

So We are start to getting structure...#GOLD #Update The day close with a doji candle and in the 4H charts we have a consolidation since $1328.00 to the $320.00 zone and also its making support in the moving average (blue). We need to wait for a break of the consolidation for any entry with around 100 PIPs.

USDCHF Harmonic Pattern AnalysisWe are predicting if the pair to breaks the yellow trend line it will form and complete the 4th leg of the pattern. FX:USDCHF


GBPUSD / 60m / Bearish GartleyFX Analysis (2017-7-24)
Trading Tips:
Short term counter trend trading opportunity.
We have a Bearish Gartley completion right near previous structure resistance. However, this is against our the trend on 240min chart, thus we only look for a 382 retracement (618 for TP#2).

AUDCAD/ 15m / Flag BOFX Analysis (2017-7-21)
AUDCAD just broke a minor structure support on 15min chart and retested the BO line followed by another Flag BO.
We entered at the Flag BO. TP#1 @0.9890
