EURJPY Reaction Zone AheadOANDA:EURJPY is showing signs of weakness after a strong rally.
The pair is now approaching a key support zone, which also aligns with an unfilled gap.
A retest of this area could attract buyers, but if it fails to hold, we might see a deeper pullback in the short term.
DYOR, NFA
Fxsignals

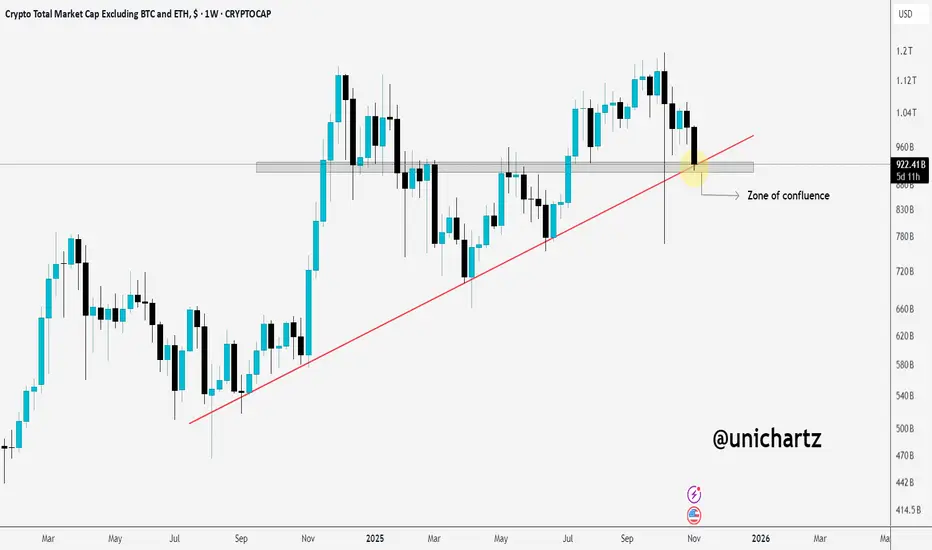
Altcoins at a Turning Point, Can Bulls Defend This Level?Altcoins are currently hovering at a critical zone of confluence, where horizontal support meets the rising trendline. A strong bounce from here could revive bullish momentum, but a breakdown below this level might open the door for deeper corrections.
This is a make-or-break area for the broader altcoin market.
Stay alert.
NFA
USDT.D Eyeing Resistance, Altcoin Holders Stay Alert!USDT.D is trading right at the edge of a breakout near the resistance zone. If it manages to break above, we could see another sharp drop in altcoins in the coming days.
However, a rejection here might give altcoins some much-needed breathing room.
DYOR, NFA
#PEACE

ETH Weakening Near Support, Big Move Loading?CRYPTOCAP:ETH is currently trading near a key support zone, which has held strong multiple times in the past. The price has been consolidating between this support and the mid S/R zone, showing that both bulls and bears are battling for control.
If ETH manages to break and sustain above the mid S/R zone, we could see a potential upside continuation toward higher levels. However, if the price fails to hold this key support and closes below it, a deeper correction toward the lower support zone could be on the table.
For now, ETH looks weaker day by day, so it’s important to keep a close eye on how the price reacts around this zone, a decisive move could set the tone for the next big trend.
DYOR, NFA

Strong Recovery, Key Level Ahead $TRUMPAfter the recent crash, $TRUMP/USDT has made a strong comeback, recovering sharply from the bottom with solid momentum.
On the daily timeframe, the price has successfully broken above the key resistance trendline, showing clear bullish intent. However, it’s now testing a major resistance on the weekly chart.
If the price manages to break and close above this weekly resistance trendline, it could trigger an explosive upside move for TRUMP.
DYOR, NFA
Thanks for reading! Appreciate your support and engagement 🙏

ETH: Range-Bound, But Breakdown Could Get UglyOn the CRYPTOCAP:ETH daily chart, the mid-zone is acting as a clear barrier. The price is currently consolidating within a range, caught between the key support zone and this mid S/R zone.
A breakout above could trigger a strong move higher, while a breakdown here would be a scary scenario for the overall market.
DYOR, NFA
Thanks for reading! Appreciate your support and engagement 🙏

BTC: Hold Here or Drop to 104K?CRYPTOCAP:BTC is currently retesting a crucial zone after facing rejection from the recent resistance area.
This “important zone” around $111K–$110K will likely decide the next move, a strong hold here could trigger a bounce back toward the highs, while a breakdown below it might open the doors toward $108K or even $104K.
In short — this is a key make-or-break level. Keep a close eye on how the daily candle closes here.
DYOR, NFA
#BTCUSDT #unichartz

TAO Could Explode if This Zone BreaksBINANCE:TAOUSDT has been repeatedly testing the resistance zone and is now making another strong attempt with solid momentum.
If the price manages to break and close above this zone, it could trigger a massive upside move. Keep a close eye, momentum is building up fast.
DYOR, NFA

ETH Support Holding, But Cracks ShowingAs long as CRYPTOCAP:ETH holds the key support zone, the overall structure remains bullish and there’s nothing to worry about.
However, the technical setup is starting to weaken, a break below this support could turn things ugly, especially for altcoins.
DYOR, NFA
#PEACE
Thanks for reading! Appreciate your support and engagement 🙏

HYPE/USDT Price Heating UpGETTEX:HYPE is showing a nice bounce from the key support zone, holding that area quite well. The price is now approaching a minor resistance around the trendline.
If it manages to break and close above this line, we could see a strong upside move in the coming sessions.
DYOR, NFA
PEACE

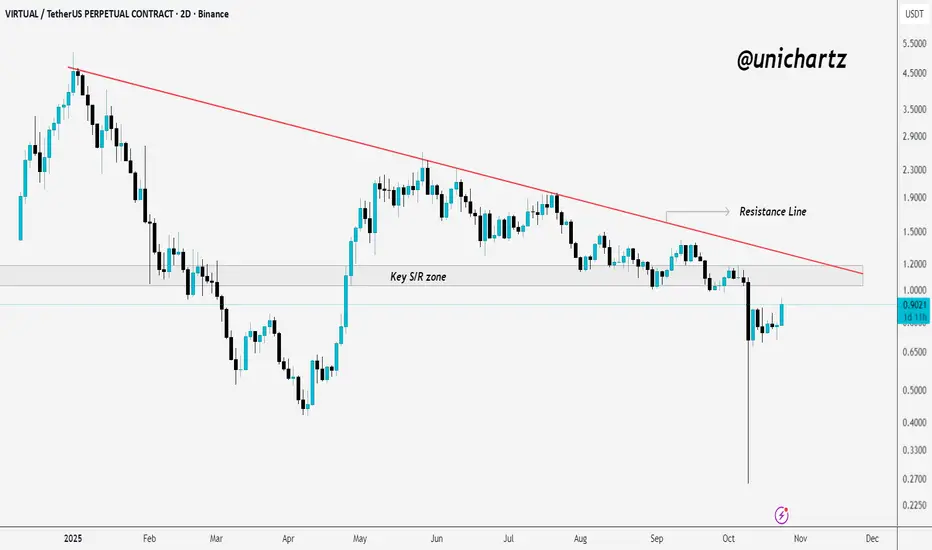
VIRTUAL Rebounds Strongly but Faces Key ResistanceSPARKS:VIRTUAL has rebounded strongly from the bottom after the recent drop but is still trading below the resistance zone, which once acted as key support.
A breakout and close above this zone could signal a shift in momentum and open the way for further upside, while rejection here might lead to a short-term pullback.
DYOR, NFA
DXY Forming a Strong Base – Reversal Ahead?U.S. Dollar Index TVC:DXY – Daily Analysis
After a long downtrend, the Dollar Index seems to be forming a strong base at the bottom, as highlighted by multiple bounces from the same support zone. This area has been acting as a reliable floor, preventing further downside.
Currently, the price has also broken above the descending trendline, showing early signs of strength. If the price holds above this breakout, we could see a move toward the 100–101 zone, which is the next key resistance area.
However, if the price dips back below the trendline, a retest of the base zone near 97.00 could take place before any potential continuation higher.
Summary: DXY is showing a potential reversal structure. A sustained move above the trendline could confirm the start of a stronger bullish phase.
DYOR, NFA
Thanks for reading! Appreciate your support and engagement 🙏

USDT.D Breaks Out, Altcoin Correction Ahead?USDT.D has broken above the resistance trendline and is now forming higher highs and higher lows, a clear sign of a bullish structure shift.
If the price breaks above the next resistance, we could see more correction across altcoins.
Keep an eye on USDT.D and stay tuned for further updates.
DYOR, NFA

ETH Consolidating Before the Next Move$ETH/USDT has been trading sideways for the past 74 days, holding strong at the confluence of the rising trendline and key support zone. This prolonged consolidation suggests that both buyers and sellers are in a state of equilibrium, waiting for a decisive move.
A breakout on either side could set the tone for the next major trend. If ETH manages to hold this support and gain momentum, we might see a strong recovery toward the upper resistance levels.
However, if it loses this zone, a deeper correction could follow before any significant upside move.
DYOR, NFA
PEACE

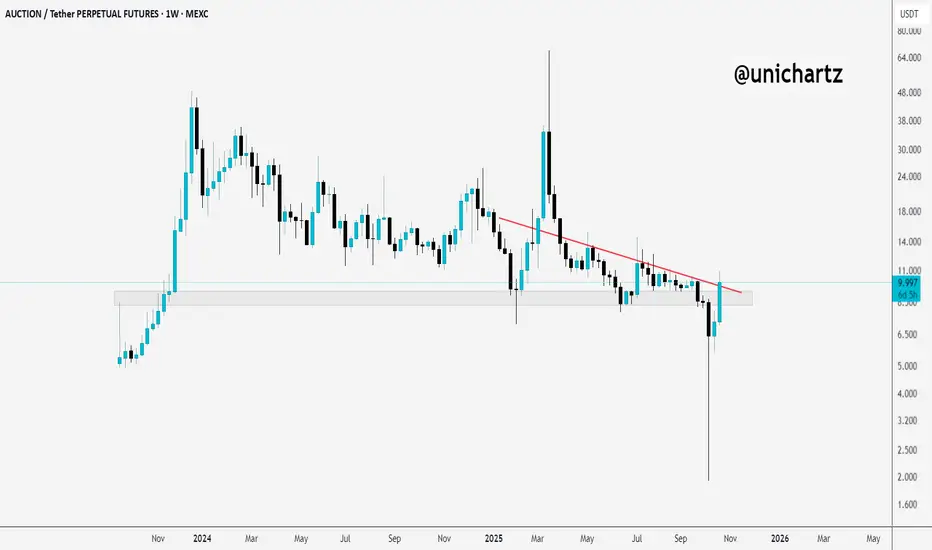
AUCTION Reclaiming StrengthAuction/USDT Analysis:
After the recent crash, $AUCTION has successfully reclaimed its support zone with strong momentum. The price has also broken above a key resistance line, a positive sign.
If it manages to close and sustain above this level, we could see a potential upside move in the coming days.
Keep an eye on the candle close and add it to your watchlist.
DYOR, NFA
#PEACE
Gold Healthy PullbackGold is taking a short breather after a strong rally. Price recently tapped near the $4,230 zone before showing its first meaningful pullback in days.
The 33 EMA (pink line) is acting as dynamic support, if the price holds above it, we could see another leg higher toward the $4,280–$4,320 range. However, if that level breaks cleanly, the next strong demand sits around $4,020, where both the 100 EMA and previous accumulation zone align.
In simple terms, this is a healthy correction within a bullish trend. A bounce from either the 33 EMA or 100 EMA could easily trigger the next push upward.

Bitcoin Eyeing $108K ZoneCRYPTOCAP:BTC Daily Chart Analysis
Bitcoin is currently trading around $110,300, showing weakness after failing to hold higher levels. The market structure still looks corrective, and we can see price slowly drifting toward the nearest support zone around $108,000–$109,000.
If this zone holds, we might see a short-term bounce or relief rally. But if the market breaks below $108,000, the next major demand area lies near $104,000–$100,000, where buyers are likely waiting.
For now, the key is to watch how price reacts at this support. A strong bounce could confirm accumulation, while a breakdown might trigger deeper correction before any new bullish leg.
DYOR, NFA

Altseason on the Horizon?Technically, BTC Dominance has retested the breakdown of the rising channel, confirming a clean rejection from the retest area.
If price manages to break below the current support zone, we could see a strong shift toward altcoins as capital starts rotating out of BTC.
This recent move also flushed out over-leveraged traders, resetting market positioning, a healthy sign before the next major leg.
Stay patient and always analyze your risk before entering any position. The next few weeks could be decisive for the altcoin market.
DYOR, NFA
Stay tuned for more update
THANKS FOR THE READING
#PEACE

EUR/USD 4HR Trendline Breakout. Daily Continuation.I will be taking a long trade looking for further upside.
Trade management will be trailing stop loss below 4HR lows when I feel appropriate to do so based on my discretion.
Simple effective trading.

Rebound in Motion: XLM Eyes Channel Top AgainCRYPTOCAP:XLM has bounced strongly from the lower trendline and re-entered the channel.
This move shows clear buyer strength and a potential shift in short-term momentum. As long as XLM holds within the channel, a retest of the upper boundary looks likely.

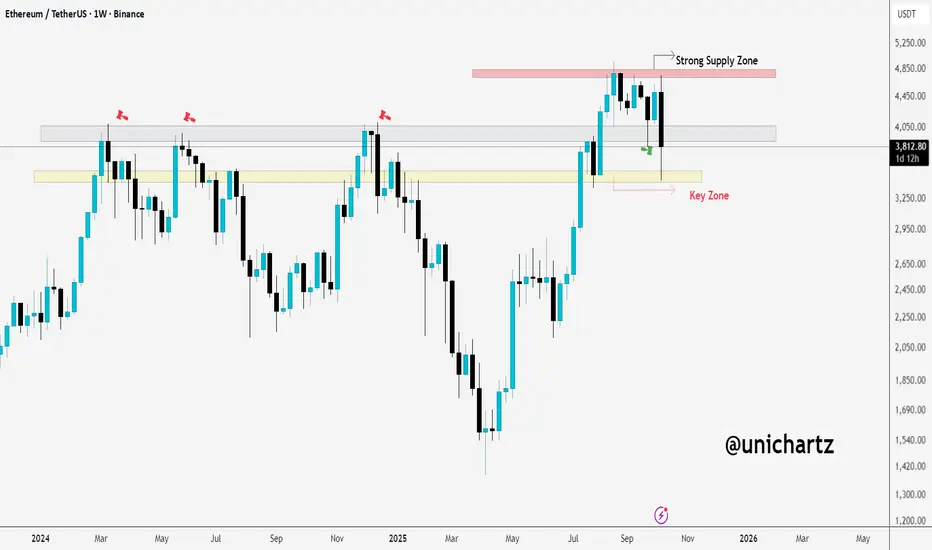
ETH in Danger: Breaking Below $3,200 Could Signal Bigger DropCRYPTOCAP:ETH is facing rejection from the strong supply zone around $4,800. The weekly candle failed to hold above that level and is now pulling back towards the key demand zone between $3,200–$3,300.
If the price fails to reclaim this support, we could see a more bearish scenario unfolding.
DYOR, NFA
Thanks for the reading
ETH at Critical Support: Can $3,850 Hold?CRYPTOCAP:ETH has faced a sharp rejection from the supply zone around $4,800 and is currently trading near $4,100. There's another strong support zone around $3,850.
I'm personally expecting a sharp rebound from this level. However, if the price fails to hold, we could see a further decline towards $3,600.
DYOR, NFA

BTC Dominance: Key Levels to WatchAfter the recent correction, BTC dominance is bouncing from the support zone at 59.64%. It looks like BTC dominance will likely retest the nearest resistance zone before any further downside.
If BTC.D breaks above this resistance, we could see more pressure on altcoins.
However, a rejection from this resistance zone could signal some relief for altcoins, giving them a chance to recover.
#PEACE
THANKS for the Read
