BTC Eyes 120K but 115K Support is the Last LineCRYPTOCAP:BTC is currently trading around 116K after a strong run-up. The chart shows a rising wedge pattern forming, with immediate support sitting near 115K. If this level holds, BTC could make another push toward the upper resistance zone around 120K.
On the flip side, a breakdown below 115K may trigger a short-term correction, sending price lower before bulls step back in.
Overall, BTC is in a critical zone, holding support keeps the bullish momentum alive, but a rejection at resistance could slow things down.
DYOR, NFA
Stay tuned for more update
Fxtrading

One Push Away From Lift-Off, BB Breakout Setup$BB/USDT is right at a crucial confluence zone where the downtrend resistance and horizontal supply overlap. Buyers have been pushing price higher, but this area is acting as a real test.
If BB manages to break and close above this zone with strength, it could fuel a strong rally as momentum shifts in favor of the bulls. On the other hand, failure to clear this resistance might lead to another rejection, keeping price stuck in the range.
In simple words: this is the make-or-break moment, watch closely for a breakout confirmation before calling the next big move.

ETHFI Next Leg Could Deliver 200%+CRYPTOCAP:ETHFI has broken out of its bull flag pattern and cleared the key resistance trendline. This breakout signals a shift in momentum, showing that buyers are stepping back in with strength.
The structure looks constructive as long as price holds above the breakout zone, opening the door for a potential continuation move to the upside. Sustained momentum here could mark the beginning of a broader bullish leg.
In simple terms: ETHFI just confirmed a breakout, and holding above resistance keeps the bulls in control.
DYOR, NFA
Stay tuned for more updates
#PEACE

EIGEN Breakout Confirmation, Eyes on 2.20+$EIGEN has broken above a key resistance zone, signaling a shift in momentum. The breakout comes after weeks of consolidation with strong support holding at the ascending trendline.
Trade Setup
Entry: Around current breakout levels
Stop Loss: Below 1.33 (trendline support)
Targets:
TP1: 2.20
TP2: 2.86
TP3: 3.78
TP4: 5.27
As long as price holds above the reclaimed zone, the structure favors bulls with upside targets in play.
DYOR, NFA
#PEACE

Quant Facing the Wall of SellersGETTEX:QNT is still respecting its long-term resistance line. Every time price has tried to break above it, sellers have stepped in, keeping the structure bearish.
Right now, QNT is holding above a key zone that has acted as strong support in the past. If buyers can defend this level and push back toward resistance, we could see another test of the upper line.
In short: support is holding, resistance is heavy, the real move comes only if QNT can finally break through that long-term resistance line.
DYOR, NFA
Stay tuned for more update!

Same Setup, Bigger Boom Incoming?The price action here is telling a clear story. Every time LSE:MYX spends time moving sideways, quietly accumulating in a range, it eventually launches into a powerful breakout. We can see it happened once, then again — each consolidation phase built up energy, and when that energy released, the market ripped higher.
Right now, the same pattern looks to be repeating. Price is sitting inside a tight range once again, showing signs of healthy consolidation. If history is any guide, this could be the calm before another explosive move.
Accumulation → Boom.
Accumulation → Boom.
And now…? The setup looks like it’s preparing for the next chapter.
DYOR, NFA
#PEACE
Stay tuned for more update

AVAX is Winding Up for a Monster MoveAVAX has been trading inside a large wedge pattern, where price is getting squeezed between a key descending resistance line on the top and a key ascending support line on the bottom. Every touch on these trendlines has triggered strong reactions, showing how important they are for market participants.
Right now, AVAX is holding above its ascending support, which has acted as a solid foundation multiple times in the past. If price manages to push higher and break above the descending resistance, it could unlock strong upside momentum and shift sentiment more bullish. On the other hand, if it fails to sustain this support, we could see another retest of the lower zone before any major move.
Overall, the structure is tightening, and a big breakout looks closer with each passing week.
#PEACE
Follow for more updates like this
THANKS

Breakout Above Resistance Could Fuel Strong Rally$MAGIC/USDT has been moving inside a clear structure where buyers and sellers are battling for control.
The major resistance line above has acted as a strong barrier multiple times, and a clean breakout here could open the door for a much stronger bullish move.
On the flip side, the ascending support line has been holding well, showing steady higher lows and signaling that buyers are still active. The mid support–resistance zone has also been a key pivot area, with price bouncing off it several times.
As long as price continues to respect this support and manages to push through the resistance trendline, the bias remains bullish.
If it fails to hold the support, though, the structure weakens and further downside becomes possible.
More updates coming soon, stay tuned.
DYOR, NFA

AUDJPY; Heikin Ashi Trade IdeaIn this post, I’ll be sharing my analysis of AUDJPY with my unique Heikin Ashi strategy.Picture tells more than 1000 words, no BS. I highlight key areas where I’m anticipating potential opportunities.
I’m always happy to receive any feedback.
Like, share and comment! ❤️
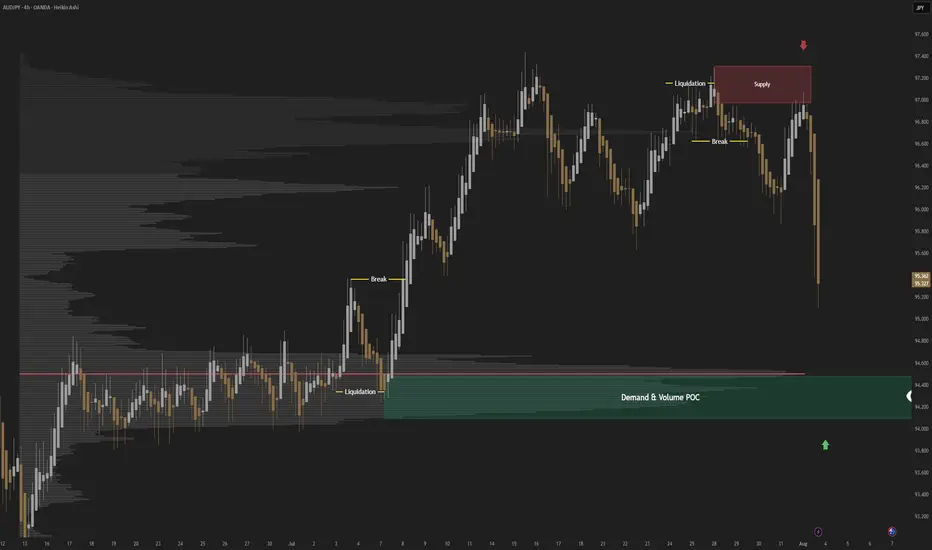
AUDJPY; Heikin Ashi Trade Idea📈 Hey Traders!
Here’s a fresh outlook from my trading desk. If you’ve been following me for a while, you already know my approach:
🧩 I trade Supply & Demand zones using Heikin Ashi chart on the 4H timeframe.
🧠 I keep it mechanical and clean — no messy charts, no guessing games.
❌ No trendlines, no fixed sessions, no patterns, no indicator overload.
❌ No overanalyzing market structure or imbalances.
❌ No scalping, and no need to be glued to the screen.
✅ I trade exclusively with limit orders, so it’s more of a set-and-forget style.
✅ This means more freedom, less screen time, and a focus on quality setups.
✅ Just a simplified, structured plan and a calm mindset.
💬 Let’s Talk:
💡Do you trade supply & demand too ?
💡What’s your go-to timeframe ?
💡Ever tried Heikin Ashi ?
📩 Got questions about my strategy or setup? Drop them below — ask me anything, I’m here to share.
Let’s grow together and keep it simple. 👊

NZDUSD to see a temporary move higher<NZDUSD - 24h expiry
There is no clear indication that the downward move is coming to an end.
Although we remain bearish overall, a correction is possible without impacting the trend lower.
Risk/Reward would be poor to call a sell from current levels.
A move through 0.5800 will confirm the bearish momentum.
The measured move target is 0.5860.
We look to Sell at 0.5850 (stop at 0.5880)
Our profit targets will be 0.5775 and 0.5760
Resistance: 0.5850 / 0.5860 / 0.5875
Support: 0.5800 / 0.5775 / 0.5760
Risk Disclaimer
The trade ideas beyond this page are for informational purposes only and do not constitute investment advice or a solicitation to trade. This information is provided by Signal Centre, a third-party unaffiliated with OANDA, and is intended for general circulation only. OANDA does not guarantee the accuracy of this information and assumes no responsibilities for the information provided by the third party. The information does not take into account the specific investment objectives, financial situation, or particular needs of any particular person. You should take into account your specific investment objectives, financial situation, and particular needs before making a commitment to trade, including seeking, under a separate engagement, as you deem fit.
You accept that you assume all risks in independently viewing the contents and selecting a chosen strategy.
Where the research is distributed in Singapore to a person who is not an Accredited Investor, Expert Investor or an Institutional Investor, Oanda Asia Pacific Pte Ltd (“OAP“) accepts legal responsibility for the contents of the report to such persons only to the extent required by law. Singapore customers should contact OAP at 6579 8289 for matters arising from, or in connection with, the information/research distributed.

GBP/USD – VSA Signals Supply Emerging at 4H Resistance💡 Idea:
GBP/USD recently tested the 1.37–1.3750 resistance zone and showed clear supply signals in VSA terms. The price is rolling over with wide down-bars on increasing volume, confirming professional selling pressure. The pair is likely entering a markdown phase toward deeper 4H support levels.
📍 Trade Setup
Entry: 1.3470–1.3500 (pullback into broken support / minor supply test)
Stop Loss: 1.3575 (above last supply zone)
Target 1: 1.3340 (next 4H support)
Target 2: 1.3180 (major 4H support base)
R:R Ratio: ~1:3
📊 VSA & Technical Reasoning
Supply Bar at Resistance
At 1.37+, wide spread down-bars closed near the lows on ultra-high volume → classical VSA supply bar, confirming professional selling.
Upthrust / Trap Move
The wick above resistance acted as an Upthrust, luring breakout buyers before reversing sharply — a typical Wyckoff distribution signature.
No Demand Rally
Recent small up-bars into resistance came with narrow spread + low volume, showing lack of demand and confirming sellers are in control.
Lower Highs + Breakdown
Market structure has shifted into a downtrend sequence (lower highs & lower lows) aligning with VSA weakness.
Volume Confirmation
Volume on down-bars remains elevated vs. up-bars, validating that supply > demand. This suggests further downside continuation.
📌 Trading Plan
Look to short retracements into 1.3470–1.3500.
Expect price to break 1.34 support on increased supply.
Trail stop aggressively once 1.3340 is tested, targeting 1.3180 as the larger markdown objective.

Quick Forex update. Waiting for the Powell speech.Let's have a quick technical look at the top FX pairs before the Jackson Hole Symposium. Let's dig in.
TVC:DXY
FX_IDC:AUDUSD
FX_IDC:NZDUSD
FX_IDC:USDJPY
FX_IDC:USDCAD
Let us know what you think in the comments below.
Thank you.
75.2% of retail investor accounts lose money when trading CFDs with this provider. You should consider whether you understand how CFDs work and whether you can afford to take the high risk of losing your money. Past performance is not necessarily indicative of future results. The value of investments may fall as well as rise and the investor may not get back the amount initially invested. This content is not intended for nor applicable to residents of the UK. Cryptocurrency CFDs and spread bets are restricted in the UK for all retail clients.

Bearish Shark EUR/NZDLooking at a potential Bearish Shark forming on the EURNZD. I'm seeing divergence, but anticipate a bullish move up towards 1.975. I've placed a couple short limits at 1.975 and 1.98, but will short the market if I see a signal on the lower timeframes.

XAU/USD Technical Outlook for the upcoming week In this video I look at the current PA of gold using TPO chart and correlate a plan for where we could see price go in the coming week .
I use a regular chart and TPO chart for this analysis as well as Fibonacci tools .
We are currently in the middle of a range and until that range is broken we plan ahead and seek the best high probability setup via looking at the charts and correlating with the News catalysts.

NZDUSD; Heikin Ashi Trade Idea📈 Hey Traders!
Here’s a fresh outlook from my trading desk. If you’ve been following me for a while, you already know my approach:
🧩 I trade Supply & Demand zones using Heikin Ashi chart on the 4H timeframe.
🧠 I keep it mechanical and clean — no messy charts, no guessing games.
❌ No trendlines, no fixed sessions, no patterns, no indicator overload.
❌ No overanalyzing market structure or imbalances.
❌ No scalping, and no need to be glued to the screen.
✅ I trade exclusively with limit orders, so it’s more of a set-and-forget style.
✅ This means more freedom, less screen time, and a focus on quality setups.
✅ Just a simplified, structured plan and a calm mindset.
💬 Let’s Talk:
💡Do you trade supply & demand too ?
💡What’s your go-to timeframe ?
💡Ever tried Heikin Ashi ?
📩 Got questions about my strategy or setup? Drop them below — ask me anything, I’m here to share.
Let’s grow together and keep it simple. 👊

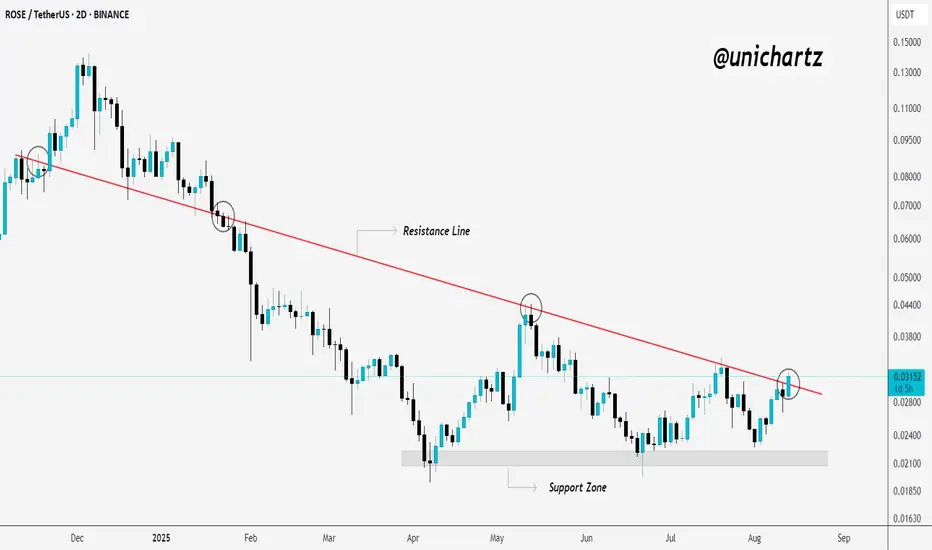
Triple Bottom Power – ROSE Eyes Explosive Upside!$ROSE/USDT has formed a triple bottom pattern, signaling strong buying interest at the support zone. Price is now testing the key descending resistance line.
If it manages to close decisively above this level, we could see a strong upside move.
Until then, keep it on your watchlist and monitor closely for a breakout confirmation.
DYOR, NFA
GBPJPY; Heikin Ashi Trade Idea📈 Hey Traders!
Here’s a fresh outlook from my trading desk. If you’ve been following me for a while, you already know my approach:
🧩 I trade Supply & Demand zones using Heikin Ashi chart on the 4H timeframe.
🧠 I keep it mechanical and clean — no messy charts, no guessing games.
❌ No trendlines, no fixed sessions, no patterns, no indicator overload.
❌ No overanalyzing market structure or imbalances.
❌ No scalping, and no need to be glued to the screen.
✅ I trade exclusively with limit orders, so it’s more of a set-and-forget style.
✅ This means more freedom, less screen time, and a focus on quality setups.
✅ Just a simplified, structured plan and a calm mindset.
💬 Let’s Talk:
💡Do you trade supply & demand too ?
💡What’s your go-to timeframe ?
💡Ever tried Heikin Ashi ?
📩 Got questions about my strategy or setup? Drop them below — ask me anything, I’m here to share.
Let’s grow together and keep it simple. 👊

$HBAR Is Loading… $0.30 Next?CRYPTOCAP:HBAR has turned its key resistance into support, showing a strong shift in market structure. After reclaiming this level, price has been holding steady above it, supported by the 100 EMA.
As long as bulls defend this zone, the next upside target could be the $0.30 area and beyond.
A clean breakout above that level could open the door for further gains.
DYOR, NFA

EURUSD; Heikin Ashi Trade Idea📈 Hey Traders!
Here’s a fresh outlook from my trading desk. If you’ve been following me for a while, you already know my approach:
🧩 I trade Supply & Demand zones using Heikin Ashi chart on the 4H timeframe.
🧠 I keep it mechanical and clean — no messy charts, no guessing games.
❌ No trendlines, no fixed sessions, no patterns, no indicator overload.
❌ No overanalyzing market structure or imbalances.
❌ No scalping, and no need to be glued to the screen.
✅ I trade exclusively with limit orders, so it’s more of a set-and-forget style.
✅ This means more freedom, less screen time, and a focus on quality setups.
✅ Just a simplified, structured plan and a calm mindset.
💬 Let’s Talk:
💡Do you trade supply & demand too ?
💡What’s your go-to timeframe ?
💡Ever tried Heikin Ashi ?
📩 Got questions about my strategy or setup? Drop them below — ask me anything, I’m here to share.
Let’s grow together and keep it simple. 👊

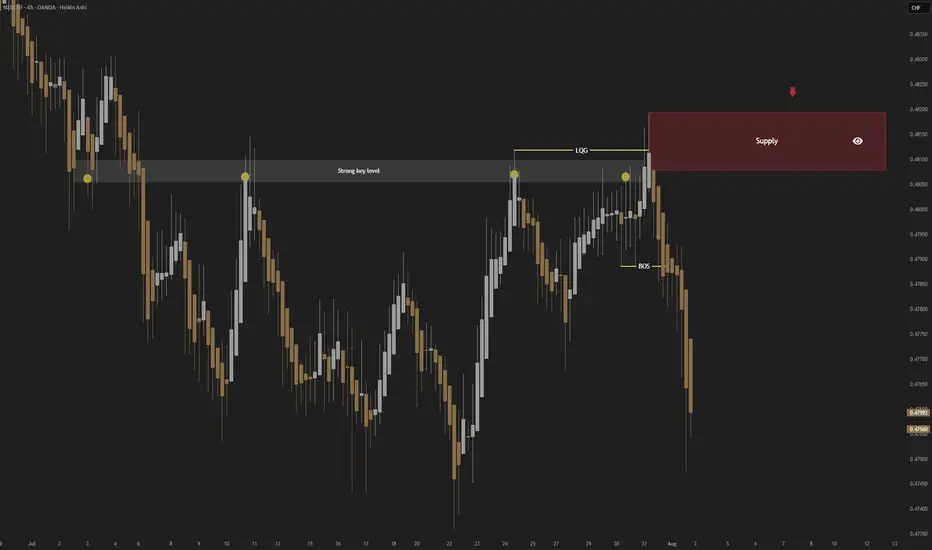
NZDCHF; Heikin Ashi Trade Idea📈 Hey Traders!
Here’s a fresh outlook from my trading desk. If you’ve been following me for a while, you already know my approach:
🧩 I trade Supply & Demand zones using Heikin Ashi chart on the 4H timeframe.
🧠 I keep it mechanical and clean — no messy charts, no guessing games.
❌ No trendlines, no fixed sessions, no patterns, no indicator overload.
❌ No overanalyzing market structure or imbalances.
❌ No scalping, and no need to be glued to the screen.
✅ I trade exclusively with limit orders, so it’s more of a set-and-forget style.
✅ This means more freedom, less screen time, and a focus on quality setups.
✅ Just a simplified, structured plan and a calm mindset.
💬 Let’s Talk:
💡 Do you trade supply & demand too ?
💡What’s your go-to timeframe ?
💡Ever tried Heikin Ashi ?
📩 Got questions about my strategy or setup? Drop them below — ask me anything, I’m here to share.
Let’s grow together and keep it simple. 👊
GBPUSD DAILY ANALYSISOn the daily timeframe, GU is currently bearish but right now, it is retracing to a bearish FVG, and i think it wants to complete a 50% fib retracement level before it continues to the downside.
i am expecting my first point of engagement with the market shorts to be at level 1.33662, if that level fails, i will try shorting at 1.34533 and at 1.35308...
