XAUUSD 2H – Breakout + Retest Play | Liquidity Target ModelFOREXCOM:XAUUSD
Gold is currently testing a major descending trendline that has acted as rejection multiple times. A confirmed break and hold above 4,175 would signal bullish continuation toward upper liquidity.
If price rejects, deeper retracement into the 4,093–4,050 BEST ENTRY DEMAND ZONE remains valid for continuation.
Key Scenarios
✅ Bullish Case (Primary Setup)
Confirm breakout and hold above 4,175
→ 🎯 Target 1: 4,230
→ 🎯 Target 2: 4,288–4,300 liquidity target
📌 Alternative Buy:
If no breakout → wait for discount entry at 4,093–4,050 demand box.
❌ Invalidation:
Break and close below 4,025 removes bullish structure.
Current Levels to Watch
Support: 4,093–4,050 / 4,025
Resistance: 4,175 / 4,230 / 4,288–4,300
⚠️ This analysis is for educational purposes only — not financial advice.
Gann

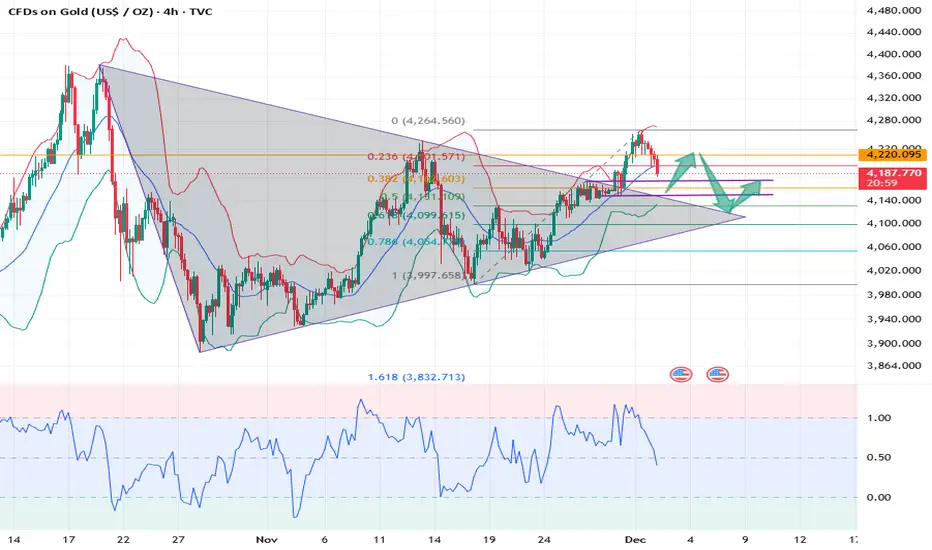
XAUUSD: Market Analysis and Strategy for December 2ndGold Technical Analysis:
Daily Resistance: 4330, Support: 4131
4-Hour Resistance: 4220, Support: 4150
1-Hour Resistance: 4210, Support: 4175
Yesterday, the gold market exhibited significant volatility. Gold prices surged, reaching a high of around 4264, demonstrating strong upward momentum. However, upon entering the New York session, the market sentiment shifted dramatically, and gold prices began to fluctuate and decline. The 4-hour chart shows that gold has successfully broken out of a clear symmetrical triangle pattern, a breakout signal indicating a continuation of the bullish trend. Although momentum has improved after the breakout, the RSI indicator remains in overbought territory around 65, making chasing the price higher risky in the short term. The short-term battleground between bulls and bears is around 4200.
Trading Strategy:
SELL: 4200near
SELL: 4210near
SELL: 4225near
More Analysis →
EURUSD FRGNT Daily Forecast - Q4 | W49| D2| Y25 |📅 Q4 | W49| D2| Y25 |
📊 EURUSD FRGNT Daily Forecast
🔍 Analysis Approach:
I’m applying Smart Money Concepts, focusing on:
Identifying Points of Interest on the Higher Time Frames (HTFs) 🕰️
Using those POIs to define a clear trading range 📐
Refining those zones on Lower Time Frames (LTFs) 🔎
Waiting for a Break of Structure (BoS) for confirmation ✅
This method allows me to stay precise, disciplined, and aligned with the market narrative, rather than chasing price.
💡 My Motto:
"Capital management, discipline, and consistency in your trading edge."
A positive risk-to-reward ratio, paired with a high win rate, is the backbone of any solid trading plan 📈🔐
⚠️ Losses?
They’re part of the mathematical game of trading 🎲
They don’t define you — they’re necessary, they happen, and we move forward 📊➡️
🙏 I appreciate you taking the time to review my Daily Forecast.
Stay sharp, stay consistent, and protect your capital
— FRNGT 🚀
FX:GBPUSD

GBPUSD FRGNT Daily Forecast - Q4 | W49 | D2 | Y25 |📅 Q4 | W49| D2| Y25 |
📊 GBPUSD FRGNT Daily Forecast
🔍 Analysis Approach:
I’m applying Smart Money Concepts, focusing on:
Identifying Points of Interest on the Higher Time Frames (HTFs) 🕰️
Using those POIs to define a clear trading range 📐
Refining those zones on Lower Time Frames (LTFs) 🔎
Waiting for a Break of Structure (BoS) for confirmation ✅
This method allows me to stay precise, disciplined, and aligned with the market narrative, rather than chasing price.
💡 My Motto:
"Capital management, discipline, and consistency in your trading edge."
A positive risk-to-reward ratio, paired with a high win rate, is the backbone of any solid trading plan 📈🔐
⚠️ Losses?
They’re part of the mathematical game of trading 🎲
They don’t define you — they’re necessary, they happen, and we move forward 📊➡️
🙏 I appreciate you taking the time to review my Daily Forecast.
Stay sharp, stay consistent, and protect your capital
— FRNGT 🚀
FX:GBPUSD

Global Market ParticipantsIntroduction
Global financial markets are vast, interconnected systems where capital flows across borders in search of returns. These markets are populated by a diverse set of participants, each with unique objectives, strategies, and resources. Understanding the various players in these markets is essential for analyzing market dynamics, price movements, and risk management. Global market participants can range from individual retail investors to massive institutional investors and sovereign entities. Their interactions determine liquidity, volatility, and the overall efficiency of the markets.
Types of Global Market Participants
Global market participants can be broadly classified into several categories based on their size, purpose, and behavior in the market. These include retail investors, institutional investors, hedge funds, sovereign wealth funds, central banks, commercial banks, investment banks, and market intermediaries. Each plays a distinct role in the global financial ecosystem.
1. Retail Investors
Retail investors, often referred to as individual investors, are non-professional market participants who invest their personal funds in various financial instruments such as stocks, bonds, mutual funds, and derivatives. Their primary motivation is wealth accumulation, retirement planning, or speculation. While retail investors are generally smaller in scale compared to institutional players, collectively they contribute significantly to market liquidity and price formation.
Behaviorally, retail investors are often influenced by psychological factors such as herd mentality, fear, and greed, leading to volatile trading patterns. They tend to follow trends or news-driven movements rather than fundamental analysis, making them more reactive than proactive in market participation.
2. Institutional Investors
Institutional investors include pension funds, insurance companies, mutual funds, endowments, and large asset management firms. These participants manage large pools of capital on behalf of their clients or beneficiaries and are typically focused on long-term investment objectives. Institutional investors influence market pricing and liquidity due to the size of their transactions, which can be in millions or even billions of dollars.
They utilize sophisticated investment strategies, including quantitative analysis, algorithmic trading, and risk management models. Unlike retail investors, institutional investors tend to focus on fundamentals, macroeconomic trends, and corporate earnings to drive their investment decisions. Their presence in the market ensures stability to some extent, though their large trades can also create temporary volatility.
3. Hedge Funds
Hedge funds are private investment partnerships that employ aggressive and often complex strategies to achieve high returns. They invest in equities, derivatives, commodities, currencies, and alternative assets. Hedge funds differentiate themselves from traditional institutional investors through their use of leverage, short selling, arbitrage, and high-frequency trading.
These funds are highly influential in global markets due to their capacity to move prices with large trades, exploit inefficiencies, and engage in speculative activities. Hedge funds often operate with shorter time horizons and are more willing to take concentrated risks compared to pension funds or mutual funds. Their trading strategies can impact liquidity, volatility, and market sentiment, particularly in niche or less liquid markets.
4. Sovereign Wealth Funds (SWFs)
Sovereign wealth funds are government-owned investment vehicles that manage the surplus wealth of a nation, typically derived from foreign reserves, commodity exports, or budget surpluses. Examples include Norway’s Government Pension Fund Global and the Abu Dhabi Investment Authority. SWFs are long-term investors focused on preserving national wealth while achieving sustainable returns.
These funds invest across asset classes globally, including equities, bonds, real estate, infrastructure, and private equity. Their significant capital allows them to influence global financial markets, attract co-investors, and stabilize capital flows during economic uncertainty. Unlike hedge funds, SWFs are not primarily driven by short-term gains; their strategy emphasizes long-term growth and stability.
5. Central Banks
Central banks, such as the U.S. Federal Reserve, European Central Bank, and Bank of Japan, are regulatory institutions responsible for managing a nation’s monetary policy and financial stability. Central banks are critical participants in global currency, bond, and interbank markets.
Their interventions, such as adjusting interest rates, conducting open market operations, or engaging in quantitative easing, directly influence liquidity, currency valuations, and risk premiums in financial markets. Central banks often act as market stabilizers, providing liquidity during crises and guiding macroeconomic expectations, making them pivotal in shaping global market trends.
6. Commercial Banks
Commercial banks play a dual role as financial intermediaries and market participants. They provide credit to corporations, governments, and individuals while also investing in securities and derivatives for proprietary trading or asset management. Their activities impact interest rates, credit spreads, and overall market liquidity.
Large international banks, like JPMorgan Chase or HSBC, participate in forex markets, capital markets, and global debt issuance. Their transactions, often in large volumes, affect market prices and liquidity conditions. Additionally, banks facilitate the flow of capital for other participants, making them central to market functioning.
7. Investment Banks
Investment banks serve corporations, governments, and institutions by providing advisory services for mergers, acquisitions, and capital raising. They underwrite securities, engage in trading and market-making, and offer structured products to clients.
Through underwriting and trading, investment banks influence asset prices, yield curves, and market sentiment. Their research departments also shape investor expectations and decisions by providing market analyses, forecasts, and strategic insights.
8. Market Intermediaries
Other participants include brokers, dealers, exchanges, and clearinghouses. Brokers facilitate transactions between buyers and sellers, while dealers trade on their own accounts, providing liquidity. Exchanges offer organized marketplaces with regulatory oversight, ensuring transparency, fair pricing, and efficiency. Clearinghouses mitigate counterparty risk, guaranteeing settlement and reducing systemic risk.
Although intermediaries may not be final investors, their role is essential in enabling seamless market operations and maintaining investor confidence.
Behavioral Dynamics of Market Participants
The interaction among global market participants is driven by diverse motives:
Speculation: Hedge funds and retail traders often engage in short-term profit-seeking activities.
Hedging: Corporations and institutional investors use derivatives to mitigate financial risks related to interest rates, currencies, or commodity prices.
Investment: Pension funds, SWFs, and insurance companies focus on long-term capital appreciation.
Policy Intervention: Central banks manage macroeconomic objectives through monetary policy tools.
These behaviors contribute to market liquidity, price discovery, and volatility. The balance between speculative and long-term investment behavior often determines the resilience or fragility of markets during stress periods.
Impact on Global Markets
The diverse activities of market participants collectively shape global financial markets. Large trades by institutional investors can move prices and influence market trends, while retail investors contribute to sentiment-driven volatility. Central banks and SWFs provide stability, while hedge funds exploit inefficiencies and enhance liquidity in certain sectors. Investment banks and intermediaries ensure markets function efficiently through research, advisory services, and trade facilitation.
During crises, the behavior of market participants can amplify or dampen shocks. For example, coordinated central bank actions can restore confidence, while mass liquidation by hedge funds or retail investors can exacerbate volatility. Understanding these participants’ roles helps analysts, policymakers, and investors navigate complex global markets.
Conclusion
Global market participants form a complex and interconnected ecosystem where diverse actors with varying objectives interact. Retail investors, institutional investors, hedge funds, sovereign wealth funds, central banks, and financial intermediaries collectively determine liquidity, volatility, and price formation in financial markets. Their behavior is influenced by economic trends, policy changes, technological advancements, and psychological factors.
A nuanced understanding of these participants is crucial for anyone seeking to navigate global financial markets successfully. Recognizing the motivations, strategies, and potential market impact of each participant allows investors and policymakers to anticipate market movements, manage risk, and make informed decisions in an increasingly interconnected global economy.
In essence, global market participants are the lifeblood of financial markets, and their coordinated and competitive interactions shape the dynamics of capital flows, investment opportunities, and financial stability worldwide.

Understanding CPI (Consumer Price Index)1. Headline CPI vs Core CPI
Headline CPI represents the total inflation, including all goods and services, such as food and energy. It is the most commonly cited figure in news reports.
Why headline CPI matters: It shows the immediate impact of inflation on consumers, reflecting changes in everyday expenses.
Core CPI excludes volatile items such as food and energy, which can fluctuate sharply due to seasonal changes or geopolitical events. Core CPI provides a clearer view of underlying, persistent inflation trends.
Why core CPI matters: Policymakers, especially central banks, prefer core CPI to guide interest rate decisions since it is less affected by short-term price swings.
For example, if headline CPI jumps due to a spike in oil prices, the core CPI may remain steady, indicating that the broader inflation trend is stable.
2. CPI Components and Categories
CPI is broken down into categories that reflect typical consumer spending patterns. These categories are weighted according to their importance in the average household budget. Common CPI components include:
Food and Beverages
Covers groceries, dining out, non-alcoholic beverages, and alcohol.
Highly sensitive to seasonal changes, supply chain disruptions, and agricultural output.
Housing
Includes rent, owners’ equivalent rent (OER), and utilities.
Often the largest component in CPI, reflecting the substantial share of housing in household budgets.
Transportation
Includes vehicle purchases, gasoline, public transit, and airline fares.
Sensitive to fuel prices, geopolitical risks, and transportation demand.
Medical Care
Covers health insurance, hospital services, and prescription drugs.
Price increases in healthcare can impact the middle and lower-income population disproportionately.
Education and Communication
Tuition, books, digital communication, and phone services.
Rising costs in education often drive broader inflation concerns.
Recreation
Includes leisure activities, electronics, and entertainment services.
Generally less volatile but contributes to long-term inflation trends.
Apparel
Clothing and footwear.
Seasonal sales and fashion trends influence price changes.
Other Goods and Services
Personal care, tobacco, and miscellaneous items.
Weighting in CPI: Each category is assigned a weight reflecting its share of total consumer spending. For example, in the US CPI, housing constitutes about 40% of the total index, making it the dominant driver of inflation changes.
3. Monthly vs Yearly CPI Changes
CPI reports provide two main types of comparisons:
Month-over-Month (MoM) Change:
Measures price changes compared to the previous month.
Useful for short-term analysis and monitoring immediate inflation trends.
Example: If CPI rises 0.5% MoM, it shows the average prices increased by half a percent in the last month.
Year-over-Year (YoY) Change:
Compares prices to the same month in the previous year.
Indicates long-term inflation trends.
Central banks often focus on YoY CPI for monetary policy decisions.
Seasonal Adjustments: CPI data is often seasonally adjusted to account for predictable price fluctuations, such as holiday shopping or harvest periods, making month-to-month comparisons more accurate.
4. CPI Report Breakdown – Detailed Analysis
A comprehensive CPI report provides multiple layers of information:
a) Overall Index and Percentage Change
Shows the headline CPI and core CPI.
Includes MoM and YoY percentage changes.
b) Sub-Index Analysis
Each category’s price change is reported separately.
Example: Food +0.4%, Housing +0.3%, Transportation +0.7%.
c) Contribution to Overall CPI
Categories are weighted to show their influence on the total CPI.
Example: Even if food prices rise sharply, their small weight in the index may result in a modest overall CPI increase.
d) Regional or Demographic Breakdown
Some countries provide CPI data by region or city.
Enables policymakers to assess localized inflation pressures.
e) Special Notes and Revisions
CPI reports include methodological notes, such as changes in survey methods, seasonal adjustments, or revisions to previous months.
5. CPI Interpretation for Policy and Investment
Central Banks and Monetary Policy:
CPI informs interest rate decisions to control inflation.
If CPI rises above the target range, central banks may increase rates to curb spending.
If CPI falls too low, it signals deflation, prompting rate cuts or stimulus.
Investors and Financial Markets:
Rising CPI may lead to higher bond yields and stock market volatility.
Traders monitor CPI closely for clues about inflation-driven asset performance.
Businesses and Wage Negotiations:
Companies use CPI to adjust pricing strategies, cost structures, and wages.
Labor unions and employees use CPI to negotiate cost-of-living adjustments (COLAs).
6. Limitations of CPI
Despite its importance, CPI has several limitations:
Does Not Capture All Consumer Experiences:
CPI represents an “average” basket and may not reflect specific household spending patterns.
Excludes Certain Goods:
Luxury goods, investment assets, and some services may not be fully included.
Quality Adjustments:
CPI tries to account for improvements in product quality, but this adjustment can be subjective.
Substitution Bias:
CPI assumes consumers purchase the same basket, even if prices change. In reality, people may substitute cheaper alternatives.
7. CPI and Inflation Trends
Monitoring CPI trends over time reveals the economy’s inflationary pressures:
Moderate CPI Increase: Healthy for economic growth, signaling rising demand and controlled inflation.
High CPI Increase: Indicates overheating economy, potential wage-price spirals, and higher interest rates.
Negative CPI: Signals deflation, reduced consumer spending, and economic slowdown.
Analysts often compare CPI to other indicators, such as Producer Price Index (PPI), wage growth, and commodity prices, to get a complete picture of inflation.
8. Example of CPI Report Interpretation
Imagine a CPI report shows:
Headline CPI YoY: +4.2%
Core CPI YoY: +3.5%
Food +2.0%, Energy +8.0%, Housing +4.0%
Interpretation:
The economy is experiencing moderate inflation, driven mainly by energy costs.
Excluding volatile items, the underlying inflation (core CPI) is more moderate.
Policymakers may consider gradual interest rate adjustments rather than aggressive hikes.
Consumers are feeling price pressures in daily essentials, especially fuel.
Conclusion
The CPI report is a vital tool for understanding inflation dynamics. Its detailed breakdown, including headline and core CPI, sub-indices, weights, and changes over time, allows stakeholders to assess economic conditions accurately. While it has limitations, when combined with other economic indicators, CPI provides invaluable insights for central banks, investors, businesses, and policymakers.
Understanding the CPI report is not just about numbers—it’s about interpreting how inflation impacts purchasing power, policy decisions, and overall economic health. Accurate analysis can guide investments, wage negotiations, and policy strategies, making it a cornerstone of economic literacy.
Global IPO Trends: An In-Depth Analysis1. Global IPO Volume and Value
The global IPO market has historically been cyclical, with activity closely tied to market sentiment, investor appetite, and economic growth. In the early 2010s, IPO activity was characterized by a rebound following the 2008–2009 financial crisis, with significant listings in the United States, Europe, and emerging markets such as China and India. By 2014–2015, IPO activity surged due to accommodative monetary policies, low interest rates, and robust equity market performance. Technology, healthcare, and financial services companies were dominant players, reflecting global innovation trends.
In recent years, IPO volumes have fluctuated significantly. For instance, the 2020–2021 period saw an unprecedented boom driven by the COVID-19 pandemic. Remote work, digital transformation, and increased retail participation in stock markets fueled demand for new listings. Globally, companies such as Airbnb, DoorDash, and Alibaba attracted record-breaking attention, both in terms of capital raised and market capitalization at listing. Emerging markets also witnessed strong activity, particularly in India and Southeast Asia, as regional exchanges sought to attract technology startups and fintech firms.
2. Sectoral Shifts
The sectoral composition of IPOs has evolved considerably over the past decade. Traditionally, energy, manufacturing, and financial services dominated listings. However, the global trend has shifted toward technology, healthcare, and consumer-driven companies. Technology IPOs, including software, cloud computing, fintech, and artificial intelligence, now constitute a substantial share of global IPO proceeds.
Healthcare and biotechnology companies have also surged, spurred by innovation in pharmaceuticals, genomics, and medical devices, as well as heightened global health awareness following the pandemic. Consumer-focused sectors, including e-commerce and digital services, have benefited from rapid changes in consumer behavior. Additionally, environmental, social, and governance (ESG)-aligned companies are gaining traction, reflecting increasing investor focus on sustainable and ethical investment opportunities.
3. Regional Trends
Different regions exhibit distinct IPO dynamics shaped by local economic conditions, regulatory frameworks, and investor appetite.
United States: The U.S. remains the world’s largest IPO market by value, driven by the prominence of NASDAQ and NYSE. Technology and healthcare companies dominate U.S. listings. The trend of “dual-class shares” in tech IPOs, which allows founders to retain control, has also become prominent. Special Purpose Acquisition Companies (SPACs) have emerged as an alternative listing route, although regulatory scrutiny has fluctuated their popularity.
Europe: European IPO markets have been comparatively subdued but remain critical for large-scale industrial, energy, and fintech companies. London, Frankfurt, and Amsterdam are the leading centers, with Amsterdam seeing a resurgence due to favorable tax policies and market reforms. ESG-compliant and sustainable investment-focused IPOs are particularly significant in Europe.
Asia: Asia has experienced robust IPO activity, especially in China, Hong Kong, and India. The Shanghai and Shenzhen stock exchanges have attracted domestic and international investors, driven by technology, fintech, and consumer goods sectors. Hong Kong continues to serve as a gateway for Chinese companies seeking global investors. India’s IPO market has expanded dramatically in the past five years, led by technology, renewable energy, and financial services companies.
Emerging Markets: Southeast Asia, Latin America, and Africa are witnessing gradual but meaningful IPO growth. Governments and exchanges in these regions are actively encouraging listings through regulatory reforms and incentives, aiming to deepen capital markets and support local entrepreneurship.
4. Market Drivers
Several factors drive global IPO trends:
Macroeconomic Conditions: Low interest rates, liquidity injections by central banks, and fiscal stimulus programs often create conducive conditions for IPO activity. Conversely, high inflation, geopolitical tensions, or economic slowdown can depress IPO markets.
Investor Sentiment: Retail investor participation has grown significantly, especially post-2020, shaping demand for new offerings. Bullish market sentiment encourages higher valuations and more IPO launches.
Technological Innovation: Advancements in technology and the rise of startups have fueled a wave of listings, particularly in sectors like software, cloud services, fintech, electric vehicles, and green technologies.
Regulatory Environment: Liberalized listing norms, digital filing systems, and incentives for small and medium enterprises (SMEs) have facilitated IPO growth. On the other hand, stringent disclosure requirements or regulatory crackdowns can slow market activity.
Alternative Listing Routes: The popularity of SPACs, direct listings, and dual-class share structures has provided flexibility for companies, influencing global IPO dynamics.
5. Valuation Trends
Global IPO valuations have witnessed notable shifts. High-growth sectors, particularly tech and biotech, command premium valuations, often reflecting strong investor enthusiasm for innovation rather than immediate profitability. In contrast, industrial or commodity-based listings typically attract more conservative valuations. Regional differences are also significant, with U.S. and Chinese markets often exhibiting higher valuations compared to Europe or emerging markets.
6. Challenges in the IPO Market
Despite robust activity, IPO markets face multiple challenges:
Market Volatility: Economic uncertainty, geopolitical tensions, or sharp stock market corrections can delay or downsize IPOs.
Regulatory Scrutiny: Increasing regulatory oversight, disclosure requirements, and corporate governance standards can raise costs and complexity for prospective issuers.
Valuation Pressure: Overvaluation or speculative investor behavior can lead to post-listing underperformance, affecting market credibility.
Competition from Private Funding: Venture capital and private equity funding allow companies to stay private longer, reducing the immediate need for public listings.
7. Future Trends
Looking ahead, several trends are likely to shape global IPO markets:
Sustained Technology Dominance: Technology-driven IPOs will continue to dominate, with artificial intelligence, cloud computing, and fintech leading the way.
ESG and Green Finance: Sustainable companies with clear ESG objectives are expected to attract higher investor interest, driving IPO growth in this niche.
Emerging Market Expansion: IPO activity in Southeast Asia, Latin America, and Africa is likely to increase as exchanges mature and governments support capital market development.
Alternative IPO Models: SPACs, direct listings, and dual-class share structures will continue to influence how companies access public markets.
Increased Retail Participation: Digital trading platforms and greater financial literacy will expand retail investor influence on IPO pricing and demand.
Geopolitical Considerations: Cross-border IPOs may be affected by trade tensions, regulatory divergence, and global capital flow restrictions, influencing the geographic distribution of listings.
8. Conclusion
Global IPO trends reflect a complex interplay of economic cycles, technological innovation, investor sentiment, regulatory frameworks, and regional dynamics. The past decade has highlighted the growing importance of technology, healthcare, and ESG-aligned companies in shaping IPO activity. While traditional markets like the U.S., Europe, and China remain dominant, emerging markets are increasingly significant players, contributing to a more diversified global IPO landscape.
As companies seek capital to fund growth and investors search for high-return opportunities, the IPO market will remain a critical barometer of economic health and financial innovation. Companies, investors, and regulators must navigate valuation pressures, market volatility, and evolving regulations to ensure sustainable growth in this dynamic global environment. With innovation, digitization, and sustainability at the forefront, global IPOs will continue to evolve, shaping the future of capital markets and investment opportunities worldwide.

USDCHFUSDCHF
- Bearish Channel as an corrective pattern in Short Time Frame
- Break of Structure
- RSI - Divergence
- Order Block
- Completed " 12345 " Impulsive Waves and " A " Corrective Wave

EURGBP FRGNT Daily Forecast - Q4 | W49 | D2 | Y25 | 📅 Q4 | W49| D2| Y25 |
📊 EURGBP FRGNT Daily Forecast
🔍 Analysis Approach:
I’m applying Smart Money Concepts, focusing on:
Identifying Points of Interest on the Higher Time Frames (HTFs) 🕰️
Using those POIs to define a clear trading range 📐
Refining those zones on Lower Time Frames (LTFs) 🔎
Waiting for a Break of Structure (BoS) for confirmation ✅
This method allows me to stay precise, disciplined, and aligned with the market narrative, rather than chasing price.
💡 My Motto:
"Capital management, discipline, and consistency in your trading edge."
A positive risk-to-reward ratio, paired with a high win rate, is the backbone of any solid trading plan 📈🔐
⚠️ Losses?
They’re part of the mathematical game of trading 🎲
They don’t define you — they’re necessary, they happen, and we move forward 📊➡️
🙏 I appreciate you taking the time to review my Daily Forecast.
Stay sharp, stay consistent, and protect your capital
— FRNGT
FX:EURGBP

AUDUSD FRGNT Daily Forecast - Q4 | W49| D2| Y25 |📅 Q4 | W49| D2| Y25 |
📊 AUDUSD FRGNT Daily Forecast
🔍 Analysis Approach:
I’m applying Smart Money Concepts, focusing on:
Identifying Points of Interest on the Higher Time Frames (HTFs) 🕰️
Using those POIs to define a clear trading range 📐
Refining those zones on Lower Time Frames (LTFs) 🔎
Waiting for a Break of Structure (BoS) for confirmation ✅
This method allows me to stay precise, disciplined, and aligned with the market narrative, rather than chasing price.
💡 My Motto:
"Capital management, discipline, and consistency in your trading edge."
A positive risk-to-reward ratio, paired with a high win rate, is the backbone of any solid trading plan 📈🔐
⚠️ Losses?
They’re part of the mathematical game of trading 🎲
They don’t define you — they’re necessary, they happen, and we move forward 📊➡️
🙏 I appreciate you taking the time to review my Daily Forecast.
Stay sharp, stay consistent, and protect your capital
— FRNGT 🚀
FX:AUDUSD

XAUUSD Analysis 📢 New Trading Signal Released
The market is forming a clean structure, with price reaching a key zone that has been on my radar. Current indicators align with the expected move, and volume confirms the potential momentum building in this area.
I will continue to monitor the setup closely and provide updates if market conditions shift.
This is not financial advice—simply my personal market outlook.
🕒 Follow my profile for more signals and real-time analysis.

Q4 | W49 | D1 | Y25 - EURUSD FRGNT DAILY FORECAST POST BREAKDOWN📅 Q4 | W49 | D1 | Y25 |
📊 EURUSD FRGNT DAILY FORECAST
🔍 Analysis Approach:
I’m applying Smart Money Concepts, focusing on:
Identifying Points of Interest on the Higher Time Frames (HTFs) 🕰️
Using those POIs to define a clear trading range 📐
Refining those zones on Lower Time Frames (LTFs) 🔎
Waiting for a Break of Structure (BoS) for confirmation ✅
This method allows me to stay precise, disciplined, and aligned with the market narrative, rather than chasing price.
💡 My Motto:
"Capital management, discipline, and consistency in your trading edge."
A positive risk-to-reward ratio, paired with a high win rate, is the backbone of any solid trading plan 📈🔐
⚠️ Losses?
They’re part of the mathematical game of trading 🎲
They don’t define you — they’re necessary, they happen, and we move forward 📊➡️
🙏 I appreciate you taking the time to review my Daily Forecast.
Stay sharp, stay consistent, and protect your capital
— FRNGT 🚀
FX:EURUSD

BTCUSD- SELL strategy weekly chart GANN SQIt feels heavy to the downside, and indicators (especially the monthly chart) have turned negative. Even though there are plenty of arguments for higher levels over time, one cannot deny we have reached very oversaturated levels. The potential to test $ 55k is there medium-term.
Strategy SELL @ $ 85k - 95k and take profit near $ 60k for now.

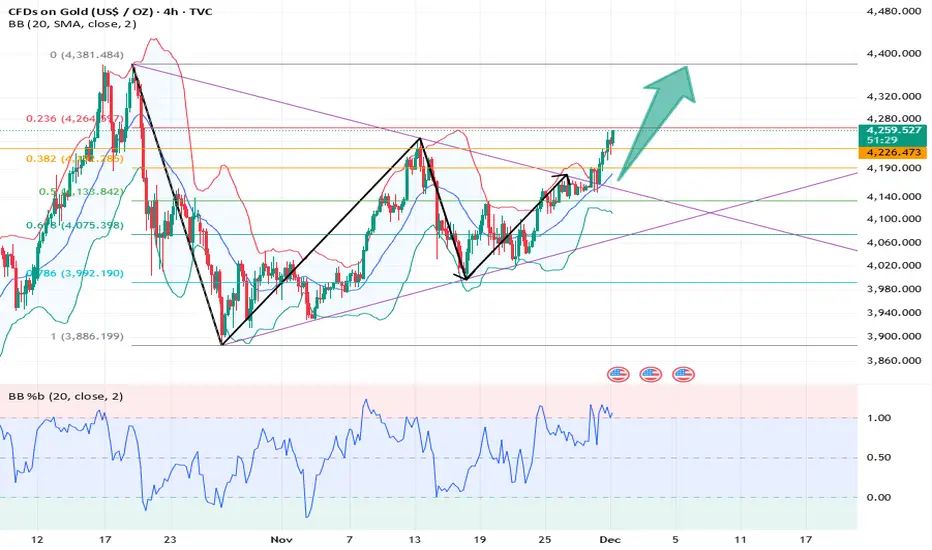
Will gold continue to rise?Gold closed with a doji candlestick on the daily chart, showing a slight increase. The latest 5-day and 7-day moving averages (MA5/MA7) have moved up to support at 4200/4183, while the 10-day and 7-day moving averages (MA10/MA7) remain in an upward crossover. On the short-term 4-hour chart, gold tested the upper Bollinger Band at 4264 before pulling back. On the hourly chart, the Bollinger Bands are narrowing, moving averages are closely aligned, and the RSI indicator is adjusting near the midline. Gold is currently in a period of consolidation and indicator correction. The key focus today is the strength of the pullback and correction; a decline followed by a rise is expected initially, with the Asian session focusing on the continuation of the pullback.
The current market is in a phase of upward momentum. Based on historical patterns, this typically represents the initial accumulation phase for potential high-level selling. A market turning point is expected as early as early December, and at the latest, mid-December. The momentum of this upward surge is likely to last for two to three days at the beginning of the month, i.e., from Monday to Wednesday this week. Once this short-term momentum weakens, a sharp reversal is possible, initiating a technical correction. Therefore, it is advisable to avoid blindly chasing the price higher during this period.
A clear understanding of the overall market trend is still necessary: we are undoubtedly in a major bull market cycle, and pullbacks are simply accumulating energy for a healthy upward trend in the future. Therefore, the strategic approach should be to "buy on dips." Specifically, in the short term, gold faces resistance in the $4290-$4300 range. $4300, as a key psychological level, will be an important resistance reference area, and the area around it can be seen as the focus of short-term bullish and bearish struggles. Before a fundamental reversal of the trend, every effective pullback should be considered a buying opportunity.
Key Levels:
First Support: 4200, Second Support: 4183, Third Support: 4160
First Resistance: 4250, Second Resistance: 4268, Third Resistance: 4290
Gold Intraday Trading Strategy:
BUY: 4190-4195, SL: 4180, TP: 4210-4220;
SELL: 4255-4260, SL: 4270, TP: 4240-4230;
More Analysis →

Bitcoin’s Last Dance: Altseason, Final High, Then Oblivion!Bitcoin has been following our projection perfectly — almost to the day.
We expect a major bottom this week around 5 December, followed by a strong advance into 15 December 2025. From there, the market should decline into 29 December 2025, before launching into one final push higher into 2 February 2026.
After that, the Fire Horse effect begins to take hold, and we anticipate a major collapse across Bitcoin and global financial markets. Our long-term expectation remains unchanged:
Bitcoin is likely to fall back to at least 15k — and ideally to the 4k region.
Call me crazy, I don’t care. Bookmark this.
Altseason?
We believe the altcoin season will begin in mid to late December 2025, extending until either 2 February 2026 or 6 April 2026, before collapsing as well — in line with the broader market cycle.
Fractals
The fractals shown on the chart illustrate time, not price.

BTCUSDLooking that btcusd tzps a 4 Point of interest, we assume it breakes the previous lower high with good bullish pressure and momentum we'd be expecting btc to make some new good uoward movement moves

XAUUSD ANALYSISThis signal is generated using a disciplined, data-driven approach that evaluates price action, trend dynamics, and liquidity distribution. The trade setup highlights a moment where market conditions align to create a balanced opportunity with a favorable risk-to-reward profile.
The analysis emphasizes precision and clarity, focusing on key decision zones where buyers or sellers are most likely to take control. This signal is crafted to help traders navigate the market with structure, consistency, and confidence.
📌 Signal Breakdown
Entry Level: Identified through market structure validation and momentum confirmation
Stop-Loss (SL): Placed at a strategic invalidation zone for controlled downside risk
Take-Profit (TP): Target levels modeled around liquidity pockets, trend projections, and volatility range
Technical Reasoning: A brief yet clear explanation outlining the logic behind the chosen direction
Market Scenarios: Expected price behavior under both bullish and bearish conditions
⚠️ Disclaimer
This signal is not financial advice and is intended solely for analytical and educational purposes. Always manage your risk appropriately and stay adaptable to changing market conditions.

SPX Gann BoxUpdated Gann BOX Fibonacchi Levels for upcoming SPX correction/wave down.
Horizontal levels mark possible price targets at fibonacchi numbers with a horizontal support. Vertical levels show time targets at fibonacchi numbers. Current move went up to .618 and .786 levsl, that indicates us a price target at 2.618 or 2.786 would be likely as well.

EURUSD FRGNT WEEKLY FORECAST - Q4 | W49 | Y25 |📅 Q4 | W49 | Y25 |
📊 EURUSD FRGNT WEEKLY FORECAST
🔍 Analysis Approach:
I’m applying Smart Money Concepts, focusing on:
Identifying Points of Interest on the Higher Time Frames (HTFs) 🕰️
Using those POIs to define a clear trading range 📐
Refining those zones on Lower Time Frames (LTFs) 🔎
Waiting for a Break of Structure (BoS) for confirmation ✅
This method allows me to stay precise, disciplined, and aligned with the market narrative, rather than chasing price.
💡 My Motto:
"Capital management, discipline, and consistency in your trading edge."
A positive risk-to-reward ratio, paired with a high win rate, is the backbone of any solid trading plan 📈🔐
⚠️ Losses?
They’re part of the mathematical game of trading 🎲
They don’t define you — they’re necessary, they happen, and we move forward 📊➡️
🙏 I appreciate you taking the time to review my Daily Forecast.
Stay sharp, stay consistent, and protect your capital
— FRNGT 🚀
FX:EURUSD

December 2025 TDX LevelsNifty is showing us the sea as warm and the sky as blue but its skating on the thin ice.
Nifty currently appears optimistic, with the market showing positive signals; however, caution is advised as it may be operating on uncertain footing.
Refer to the December TDX Levels to identify the prevailing trend. It is advisable to remain cautious if the index falls below 26,300.
For a bullish momentum to develop, the index would need to surpass the 26,465 level. Given the current AD Ratio, technical indicators, and the approaching New Year, such a move seems unlikely in the near term.
Therefore, it is reasonable to expect a consolidating or lackluster trend for the time being, characterized by sporadic short-term spikes that are not followed by sustained buying interest. In this environment, monitoring futures market developments is important. If an opportunity arises, consider taking short-term positions accordingly.
Once clearer market direction emerges, we will provide an updated analysis.

XAUUSD (1H) – Rejection Zone Retest SetupOANDA:XAUUSD
A corrective phase is expected if price fails to sustain above the rejection zone. A retest of the new structural support around 4,209–4,210 remains the key reaction level. If bearish confirmation forms below the rejection line, downside continuation becomes valid.
Key Scenarios
❌ Bearish Case (Primary Setup) 📉
If price rejects the 4,241 rejection zone and forms confirmation:
→ 🎯 Target: 4,147
Further continuation possible if breakdown momentum continues.
✅ Bullish Case 🚀 (Invalidation Flip)
A clean break and candle close above 4,241 with retest holding may shift momentum back toward recent highs.
Current Levels to Watch
Resistance 🔴:
4,241 (zone of rejection)
Support 🟢:
4,209 (entry interest zone)
4,147 (target support)
⚠️ Disclaimer: This analysis is for educational purposes only — not financial advice.

XAUUISD: Market Analysis and Strategy for December 1stGold Technical Analysis:
Daily Resistance: 4330, Support: 4150
4-Hour Resistance: 4265, Support: 4193
1-Hour Resistance: 4256, Support: 4226
The monthly chart's renewed upward movement reinforces the continuation of this year's bull market. Last Friday's strong rally indicates that the short-term upward trend has not been hindered, further strengthening bullish expectations for early December.
The daily chart continues last Friday's upward trend, with the "rounded bottom" candlestick pattern remaining intact. The Asian session also saw a strong upward breakout, with the Bollinger Bands expanding upwards, moving average support moving higher, and the MACD/KDJ indicators turning upwards. Today's accelerated breakout above previous highs is also a bullish signal. Short-term trading should follow the trend! Long-term holders can wait for the Fed's interest rate decision before considering buying opportunities!
Based on the 1-hour chart, gold continued its upward trend during the European session. The candlestick pattern is within an upward channel, and the short-term Bollinger Bands are narrowing upwards. Be aware of potential sideways consolidation followed by a rebound after indicator correction. Resistance is seen around 4260; a break above this level could lead to further gains towards 4300/4330. Support levels are around 4230/4222.
Trading Strategy:
BUY: 4230~4222
Selling should wait for a bearish pattern to emerge in real-time.
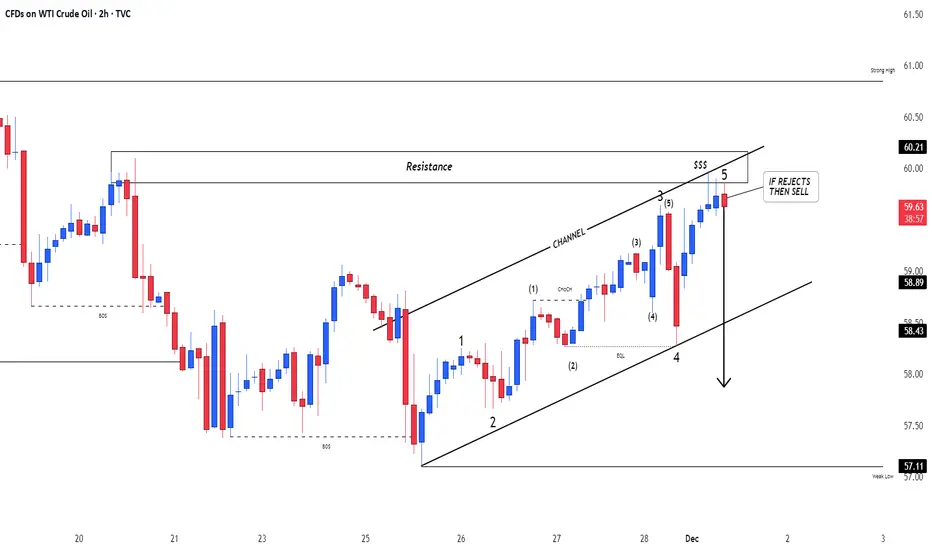
Crude OilU.S Oil
- Bullish Channel as an corrective pattern in Short Time Frame
- Resistance Level
- Change of Characteristics
- Completed " 12345 " Impulsive Waves
- Order Block