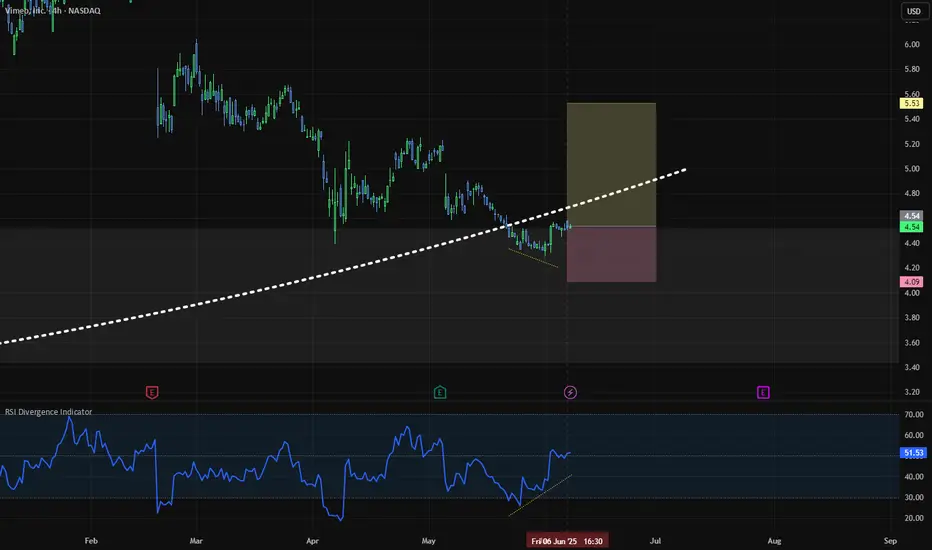
Bullishbouncing from lvl 30 RSI with divergence on 4 hr time frame, I see bullish confirmed set up for me after bouncing from daily POI, SL and target are shown on chart
Gann
#FLUX/USDT – Key Support Retest & Possible Reversal Setup#FLUX
The price is moving within a descending channel on the 1-hour frame, adhering well to it, and is heading for a strong breakout and retest.
We have a bearish trend on the RSI indicator that is about to be broken and retested, which supports the upward breakout.
There is a major support area in green at 0.1983, which represents a strong support point.
We are heading for consolidation above the 100 moving average.
Entry price: 0.2013
First target: 0.2052
Second target: 0.2094
Third target: 0.2145
Don't forget a simple matter: capital management.
When you reach the first target, save some money and then change your stop-loss order to an entry order.
For inquiries, please leave a comment.
Thank you.

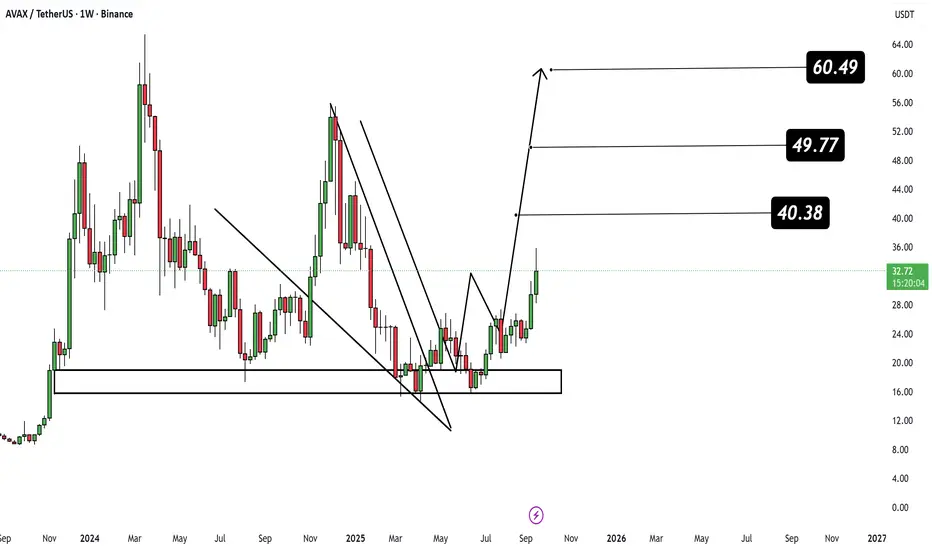
Send it to $52#AVAX Easy x2 in the market😳
W-Bottom + Bullish pennant under the neckline resistance💁♂️
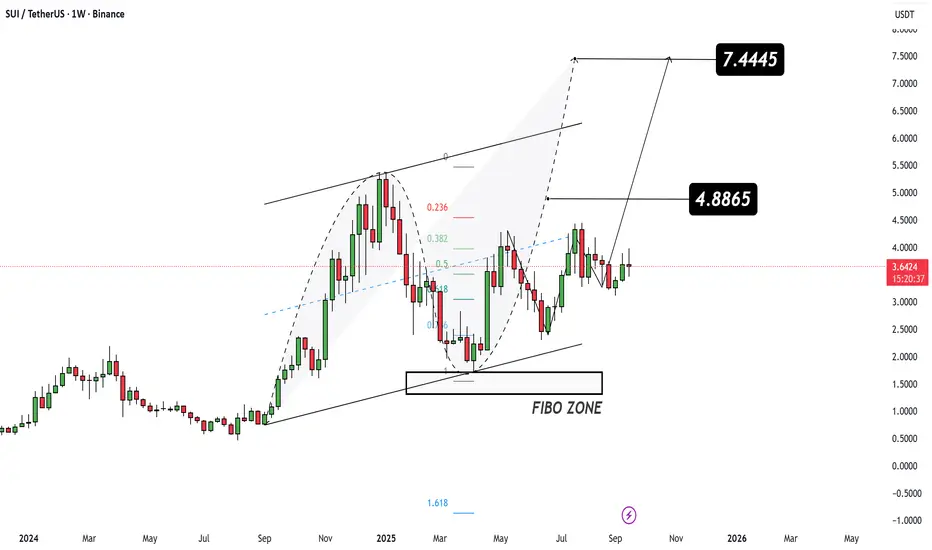
Double-digit SUI is only a matter of time#SUI Still deeply undervalued, aside from strong fundamentals we have bullish technical setup🔥
We’re seeing a local bullish pennant — its breakout will unfold a breakout of the bigger structure → which is 300 Days accumulation inside the Symmetrical Triangle💁♂️
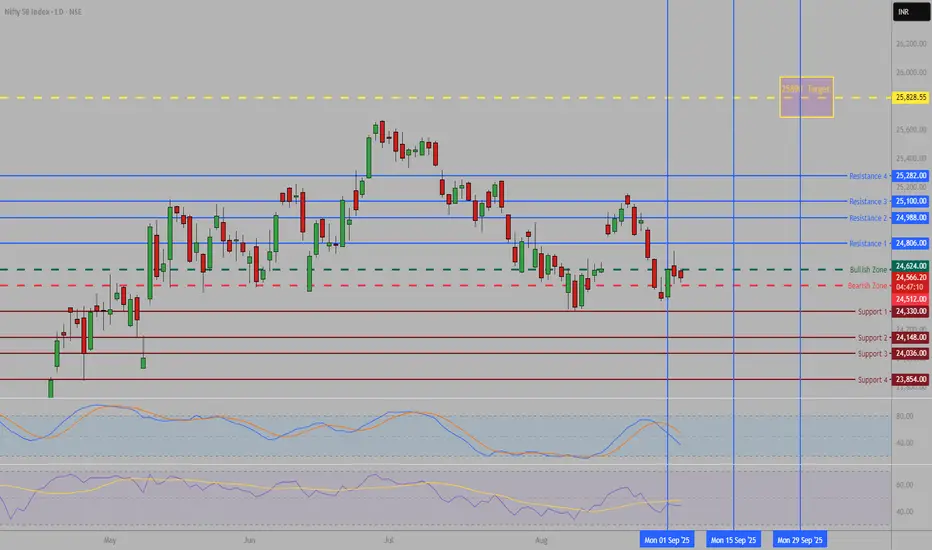
Nifty September TDX Levels -Please refer to these levels for Trend guidance.
Once you are familiar with them, transition to hourly charts for decision-making.
GRX Swing Setup Watch $0.595 and $0.875GRX is showing promising signs here, but as a small-cap stock, it demands disciplined risk management and a cautious approach. Price action is currently pulling back into a strong macro zone, aligning with the major 50% retracement level and previous structural highs—an area worth watching closely.
Trade Scenarios
Scenario 1 Optimal Entry:
Ideally, price pulls back to the demand structure around $0.595.
Look for a bullish candle confirmation at this level.
This setup offers the most favorable risk-to-reward ratio.
Scenario 2 – Trend Continuation:
If price holds the swing low at $0.68 and breaks above the local swing high at $0.875, it confirms an uptrend.
Same TP targets apply.
Targets:
Initial target: ATH resistance near $1.305
Potential for further upside by trailing stop-loss along swing highs.
If price starts to break and close below $0.56 expect lower prices and the potential of this being a fakeout
Reminder: This is a speculative setup on a small-cap stock. Always size positions appropriately and manage risk with precision.
Please note, arrows are not based on time analysis just overall market structure.

Inflation, Interest Rates & Global Trade CostsPart 1: Understanding Inflation
What is Inflation?
Inflation is simply the rate at which the general level of prices for goods and services rises over time. When inflation is high, money loses value—what you could buy last year for $100 may now cost $110.
Economists track inflation using indicators like the Consumer Price Index (CPI) or Wholesale Price Index (WPI). While some inflation is normal (a sign of healthy demand), too much or too little can destabilize economies.
Mild inflation (2–3% per year) usually means an economy is growing steadily.
High inflation (above 6–7%) erodes purchasing power, increases uncertainty, and hurts savings.
Hyperinflation (triple digits annually, like Zimbabwe or Venezuela at times) destroys entire economies.
Deflation (falling prices) may sound good, but it discourages spending and investment, leading to recessions.
Causes of Inflation
Demand-Pull Inflation – When demand for goods exceeds supply, prices go up. Example: During post-pandemic recovery, pent-up demand pushed prices higher globally.
Cost-Push Inflation – When production costs rise (raw materials, wages, fuel), producers pass costs to consumers. Example: Oil price spikes increase transportation and manufacturing costs worldwide.
Imported Inflation – When the cost of imported goods rises due to weaker currency or higher global prices.
Monetary Inflation – When central banks print too much money or keep interest rates artificially low, flooding the economy with liquidity.
Why Inflation Matters Globally
Inflation does not stay within borders. Higher energy prices in one country push up manufacturing costs worldwide. Food shortages in one region can cause global ripple effects. For example, the Russia-Ukraine war disrupted grain exports, leading to food inflation across Africa and Asia.
Part 2: Interest Rates
What are Interest Rates?
Interest rates represent the cost of borrowing money. Central banks (like the U.S. Federal Reserve, European Central Bank, or Reserve Bank of India) set benchmark rates that influence lending across the economy.
When central banks change rates, they are essentially trying to control inflation and economic growth.
Low interest rates encourage borrowing and spending but can fuel inflation.
High interest rates slow down borrowing, reduce spending, and cool inflation—but they also risk slowing growth too much.
The Inflation–Interest Rate Link
Central banks use interest rates as their main weapon against inflation. If prices are rising too fast, raising rates makes loans costlier, which reduces consumer demand and investment, eventually bringing inflation down.
For example, in 2022–23, the U.S. Federal Reserve aggressively hiked interest rates from near 0% to above 5% to fight the worst inflation in 40 years. That made mortgages, car loans, and corporate borrowing more expensive, slowing down demand.
Interest Rates & Global Trade
Interest rates do not just affect domestic economies—they also influence global trade and capital flows:
Currency Strength – Higher interest rates attract foreign investment, strengthening the domestic currency. A stronger dollar, for example, makes U.S. exports more expensive but imports cheaper.
Capital Flows – Investors chase higher yields. If U.S. rates rise, money flows into American bonds and stocks, draining liquidity from emerging markets.
Debt Burden – Many developing countries borrow in dollars. When U.S. rates rise, their repayment burden grows, sometimes leading to crises.
Part 3: Global Trade Costs
What are Trade Costs?
Global trade costs include everything that makes cross-border trade expensive or complicated:
Transportation Costs – Shipping freight, air cargo, fuel charges.
Tariffs & Trade Barriers – Import duties, customs delays, paperwork.
Supply Chain Costs – Warehousing, inventory, distribution networks.
Currency Fluctuations – Exchange rate risks add hidden costs to contracts.
Key Drivers of Trade Costs
Energy Prices – Oil and gas prices directly affect shipping costs. For example, a spike in crude oil prices can double container freight charges.
Geopolitical Tensions – Wars, sanctions, and tariffs increase uncertainty and add barriers to trade.
Infrastructure Bottlenecks – Port congestion, lack of modern rail/road links, or limited storage facilities make trade inefficient.
Technology & Automation – Digital tools (blockchain, AI logistics, tracking systems) can lower costs by reducing inefficiencies.
Regulatory Complexity – Each country’s rules on safety, quality, and documentation increase time and cost.
Recent Shocks to Global Trade Costs
COVID-19 Pandemic – Container shortages, factory shutdowns, and port delays caused shipping costs to multiply five-fold.
Russia–Ukraine War – Energy price shocks and rerouted shipping lanes raised logistics costs.
Climate Change & Canal Blockages – Events like the Suez Canal blockage (2021) disrupted $9 billion worth of daily trade.
Part 4: The Interconnection
Here’s where it all ties together:
Inflation & Trade Costs
Higher trade costs (fuel, shipping, tariffs) push prices up globally, fueling inflation.
Inflation in turn raises production costs, which feeds back into higher global trade prices.
Interest Rates & Inflation
Central banks raise rates to fight inflation.
But higher rates increase borrowing costs for shipping companies, exporters, and importers, raising global trade costs indirectly.
Interest Rates & Trade Costs
Higher rates strengthen currencies, making imports cheaper but exports less competitive.
Developing nations with heavy external debt see rising repayment burdens when rates go up, making global trade riskier.
A Cycle in Motion
Rising oil prices → higher shipping costs → global inflation.
Global inflation → central banks raise interest rates.
Higher interest rates → stronger currencies, weaker exports.
Weaker exports → trade slows down, but debt burdens grow.
This cycle shows how tightly linked these forces are, making global economic management extremely tricky.
Part 5: Case Studies
Case Study 1: U.S. Federal Reserve & Global Trade (2022–23)
When the Fed hiked rates rapidly to curb inflation, emerging markets like Turkey, Argentina, and India faced capital outflows and currency depreciation. Their import bills rose, worsening inflation. Shipping companies faced higher borrowing costs, raising freight charges.
Case Study 2: Oil Price Spike & Global Inflation (1970s & 2020s)
In the 1970s, OPEC’s oil embargo quadrupled oil prices, fueling global inflation and recession. In 2021–22, post-pandemic recovery plus the Russia-Ukraine war caused similar oil and gas price spikes, driving up both inflation and trade costs.
Case Study 3: Pandemic & Supply Chains
COVID-19 shutdowns raised container shipping costs from $2,000 per container in 2019 to nearly $20,000 in 2021. This directly drove inflation in consumer goods worldwide.
Part 6: The Future Outlook
Trends to Watch
De-Dollarization – If global trade shifts away from the U.S. dollar, interest rate cycles in the U.S. may have less influence globally, though this will take time.
Green Energy Transition – As shipping and manufacturing shift to renewable energy, volatility from oil price shocks may reduce, lowering trade costs in the long run.
Technology in Logistics – AI, blockchain, and real-time data tracking can significantly reduce global trade costs.
Fragmentation of Supply Chains – “Friendshoring” and regional trade blocs may reduce dependence on global shipping but increase localized inflation risks.
Climate Risks – Extreme weather, rising sea levels, and canal disruptions will continue to add volatility to trade costs.
Policy Challenges
Balancing Inflation & Growth – Central banks must avoid over-tightening, which risks recession.
Global Coordination – Inflation, interest rates, and trade costs are global phenomena; yet policies are mostly national. Lack of coordination worsens shocks.
Debt Sustainability – Rising global interest rates put developing nations at risk of debt crises, which can collapse trade flows.
Conclusion
Inflation, interest rates, and global trade costs are not isolated variables. They form a complex, interconnected system that shapes the global economy. Inflation eats away at purchasing power, central banks fight it with interest rates, and those rate changes ripple through currencies, trade, and debt. Meanwhile, trade costs—driven by energy, geopolitics, and supply chains—feed into inflation, creating a feedback loop.
For businesses, policymakers, and traders, understanding this triangle is essential. A shipping delay in Asia can fuel inflation in Europe. An interest rate hike in the U.S. can trigger capital flight from Africa. And an oil shock in the Middle East can raise costs across the globe.
In the 21st century, with economies so deeply interconnected, no country can ignore the dance between inflation, interest rates, and global trade costs. Managing this delicate balance will determine whether the world enjoys steady growth—or faces repeated cycles of crisis.

De-Dollarization & Currency Wars1. Introduction
For nearly 80 years, the U.S. dollar has ruled the world economy. It’s the currency in which oil is priced, international trade is settled, and central banks hold their reserves. But in recent years, we’ve heard a new buzzword—de-dollarization. This means countries are actively trying to reduce their reliance on the U.S. dollar in trade and finance.
Alongside this trend, another term pops up—currency wars. These are not fought with tanks or missiles but with exchange rates, sanctions, and financial strategies. In short, it’s the battle of money versus money, where nations use currencies as weapons to protect their own interests or undermine rivals.
Both de-dollarization and currency wars are shaping the future of global trade. To understand where the world is heading, we must look back at how the dollar became so powerful and why many nations now want to escape its grip.
2. The Rise of the Dollar’s Dominance
The U.S. dollar didn’t always dominate global finance. Before World War II, the British pound sterling was the world’s primary reserve currency. But after the war, Britain was economically weakened, and the U.S. emerged as the strongest economy.
Bretton Woods Agreement (1944): The world agreed to peg major currencies to the dollar, and the dollar itself was pegged to gold. This system made the dollar the centerpiece of global trade.
End of Gold Standard (1971): President Richard Nixon ended dollar-gold convertibility, but the dollar retained dominance.
Petrodollar System (1970s): The U.S. struck deals with Saudi Arabia and OPEC, ensuring oil was sold only in dollars. Since every country needs oil, every country needed dollars.
These moves cemented the dollar as the backbone of global finance. By the 1990s, over 70% of world trade and reserves were in dollars.
3. Why Countries Want to Escape the Dollar Trap
So, if the dollar has been so powerful, why are countries now trying to move away from it? Several reasons:
Sanction Power of the U.S.: Nations like Russia, Iran, and Venezuela have been cut off from dollar-based systems like SWIFT. They see dependence on the dollar as a political vulnerability.
U.S. Debt & Inflation Concerns: America’s ballooning national debt and money printing raise doubts about the dollar’s long-term stability.
Desire for Multipolarity: Emerging powers like China, India, and Brazil want a world where no single country controls the financial system.
Currency Sovereignty: Many nations want trade in their own currencies to reduce foreign exchange risks.
In short, de-dollarization is not only economic—it’s also political and strategic.
4. Currency Wars Explained
A currency war happens when nations deliberately manipulate currency values or financial systems to gain an advantage. These wars take different forms:
Exchange Rate Manipulation: Countries devalue their currencies to boost exports (China has been accused of this).
Sanctions & Financial Exclusion: The U.S. uses the dollar’s dominance to freeze assets, block trade, and isolate nations.
Reserve Diversification: Central banks reduce dollar holdings and increase gold, euro, or yuan reserves.
Digital Battles: Central Bank Digital Currencies (CBDCs) are the new frontier of currency competition.
Currency wars are silent but powerful—they can reshape trade flows, weaken rivals, and redistribute wealth.
5. Current Players in De-Dollarization
The biggest pushback against dollar dominance comes from BRICS nations (Brazil, Russia, India, China, South Africa), recently joined by countries like Saudi Arabia, UAE, and Iran.
China: Promoting the yuan through Belt & Road projects, oil trade, and Shanghai oil futures.
Russia: After U.S. sanctions, Moscow shifted oil and gas sales to rubles and yuan.
India: Pushing rupee trade settlement with neighbors and partners.
Middle East: Saudi Arabia and UAE are exploring non-dollar oil sales, breaking the petrodollar system.
Africa & Latin America: Countries are exploring local currency trade to avoid dollar shortages.
Together, these moves mark a growing wave of financial independence.
6. Alternative Systems Emerging
As countries de-dollarize, what replaces the dollar?
Chinese Yuan (Renminbi): Growing in trade but still limited by capital controls.
Euro: Strong but hampered by EU’s fragmented politics.
Gold: Central banks have massively increased gold buying as a hedge.
Cryptocurrencies & Stablecoins: Offer decentralized alternatives but face volatility and regulation.
CBDCs (Digital Currencies): China’s digital yuan is already in use, and many nations are testing their own versions.
None alone can fully replace the dollar yet, but together, they reduce its monopoly.
7. Impact on Global Trade & Finance
De-dollarization changes the way money flows:
Trade Settlements: More deals are now settled in yuan, rupee, or local currencies.
Banking Systems: New payment networks like China’s CIPS challenge SWIFT.
Reserve Management: Central banks diversify away from dollar-heavy portfolios.
Commodity Pricing: Gold, oil, and gas could increasingly be priced in non-dollar terms.
Inflation & Forex Volatility: Currency wars often trigger inflation in weaker economies.
For ordinary people, this may mean currency fluctuations, higher import costs, or new opportunities in trade.
8. Case Studies
Russia (Post-Ukraine Sanctions): Cut off from dollar payments, Russia turned to China, India, and Turkey for yuan and ruble trade. The ruble survived only by leaving the dollar system.
China’s Yuan Push: Beijing signed currency swap agreements with dozens of countries, expanding yuan trade share.
India’s Rupee Trade: India has started settling with countries like Sri Lanka and Iran in rupees.
These examples show that de-dollarization is no longer theory—it’s happening.
9. Challenges in Replacing the Dollar
Despite progress, replacing the dollar is very hard. Why?
Liquidity: The dollar is the most liquid currency—easy to buy/sell globally.
Trust: Investors trust U.S. institutions more than those of rivals.
Military & Geopolitical Power: The U.S. Navy protects trade routes, indirectly backing the dollar.
Network Effect: Everyone uses dollars because everyone else does—it’s hard to break this cycle.
So, while de-dollarization is real, it’s a slow, long-term process.
10. Future Scenarios
Looking ahead, three possible outcomes emerge:
Multipolar Currency World: The dollar remains important but shares power with yuan, euro, rupee, and digital assets.
Fragmented Finance: Countries split into blocs—U.S. dollar bloc, China-led yuan bloc, regional trade blocs.
Digital Currency Revolution: CBDCs and blockchain-based systems reshape global money, bypassing traditional systems.
Whichever path unfolds, the era of absolute U.S. dollar dominance is fading.
11. Conclusion
De-dollarization and currency wars represent the hidden financial battles of our time. For decades, the dollar was king, but now rising powers are challenging its throne. Currency wars are not fought with soldiers but with sanctions, interest rates, and payment systems.
For ordinary people, these shifts may show up in fluctuating exchange rates, changing fuel prices, or the rise of digital money. For nations, it’s about sovereignty, independence, and survival in a financial system long controlled by one power.
The world is moving from a dollar-dominated system to a multipolar currency order. The transition will be messy, filled with currency wars and power struggles, but it marks the beginning of a new financial era.

Energy Transition & Commodity Supercycle1. Introduction
The world is standing at the intersection of two powerful forces shaping the global economy: the energy transition and the possibility of a new commodity supercycle.
The energy transition refers to the global shift away from fossil fuels like coal, oil, and natural gas, toward renewable and cleaner energy sources such as solar, wind, hydrogen, and nuclear. This transformation is driven by climate change concerns, technological advancements, and policy shifts by governments worldwide.
A commodity supercycle is a prolonged period (often 10–20 years) where commodity prices—such as oil, copper, lithium, and agricultural goods—rise significantly due to strong structural demand outpacing supply. Past supercycles were fueled by industrial revolutions, wars, and urbanization waves.
Today, these two phenomena are interlinked. The push for clean energy demands massive amounts of new materials—copper for wires, lithium and cobalt for batteries, rare earths for wind turbines, and silver for solar panels. At the same time, fossil fuel demand doesn’t vanish overnight, creating a tug-of-war between old energy and new energy, each influencing commodity markets in profound ways.
2. Historical Context: Past Commodity Supercycles
To understand today’s situation, it’s important to look at history. Commodity supercycles have occurred several times over the past century:
Late 19th century (Industrial Revolution)
Rapid industrialization in Europe and the U.S. fueled huge demand for steel, coal, and oil.
Post-World War II (1950s–70s)
Reconstruction of Europe and Japan required enormous amounts of metals, oil, and agricultural products.
China-led Boom (2000s–2014)
China’s entry into the World Trade Organization (WTO) and its infrastructure-heavy growth led to a surge in oil, iron ore, copper, and coal demand.
Each of these supercycles reshaped global trade and investment. Today, the green energy revolution may drive the next one.
3. What is the Energy Transition?
The energy transition is about changing the way we produce, distribute, and consume energy.
Key Drivers:
Climate Change: Rising global temperatures, extreme weather, and net-zero commitments.
Technology: Falling costs of solar, wind, and batteries.
Policy: Carbon taxes, emission regulations, and renewable energy mandates.
Consumer Behavior: Electric vehicles (EVs), rooftop solar, and ESG (environmental, social, governance) investing.
Main Pillars of Energy Transition:
Renewables: Solar, wind, hydropower, geothermal.
Electrification: EVs, electric heating, smart grids.
Storage: Lithium-ion batteries, hydrogen, pumped hydro.
Decarbonization of industry: Green hydrogen for steel, carbon capture technologies.
This shift requires enormous physical resources, which links the energy transition directly to commodities.
4. Commodity Demands of the Energy Transition
Unlike the oil-driven 20th century, the 21st-century energy system relies on minerals and metals.
Copper
Vital for electrical wiring, EVs, and renewable grids.
A single EV uses 2.5x more copper than a gasoline car.
Demand could double by 2035.
Lithium
Core of rechargeable batteries for EVs and storage.
Demand may rise 7-fold by 2030.
Cobalt
Improves battery life and performance.
Supply concentrated in the Democratic Republic of Congo (DRC), raising geopolitical concerns.
Nickel
Needed for high-energy-density batteries.
Indonesia is emerging as the global hub.
Rare Earths (Neodymium, Dysprosium, etc.)
Essential for magnets in wind turbines and EV motors.
China controls ~80% of global supply.
Silver
Used in solar panels.
Rising solar installations = surging silver demand.
This demand creates the foundation for a green commodity supercycle.
5. Supply-Side Challenges
Demand growth is one side of the equation. Supply, however, faces major bottlenecks:
Long Lead Times: New mines take 10–15 years to develop.
Geopolitical Risks: Resource nationalism, export bans, and trade tensions.
Environmental & Social Concerns: Local opposition, ESG scrutiny, and water use in mining.
Underinvestment: Years of low prices discouraged new projects in oil and mining sectors.
The result? Structural shortages that push prices higher.
6. The Role of Fossil Fuels in Transition
While the world shifts to renewables, oil and gas remain critical in the short and medium term:
Oil: Needed for transportation, petrochemicals, aviation.
Natural Gas: Acts as a “bridge fuel” to renewables.
Coal: Still dominant in India, China, and parts of Africa.
Ironically, underinvestment in fossil fuels—due to climate pressures—could trigger short-term price spikes, fueling inflation and instability.
This creates a paradox: the transition away from fossil fuels may actually make them more expensive in the interim.
7. Economic Implications of an Energy-Driven Supercycle
If the green transition sparks a commodity supercycle, the ripple effects are vast:
Inflationary Pressures
Higher commodity prices = higher costs of goods.
Potential stagflation risks.
Winners & Losers
Winners: Resource-rich nations (Chile for lithium, Indonesia for nickel, Australia for iron ore, Africa for cobalt).
Losers: Import-dependent nations (India, Japan, Europe).
Investment Shifts
Mining, renewable infrastructure, EV supply chains attract capital.
Traditional oil & gas companies under pressure but may benefit from short-term price spikes.
Currency Impact
Commodity exporters’ currencies (AUD, CAD, CLP) strengthen.
Importers’ currencies weaken.
Global Trade Patterns
New alliances forming around critical minerals (U.S. + Australia, China + Africa).
8. Geopolitics of Energy Transition
Energy has always been geopolitical. In the past, oil shaped wars, alliances, and global dominance. In the future, critical minerals will play that role.
China: Dominates rare earths and battery manufacturing.
U.S. & Europe: Trying to secure supply chains via partnerships (Inflation Reduction Act, EU Critical Raw Materials Act).
Africa & Latin America: Emerging as key battlegrounds for resources.
Middle East: Investing in hydrogen and renewables to stay relevant in a post-oil world.
This geopolitical race adds volatility and competition, feeding into the supercycle narrative.
9. Financial Markets & Commodities
A commodity supercycle doesn’t just impact physical trade—it also reshapes financial markets:
Hedge Funds & ETFs: Increasing exposure to lithium, copper, and rare earths.
Retail Investors: Gaining access via green commodity ETFs.
Central Banks: Worry about inflation and commodity-driven shocks.
Corporates: Automakers (Tesla, BYD, Ford) racing to secure long-term mineral contracts.
Commodities are no longer just “raw materials”—they are becoming strategic assets.
10. Risks to the Supercycle Thesis
While the green supercycle is a strong narrative, there are risks:
Technological Breakthroughs
Battery alternatives (sodium-ion, solid-state) could reduce lithium/cobalt demand.
Policy Shifts
Political resistance to climate policies may slow transition.
Recycling & Circular Economy
Secondary supply from recycling could offset new demand.
Economic Slowdowns
Recessions or prolonged low growth may dampen demand.
Overestimation of Speed
Energy transitions historically take decades, not years.
11. Case Studies
a. Lithium Boom
Between 2020–2023, lithium prices rose more than 500%, driven by EV demand. Though prices later corrected, the volatility highlights supply-demand mismatches.
b. Copper as “New Oil”
Goldman Sachs and other analysts call copper the “new oil” because electrification is impossible without it. Current supply projections suggest a multi-million-ton deficit by 2030.
c. Oil Paradox
Despite climate goals, oil demand hit record highs in 2023–2024, showing the sluggish pace of transition. This means both fossil fuels and green metals can rally simultaneously.
12. Future Outlook: 2025–2040
Looking ahead, the interplay of energy transition and commodities will shape economies:
Short Term (2025–2030):
High volatility, shortages in copper, lithium, and nickel.
Oil remains essential but faces supply tightness.
Prices of key metals remain elevated.
Medium Term (2030–2040):
Renewables and EVs dominate new investment.
Recycling industry scales up.
New supply from Africa/Latin America stabilizes markets somewhat.
Long Term (2040+):
Fossil fuel demand declines sharply.
Clean energy minerals dominate trade flows.
Commodity power shifts from Middle East to Latin America & Africa.
13. Conclusion
The energy transition is not just about climate—it’s a structural re-engineering of the world economy. This transformation requires vast amounts of resources, creating conditions for a commodity supercycle unlike any in history.
But unlike past cycles driven by industrial revolutions or urbanization, this one is shaped by decarbonization, technology, and geopolitics. It’s a cycle that could bring prosperity to resource-rich nations, inflationary shocks to consumers, and massive shifts in global trade.
Whether it lasts 10 years or 20, the green commodity supercycle is likely to redefine wealth, power, and progress in the 21st century.
Oil Wars and OPEC+ Price InfluencePart 1: Oil as a Geopolitical Weapon
Oil and Global Power
Ever since oil replaced coal as the primary energy source in the early 20th century, it has been intertwined with national security, industrial growth, and military power. The British Navy’s decision in 1912 to shift from coal to oil was a strategic move that highlighted the importance of securing reliable petroleum supplies. From World War I to the Iraq wars, oil has dictated alliances, interventions, and even regime changes.
Countries with abundant oil—like Saudi Arabia, Russia, Iraq, and Venezuela—have leveraged their reserves for geopolitical clout. Conversely, nations dependent on oil imports, like the United States, China, Japan, and India, have structured much of their foreign policy around securing energy supplies.
Oil Wars: A Historical Overview
“Oil wars” are not always literal wars fought exclusively for oil, but rather conflicts where oil plays a central role in the motives, strategies, or outcomes. Some major examples include:
World War II (1939–1945): Control of oil fields was critical to the Axis and Allied powers. Germany’s failed push into the Caucasus (Operation Blue) was motivated by access to Soviet oil. Japan’s attack on Pearl Harbor was partly triggered by U.S. sanctions restricting Japanese access to oil.
The Arab-Israeli Conflicts & Oil Embargo (1973): In response to Western support for Israel during the Yom Kippur War, OPEC Arab members imposed an oil embargo. Prices quadrupled, exposing the world to the geopolitical leverage of oil producers.
The Iran-Iraq War (1980–1988): Both nations targeted each other’s oil infrastructure. Tanker wars in the Persian Gulf disrupted global supplies.
The Gulf War (1990–1991): Iraq’s invasion of Kuwait was directly linked to control of oil wealth. The U.S.-led coalition intervened not only for sovereignty but also to secure global oil markets.
The Iraq War (2003): While debated, many analysts argue that oil interests influenced the U.S. decision to invade Iraq, reshaping Middle Eastern energy politics.
Syrian Civil War (2011–present): Control of oil fields and pipelines became central for different factions, with global powers eyeing energy routes as well.
Russia-Ukraine Conflict (2014–present, escalated 2022): While largely territorial and political, oil and gas pipelines have been weapons in Russia’s economic standoff with Europe. Sanctions on Russian crude reshaped global trade flows.
These conflicts illustrate that oil wars are not simply about owning oil fields—they are about controlling global supply routes, ensuring market access, and weaponizing energy for diplomatic or military leverage.
Part 2: Birth and Evolution of OPEC
Why OPEC Was Formed
By the mid-20th century, the oil industry was dominated by Western multinational corporations—the so-called “Seven Sisters” (Exxon, Shell, BP, Chevron, Gulf, Texaco, Mobil). They controlled exploration, production, and pricing, while oil-producing nations received minimal returns.
In response, five countries—Saudi Arabia, Iran, Iraq, Kuwait, and Venezuela—founded the Organization of Petroleum Exporting Countries (OPEC) in 1960 in Baghdad. Their goal was simple: to coordinate policies and secure fairer revenues.
OPEC’s Early Years
Initially underestimated, OPEC gained prominence after the 1973 oil crisis when Arab members used production cuts and embargoes as political tools. This event showcased OPEC’s ability to shock the global economy. Oil prices skyrocketed, inflation surged worldwide, and industrial nations realized their vulnerability.
In the 1980s, however, OPEC’s unity was challenged. Internal rivalries, cheating on quotas, and external pressures (like North Sea oil discoveries) weakened its control. Yet, OPEC retained the role of a “swing producer,” particularly through Saudi Arabia, which used its massive spare capacity to balance markets.
Part 3: OPEC+ and the Modern Oil Market
The Birth of OPEC+
By the 2000s, OPEC alone could not fully control prices due to the rise of non-OPEC producers, especially Russia, the U.S. (shale oil), and Canada. In 2016, in the aftermath of the oil price crash triggered by shale oil oversupply, OPEC allied with non-OPEC producers, most notably Russia, Kazakhstan, and Mexico, forming OPEC+.
This alliance was critical in rebalancing markets through coordinated production cuts. Russia brought immense weight to the group as the world’s second-largest crude exporter, while Saudi Arabia retained its role as leader.
How OPEC+ Influences Prices
OPEC+ does not directly set prices; instead, it influences them through production targets. By cutting supply, they push prices up; by raising production, they cool markets. Key mechanisms include:
Production Quotas: Members agree on collective output ceilings.
Spare Capacity: Saudi Arabia and UAE often adjust supply to stabilize markets.
Market Communication: Even announcements and forward guidance move prices, as traders react to perceived scarcity or abundance.
Emergency Meetings: OPEC+ convenes when crises—such as the COVID-19 pandemic or Russia-Ukraine war—disrupt markets.
Major OPEC+ Interventions
2016 Production Cuts: After oil crashed below $30 per barrel, OPEC+ cut 1.8 million barrels per day (mbpd), reviving prices.
COVID-19 Crash (2020): Oil demand collapsed, and at one point, U.S. crude futures went negative. OPEC+ enacted historic cuts of nearly 10 mbpd to stabilize markets.
Russia-Ukraine War (2022): With sanctions on Russia, OPEC+ resisted Western pressure to raise output, choosing instead to support Russia and maintain stability for producers. Prices surged above $120 before stabilizing.
2023–2025 Cuts: OPEC+ has continued voluntary cuts, particularly by Saudi Arabia and Russia, to defend price levels against slowing global demand and rising U.S. shale output.
Part 4: Oil Wars Meet OPEC+—A Symbiotic Relationship
Oil wars and OPEC+ decisions often overlap. For instance:
During the Iran-Iraq War, OPEC struggled to maintain unity as members fought each other.
The Gulf War pushed OPEC to stabilize supply after Kuwait’s oil fields were set ablaze.
The U.S.-Russia standoff over Ukraine has forced OPEC+ to navigate geopolitical divisions while maintaining production discipline.
Thus, OPEC+ not only manages economics but also absorbs the shocks of oil wars, sometimes exploiting them to strengthen its influence.
Part 5: The Economics of Price Influence
Why Prices Matter
Oil is not just a commodity; it’s a macroeconomic driver. Prices affect:
Producer Nations: High prices boost revenues for OPEC+ states, funding budgets and political stability. Low prices create deficits and unrest.
Consumer Nations: Importers like India, China, and Europe face inflation, trade deficits, and currency pressures when oil rises.
Global Trade: Since oil is priced in dollars, higher prices strengthen the U.S. dollar and worsen debt burdens for emerging markets.
The Price Band Strategy
OPEC+ has often targeted a “comfortable” price band, usually between $70 and $100 per barrel. Too low hurts their revenues; too high accelerates renewable adoption and incentivizes rival production. The art of OPEC+ strategy lies in maintaining this balance.
Part 6: Challenges Facing OPEC+
Despite its success, OPEC+ faces growing challenges:
U.S. Shale Oil: Flexible and responsive, U.S. shale producers ramp up output when prices rise, capping OPEC+’s influence.
Energy Transition: With the world shifting to renewables, long-term demand for oil may peak within decades, pressuring producers to maximize current revenues.
Internal Unity: Not all OPEC+ members comply with quotas. Political rivalries (Saudi-Iran, Russia-Saudi tensions) threaten cohesion.
Geopolitical Pressures: Western nations often accuse OPEC+ of manipulating markets, sometimes threatening antitrust actions.
Global Economic Slowdowns: Recessions and crises, like COVID-19, reduce demand, testing OPEC+’s ability to respond.
Part 7: The Future of Oil Wars and OPEC+
Looking ahead, oil will remain strategically vital even as renewables grow. Three possible scenarios unfold:
Continued Relevance: OPEC+ maintains its dominance through discipline and coordination, ensuring prices stay profitable.
Fragmentation: Internal rivalries and external competition weaken OPEC+, reducing its control.
Transition Era Wars: As global demand slows, competition for shrinking market share could trigger new oil wars, especially in regions like the Middle East and Africa.
At the same time, OPEC+ is exploring cooperation in renewable energy investments, hedging against a post-oil future. Yet for now, the cartel remains the single most important force in shaping global energy markets.
Conclusion
The history of oil is the history of power, conflict, and economic influence. From wars fought over fields and pipelines to the coordinated strategies of OPEC+, the price of oil has never been left to free markets alone. Instead, it has been molded by both bloodshed and diplomacy.
Oil wars remind us of the destructive potential when energy becomes a weapon of conflict. OPEC+ illustrates the stabilizing—or destabilizing—impact of collective price management. Together, they show that oil is far more than fuel; it is leverage, influence, and survival.
As the world transitions toward cleaner energy, the influence of oil may eventually decline. But in the foreseeable future, oil wars and OPEC+ price influence will remain at the core of global economics and geopolitics—deciding the fates of nations and the rhythm of the world economy.

BWP Setup: Support Holding, Momentum BuildingKeeping it simple here. Price has established a strong base between $3.20 and $3.70, showing clear signs of accumulation. All major trend indicators have just turned up, suggesting momentum is building.
Trade Plan
Entry: Current levels offer a solid technical foundation
Target: Initial TP around $4.20
Risk Management: Respect the All-Time High (ATH) resistance zone
Trailing Strategy: Trail stop losses below each new swing low to stay aligned with the trend

Simple Trade Plan on Small Cap StrengthConfirmed, BU/LPS in Play
Another promising small cap chart showing strong technical alignment. After a healthy pullback, price has now printed a significant Higher Low (HL) right at the confluence of two major 50% retracement levels (macro and local). This zone has historically acted as a magnet for liquidity and trend continuation.
Adding to the bullish case:
We've seen a Jump Across the Creek (JAC), signaling strength
Followed by a clean Back Up / Last Point of Supply (BU/LPS), confirming the retest and potential for markup
Trade Strategy
Simple Execution Plan:
Entry: Current levels offer a solid entry opportunity
Stop Loss: Just below the BU/LPS zone. If price breaks below, reassess as this could signal a failed breakout or fakeout
Take Profit: Initial TP just below the R2 yearly pivot
Trend Management: Potential Trail stop loss beneath each new swing low to stay aligned with trend structure and maximize upside

High-Risk, High-Reward Play with Dual Entry StrategyAs always with nanocap stocks, extreme caution and disciplined risk management are essential. That said, the chart structure for AQD is showing promising signs of continuation, and there are a couple of strategic ways to approach this setup:
Conservative Entry Strategy
Trigger: Entry only if price breaks above the recent high at $0.068
Stop Loss: To be placed at the newly formed structural low once confirmed
Take Profit: Initial target would be the range high; depending on market structure, a more ambitious target could be the supply structure equilibrium zone near $0.315
Staggered Entry Strategy
Price has pulled back into a key area of interest, aligning with:
Range tops
A major 50% Fibonacci retracement from the swing high of $0.65 to the low of $0.005
Low Volume Node region
If the pullback continues:
Watch for price to find support within the Fair Value Gap (FVG), especially around the equilibrium zone
A well-formed doji or bullish hammer candle in this region would offer a fantastic opportunity to scale into the position.
If price doesn't pullback into the FVG then you are already positioned and can add to the winning position when $0.068 top is broken and trail stop loss at the new SL
Until a clear structural low is formed, the provisional stop loss must be placed at $0.007 therefore highlighting the importance of proper risk management.

SPX 23% - 36% Market Crash From Recent Highs (~6,147)Structural Breakdown & Key Observations
Recent High: $6,147.43 (ATH level)
Bearish Momentum Indicators:
MACD: -40.98 (Bearish momentum increasing)
RSI: 45.11 (Weakening strength but not yet oversold)
Volume Increase: $14.18B → Indicates potential distribution.
Wyckoff Distribution Pattern Confirmation:
Potential Upthrust & Distribution Phase around 6,147 - 6,000.
If SPX loses 5,700 - 5,600, it will confirm a markdown phase → Bearish.
What Could Trigger a 23% - 36% Crash?
Macroeconomic Risks:
Rising interest rates (Liquidity tightening).
Earnings recession (Corporate profits declining).
Geopolitical risks (Oil, China, etc.).
Bond market stress → Inverted yield curve impact.
Technical Market Triggers:
Break of 5,600 → Strong Bearish Confirmation.
5,400 - 5,200 = Critical "Mid-Crash" Zone → If lost, crash risk accelerates.
VIX spikes above 30+ would confirm a volatility explosion.
✅ Bearish bias confirmed → If SPX breaks below 5,600, crash potential is HIGH.
✅ A 23-36% drawdown aligns with macro & technical risks.
✅ Watch for Fed intervention at ~4,300 - 4,750 levels → This will dictate if the market stabilizes.
🚨 Conclusion:
If SPX holds 5,600, expect a bounce → Otherwise, full markdown into a 23-36% crash is possible.
Key level to watch: 5,400 - 5,200 → This is the TRUE danger zone for a full market selloff.

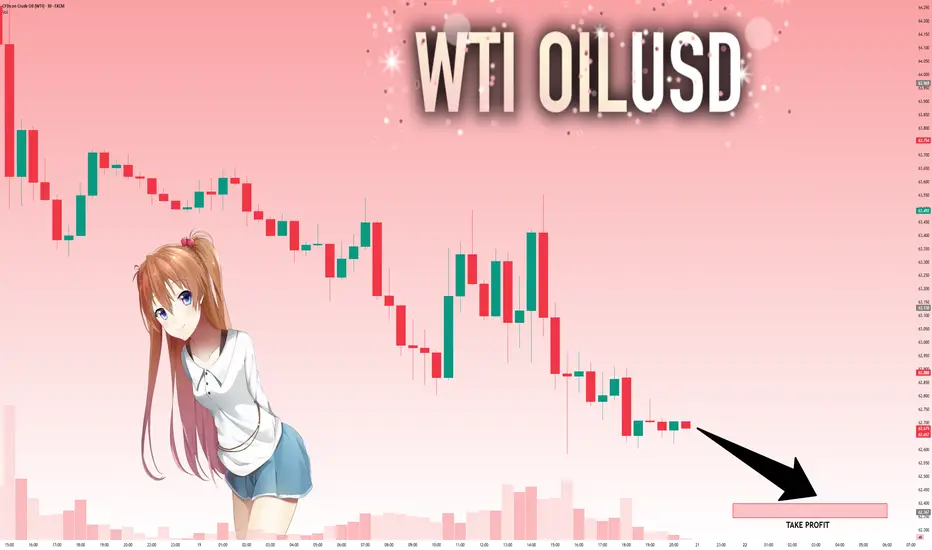
UsOil DailyWhile geopolitical tensions in the Middle East impact oil prices, technical charts often reveal the story before the headlines do.

USOIL: Strong Bearish Sentiment! Short!
My dear friends,
Today we will analyse USOIL together☺️
The in-trend continuation seems likely as the current long-term trend appears to be strong, and price is holding below a key level of 62.657 So a bearish continuation seems plausible, targeting the next low. We should enter on confirmation, and place a stop-loss beyond the recent swing level.
❤️Sending you lots of Love and Hugs❤️
NG1!: Bulls Are Winning! Long!
My dear friends,
Today we will analyse NG1! together☺️
The market is at an inflection zone and price has now reached an area around 2.920 where previous reversals or breakouts have occurred.And a price reaction that we are seeing on multiple timeframes here could signal the next move up so we can enter on confirmation, and target the next key level of 2.958.Stop-loss is recommended beyond the inflection zone.
❤️Sending you lots of Love and Hugs❤️

NI225: Next Move Is Up! Long!
My dear friends,
Today we will analyse NI225 together☺️
The price is near a wide key level
and the pair is approaching a significant decision level of 45,043.01 Therefore, a strong bullish reaction here could determine the next move up.We will watch for a confirmation candle, and then target the next key level of 45,362.30.Recommend Stop-loss is beyond the current level.
❤️Sending you lots of Love and Hugs❤️

Btc geometric downsideUsing tools forgotten about by most, and by finding appropriate anchor points, we can get great pointers to future price moves.
I think btc goes much lower than most imagine. Could be a painful couple of weeks.

$OPPUMP Token Slumps, Leads Meme Coin Losses: Pump.fun’s native token, PUMP, recently slumped, leading losses among meme coins like Dogecoin, PEPE, and BONK, as the market stumbled.
$APTPUMP Token Slumps, Leads Meme Coin Losses: Pump.fun’s native token, PUMP, recently slumped, leading losses among meme coins like Dogecoin, PEPE, and BONK, as the market stumbled.

$PUMPPUMP Token Slumps, Leads Meme Coin Losses: Pump.fun’s native token, PUMP, recently slumped, leading losses among meme coins like Dogecoin, PEPE, and BONK, as the market stumbled.

Saudi Arabian Oil CompanyTrade Plan: Saudi Arabian Oil Company
Recently had a very deep fall, now showing momentum recovery.
Entry: Wait for a bullish move confirming rejection of recent lows.
Target: Nearest resistance visible on chart.
Potential: Much higher upside if momentum continues.
Stop: Below recent swing low.
