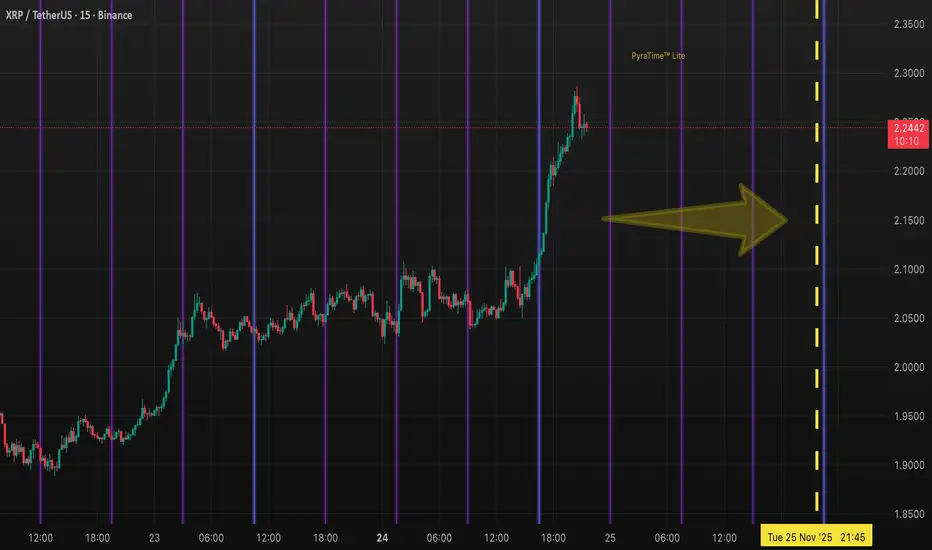
XRP: The "Time Singularity" – Rare Harmonic Convergence IncomingWe just witnessed the price respect the $2.20 geometric level perfectly. But Price is only half the equation. Time is about to take over.
If you study the chart above, look closely at the vertical timeline for Tomorrow (Nov 25) at 20:00 UTC.
⚠️ The Setup: A Harmonic Singularity Usually, our time pivots appear on specific timeframes independently. But tomorrow night, we are seeing a statistical anomaly. We have a Multi-Timeframe Convergence where the short-term high-frequency cycles and the medium-term swing cycles are hitting the exact same vertical coordinate simultaneously.
Think of this like two waves in the ocean combining to form a massive "rogue wave."
What does this mean? When these multiple pivot signals overlap, the market energy compresses. It creates a vacuum that must be filled by volatility. We are expecting a significant Expansion or Reversal event exactly within this window.
The Play: Do not front-run the time. Let the clock hit 20:00 UTC and watch the reaction.
Bullish Case: If Price is holding above $2.15 leading into 20:00, expect a violent expansion upward to challenge new highs.
Bearish Case: If Price is exhausted and below $2.15 entering this window, the time grid will likely force a sharp rejection/reversal to clear leverage.
Summary: Mathematics suggests the market is waiting for this specific minute to make its next major decision. Prepare for volatility.
Disclaimer: This is a time-based analysis using proprietary geometric modeling (PyraTime). This is not financial advice. Trade your own plan.
#XRP #Ripple #SacredGeometry #TimeAnalysis #Crypto
Gann
XAUUSD 1h chart levels for the coming week 24 to 28 November
FOREXCOM:XAUUSD
Hey Everyone,
Please see My updated 1h chart levels and targets for the coming week 24 to 28 November
The price closed on 4065 so If the price BREAKOUT UP this area for will open 4093.
The 4061 & 4067 reversal zone and key decision points; if breached, it becomes the path to 4125.
Weekly close at a 90-degree angle from the peak of 4036
If it breaks through with momentum, it will head towards 4004-3998 as it shown on the chart
The week should move like this
Monday should move to 135° degrees (down to 4036 or up to 4093)
Tuesday 150° degrees (if it moved down we will see 4006 & if up will see 4102) First move 150° and We will see rejection of a Strong price when the (moon & sun & Mercury meet I call it = Test Price Day)
Wednesday 160° degrees ((if it moved down we will see 4004 & if up will see 4125 and then 4157) If the price touches the 180-degree angle, it is heading towards a volatile day followed by a strong rise or fall.
Thursday 170° degrees (the price will move between 4125-4157) and if the price moved down wee will move 225° degrees between 4036-4006) A day approaching the peak or undermost, not a reversal day.
Yousif
H-k-O-r-E


The S&P 500: The Last Stand Into Year-EndThe 2025 bull market has culminated as presented in my previous post.
The major structure topped on October 28th, with a secondary, weaker high on November 12th. What remains now is the distribution phase into the final weeks of the year—where the market decides whether it will stabilize and potentially from a double top or begin its descent into 2026.
1. Location in Structure
Price is currently trading beneath the declining angle drawn from the October and November tops.
This angle declines at $4 per day, and has acted as the defining rhythm of the post-top decline.
Top of the year: October 28
Lower high: November 12
Current position: Beneath the angle → inside potential distribution
2. The Two Paths
The market has two paths from here:
A. Bullish Path — December Rally Trigger
To challenge the November 12th high, the S&P must close above the angle.
A confirmed break of the angle → opens the path to
📈 6,860 in the first week of December
This would represent a counter-trend rally back into the underside of the broader 2025 cycle structure.
B. Bearish Path — Rejection = Lower Prices
If price rejects at the angle, it signals:
distribution is underway
momentum remains weak
the November highs are secure as the final secondary top
In this case, lower prices into December follow naturally.
3. The Message of the Structure (And more Charts to keep up on)
The larger cycle has already ended.
We are now watching the small-scale geometry that governs how the year will close:
beneath the angle → distribution
above the angle → December rally
SUMMARY
What remains now is the micro-geometry that will determine how the year closes:
Beneath the declining angle → distribution continues
Above the angle → a December rally opens toward 6,860
While the market could attempt to press toward new highs, the probability is very low — and would be surprising given the current economic backdrop and the clear contraction emerging from a dominant sector of the market.
The structure, motion, and fundamentals all argue that the 2025 peak is already in.

AUDUSD FRGNT Daily Forecast -Q4 | W48| D25 | Y25 |📅 Q4 | W48| D25 | Y25 |
📊 AUDUSD FRGNT Daily Forecast
🔍 Analysis Approach:
I’m applying Smart Money Concepts, focusing on:
Identifying Points of Interest on the Higher Time Frames (HTFs) 🕰️
Using those POIs to define a clear trading range 📐
Refining those zones on Lower Time Frames (LTFs) 🔎
Waiting for a Break of Structure (BoS) for confirmation ✅
This method allows me to stay precise, disciplined, and aligned with the market narrative, rather than chasing price.
💡 My Motto:
"Capital management, discipline, and consistency in your trading edge."
A positive risk-to-reward ratio, paired with a high win rate, is the backbone of any solid trading plan 📈🔐
⚠️ Losses?
They’re part of the mathematical game of trading 🎲
They don’t define you — they’re necessary, they happen, and we move forward 📊➡️
🙏 I appreciate you taking the time to review my Daily Forecast.
Stay sharp, stay consistent, and protect your capital
— FRNGT 🚀
FX:AUDUSD

BTC update
If BTC breaks the red line, it would fall to the second one. Lets see how BTC reacts at the 50% level if it can get there. Worse case I think it may be down to around the purple line level.

BTC: Target 120KBTC is still consolidating, but there have been clear signs of a bottoming-out. Any level below 90K is a good buying opportunity – let’s wait for the first target of 120K!
I’ll send the signal right away as soon as the market opens every day, don’t miss out!

In future deals, you'll know I'm the greatest trader in history.Just look at how it bounces, and you'll understand exactly what I'm talking about.

#ENA/USDT : Bullish Setup#ENA
The price is moving within an ascending channel on the 1-hour timeframe and is adhering to it well. It is poised to break out strongly and retest the channel.
We have a downtrend line on the RSI indicator that is about to break and retest, which supports the upward move.
There is a key support zone in green at 0.2346, representing a strong support point.
We have a trend of consolidation above the 100-period moving average.
Entry price: 0.2409
First target: 0.2440
Second target: 0.2520
Third target: 0.2630
Don't forget a simple money management rule:
Place your stop-loss order below the green support zone.
Once you reach the first target, save some money and then change your stop-loss order to an entry order.
For any questions, please leave a comment.
Thank you.

BTC: Keep going long!As I clearly mentioned yesterday, BTC is now the perfect buying opportunity – and the market has started a solid rally right as I analyzed. Keep holding those long positions and wait for it to hit our first target of 100K!
BTC Trading Strategy for Today:
BTCUSDT Buy @ 85000 - 86000
TP: 90000 - 92000
With 15 years of focus on trading, I will provide accurate signals and strategies every day to help you achieve stable profits in the market. Don’t miss the daily analysis.

TCUSD – Weekly Gann ViewBTCUSD – Weekly Gann View 📊
We are in the 8th straight week of decline, and BTC is now sitting at an important time–price square zone on the weekly chart.
Next week looks critical – any sustained up-move from this level can push price towards the next Gann double arc region near 95,000.

EthereumETHUSD
- Bullish Channel as an corrective pattern in Short Time Frame
- Break of Structure
- RSI - Divergence
- Order Block
- S / R Level

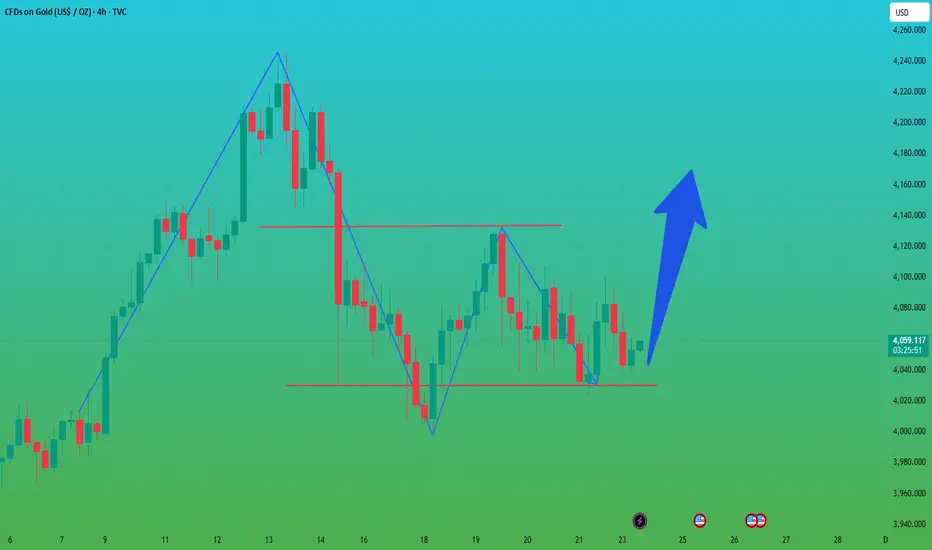
Gold remains bullish.Gold maintained its bullish structure, closing significantly higher on the daily chart. The New York closing price once again rose above the 10-day moving average (MA10) at 4105, with the 5-day and 7-day moving averages forming a golden cross and trending upwards. The RSI indicator is above the midline. On the shorter-term 4-hour and hourly charts, the Bollinger Bands are widening upwards, with the price maintaining its position in the upper half of the bands, and the moving average system showing an upward crossover. The trading strategy for gold remains unchanged from yesterday: prioritize buying on pullbacks to support levels, and only consider selling at higher levels.
At the Asian open today, gold experienced a rebound, reaching a high of 4144 before retracing. Currently, gold is still in a consolidating upward trend, and our overall bullish outlook remains unchanged. Gold is still developing within a narrowing triangle pattern on the daily chart, with the key level around $4150. A break above this level would open up further upside potential.
Key Levels:
First Support: 4108, Second Support: 4092, Third Support: 4074
First Resistance: 4150, Second Resistance: 4167, Third Resistance: 4183
Gold Intraday Trading Strategy:
BUY: 4085-4090, SL: 4070, TP: 4110-4120;
SELL: 4170-4175, SL: 4190, TP: 4150-4140;
More Analysis →

GBPUSD FRGNT Daily Forecast -Q4 | W48| D25 | Y25 |📅 Q4 | W48| D25 | Y25 |
📊 GBPUSD FRGNT Daily Forecast
🔍 Analysis Approach:
I’m applying Smart Money Concepts, focusing on:
Identifying Points of Interest on the Higher Time Frames (HTFs) 🕰️
Using those POIs to define a clear trading range 📐
Refining those zones on Lower Time Frames (LTFs) 🔎
Waiting for a Break of Structure (BoS) for confirmation ✅
This method allows me to stay precise, disciplined, and aligned with the market narrative, rather than chasing price.
💡 My Motto:
"Capital management, discipline, and consistency in your trading edge."
A positive risk-to-reward ratio, paired with a high win rate, is the backbone of any solid trading plan 📈🔐
⚠️ Losses?
They’re part of the mathematical game of trading 🎲
They don’t define you — they’re necessary, they happen, and we move forward 📊➡️
🙏 I appreciate you taking the time to review my Daily Forecast.
Stay sharp, stay consistent, and protect your capital
— FRNGT 🚀
FX:GBPUSD

Are Derivatives Powerful in the Global Trade Market?1. What Are Derivatives?
A derivative is a financial contract whose value is derived from an underlying asset. This asset could be:
Commodities like crude oil, gold, wheat, natural gas
Currencies such as USD, EUR, JPY
Equity indices like Nifty 50, S&P 500
Interest rates such as LIBOR or government bond yields
Credit instruments like corporate bonds
The most common derivatives include:
Futures
Options
Swaps
Forward contracts
In the global trade market, derivatives’ primary purpose is risk transfer, although they are also used for speculation and arbitrage.
2. The Global Influence of Derivatives
Risk Management Backbone of Global Trade
Global trade is full of uncertainties—currency fluctuations, commodity price volatility, geopolitical tensions, supply chain disruptions, and interest rate changes. Derivatives serve as insurance-like tools that allow participants to lock in future prices, hedge risks, or stabilize cash flows.
For example:
An airline company hedges jet fuel futures to protect against rising crude prices.
An importer hedges currency risk using forex forwards to avoid losses if the dollar rises.
Exporters use options to protect against weakening foreign currencies.
Without derivatives, global trade would be significantly more dangerous and unpredictable.
3. Derivatives and Commodity Markets
Commodity derivatives such as oil futures, agricultural futures, and metal contracts are essential in global trade.
Why are commodity derivatives powerful?
Price Discovery
Derivatives markets reflect real-time global supply and demand conditions. Oil prices, for example, are heavily influenced by futures traded on major exchanges.
Stabilizing Prices for Producers and Consumers
Farmers hedge crop prices to secure income; manufacturers lock in raw material prices to control costs.
Enhancing Global Trade Flows
Multinational companies plan procurement and distribution based on futures price signals.
Reducing Market Manipulation
Transparent derivative markets help in curbing cartel behavior and monopolistic pricing.
Thus, commodity derivatives are one of the strongest tools that keep global trade systems efficient and predictable.
4. Currency Derivatives – The Engine of Cross-Border Commerce
In global trade, currency fluctuations can make or break profitability. A stable currency environment is a dream, but not the reality. Hence, forex derivatives are widely used.
How currency derivatives empower global trade?
Hedging exchange rate risks
Importers/exporters use forwards, futures, and options to secure exchange rates.
Supporting multinational operations
Corporations manage exposure across dozens of currencies simultaneously.
Providing liquidity to global markets
Forex derivatives markets are the largest in the world, with trillions traded daily.
Enhancing financial stability
Countries with export-driven economies rely on currency derivatives to prevent economic shocks.
Currency derivatives act as the hidden shield that protects companies and nations from unpredictable foreign exchange swings.
5. Interest Rate Derivatives – The Heart of Financial Stability
Because interest rates influence the cost of borrowing globally, interest rate swaps and futures form the backbone of global financial markets.
Their key powers include:
Helping governments manage debt.
Allowing banks to hedge interest rate exposure.
Enabling corporations to stabilize borrowing costs.
Ensuring smoother global credit flow.
Without interest rate derivatives, global financing would be far riskier, costlier, and more unstable.
6. Derivatives as Speculative and Profit-Making Instruments
While derivatives are risk-management tools, their power also comes from:
Speculation
Traders take positions on future market movements to earn profits. This:
Increases market liquidity
Enhances price discovery
Draws global capital into trade markets
However, speculation can also increase volatility if unchecked.
Arbitrage Opportunities
Derivatives allow traders to exploit price differences in different markets:
Spot vs futures
Domestic vs international exchanges
Currency arbitrage
Commodity pricing discrepancies
Arbitrage ensures that global markets remain efficient and interconnected.
7. How Derivatives Strengthen Global Market Efficiency
Derivatives contribute to global trade in several powerful ways:
A. Increased Liquidity
Markets with high liquidity:
Reduce transaction costs
Facilitate smoother trade
Attract global investors
Improve pricing accuracy
Derivative markets like CME, ICE, NSE, LME, and SGX provide massive liquidity to commodities, currencies, and equities.
B. Better Price Stability
Derivatives reduce sharp price swings, especially in commodities and currencies. This is essential for long-term contracts and procurement.
C. Improved Risk Sharing
Derivatives distribute risks across participants:
Hedgers transfer risk
Speculators accept risk
Arbitrageurs eliminate inefficiencies
This creates a smooth ecosystem for global trade.
D. Facilitation of Global Investments
Investors use derivatives to:
Hedge portfolio risks
Gain exposure to foreign markets
Manage geopolitical risks
This flow of capital boosts global trade volumes.
8. Challenges and Risks of Derivatives
Even though derivatives are powerful, they also have downsides:
1. High leverage risk
Small price movements can cause large profits or losses.
2. Systemic risk
Excessive derivatives trading contributed to crises such as:
2008 Global Financial Crisis
LTCM collapse
Oil futures flash crashes
3. Complexity
Sophisticated instruments like credit default swaps (CDS) are difficult to understand.
4. Counterparty risk
Failure of one party can create a chain reaction.
Despite these risks, regulatory reforms and clearinghouses have made derivative markets safer and more transparent.
9. The Future of Derivatives in Global Trade
Derivatives are becoming more powerful due to:
Digital platforms and electronic trading
AI-driven risk models
Expansion of global markets (India, China, ASEAN)
Growth in commodity and currency volatility
Rise of ESG and carbon credit derivatives
The next decade will see derivatives become even more integrated with global supply chains, energy markets, and financial systems.
Conclusion
Yes, derivatives are extremely powerful in the global trade market. They are not merely financial instruments but essential tools that support world commerce by:
Managing risks
Stabilizing prices
Enhancing liquidity
Improving efficiency
Supporting international investments
Strengthening financial stability
From farmers to oil companies, from banks to governments, derivatives underpin decisions and strategies across the global trade ecosystem. Without them, global markets would be less predictable, less efficient, and far more vulnerable to shocks.
EURUSD FRGNT Daily Forecast -Q4 | W48| D25 | Y25 |📅 Q4 | W48| D25 | Y25 |
📊 EURUSD FRGNT Daily Forecast
🔍 Analysis Approach:
I’m applying Smart Money Concepts, focusing on:
Identifying Points of Interest on the Higher Time Frames (HTFs) 🕰️
Using those POIs to define a clear trading range 📐
Refining those zones on Lower Time Frames (LTFs) 🔎
Waiting for a Break of Structure (BoS) for confirmation ✅
This method allows me to stay precise, disciplined, and aligned with the market narrative, rather than chasing price.
💡 My Motto:
"Capital management, discipline, and consistency in your trading edge."
A positive risk-to-reward ratio, paired with a high win rate, is the backbone of any solid trading plan 📈🔐
⚠️ Losses?
They’re part of the mathematical game of trading 🎲
They don’t define you — they’re necessary, they happen, and we move forward 📊➡️
🙏 I appreciate you taking the time to review my Daily Forecast.
Stay sharp, stay consistent, and protect your capital
— FRNGT 🚀
FX:EURUSD

Q4 | W48| D25 | Y25 | - EURGBP FRGNT Daily Forecast📅 Q4 | W48| D25 | Y25 |
📊 EURGBP FRGNT Daily Forecast
🔍 Analysis Approach:
I’m applying Smart Money Concepts, focusing on:
Identifying Points of Interest on the Higher Time Frames (HTFs) 🕰️
Using those POIs to define a clear trading range 📐
Refining those zones on Lower Time Frames (LTFs) 🔎
Waiting for a Break of Structure (BoS) for confirmation ✅
This method allows me to stay precise, disciplined, and aligned with the market narrative, rather than chasing price.
💡 My Motto:
"Capital management, discipline, and consistency in your trading edge."
A positive risk-to-reward ratio, paired with a high win rate, is the backbone of any solid trading plan 📈🔐
⚠️ Losses?
They’re part of the mathematical game of trading 🎲
They don’t define you — they’re necessary, they happen, and we move forward 📊➡️
🙏 I appreciate you taking the time to review my Daily Forecast.
Stay sharp, stay consistent, and protect your capital
— FRNGT 🚀
FX:EURGBP

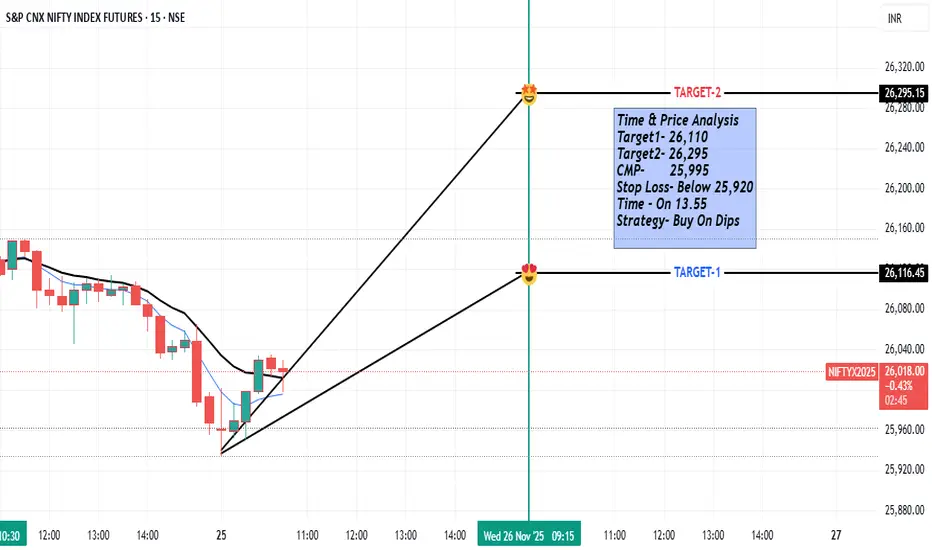
Precision Time & Price Analysis — Big Move Loading Above 26,040 NIFTY Time & Price Analysis
Clean Setup. High Probability. Precision Trading.**
The market is behaving exactly in line with the Time & Price roadmap —
a controlled dip, steady demand, and a clean structure preparing for the next push.
This setup continues to favour Buy on Dips.
📌 Key Levels You Must Track
🔹 CMP: 25,995
🔹 Target 1: 26,110
🔹 Target 2: 26,295
🔹 Stop Loss: Below 25,920
🔹 Strategy: Buy on Dips — demand pockets are still active.
⏳ Time Trigger
⏰ 13:55 PM
A crucial Time Node where volatility can expand.
If price aligns here → expect a clean directional shift.
📊 Intraday Outlook
Today’s structure suggests:
✔ Market is attempting a Testing Action
✔ Weak hands have been shaken out
✔ Demand zones are still holding firm
✔ Intraday bias stays positively tilted as long as 25,920 holds
✔ Any dip towards demand zones can offer low-risk, high-reward entries
Intraday View:
➡ Expect a slow morning drift
➡ Watch for consolidation around 26,000
➡ Momentum likely to activate post 1:55 PM Time Trigger
➡ If price stabilizes above 26,040 → first target unlocks smoothly
➡ Aggression only needed above 26,110
🔥 What the Structure Suggests
✔ High-quality demand absorbing supply
✔ No aggressive selling pressure
✔ Time & Price convergence signalling a bounce
✔ Short-term trend remains constructive
This is the type of setup where a small dip…
turns into a clean upside push once timing aligns.
Great traders! I'm going long on gold!The gold market opened slightly higher this week before retreating, with overall volatility remaining relatively mild and market sentiment trending towards caution. After the previous sustained upward trend was interrupted, gold prices entered a correction and adjustment phase. The $4,000 mark has become a key level for the battle between bulls and bears. Although the one-sided upward trend failed to continue, recent price performance suggests that downside potential has been significantly limited, with gold prices remaining above $4,000. In the absence of significant fundamental news, a range trading strategy is recommended, appropriately seizing opportunities in both long and short positions to optimize returns while managing risk.
Today's trading plan is as follows: Establish long positions in batches within the $4030-$4050 range. Adjustments will be made and notifications will be provided if significant market changes occur.
The above represents only my personal thoughts. If you find it helpful, please like and follow to show your support! Please note that any strategy is time-sensitive, and strategies will change as market conditions evolve. I will notify you in the channel based on the actual market situation!
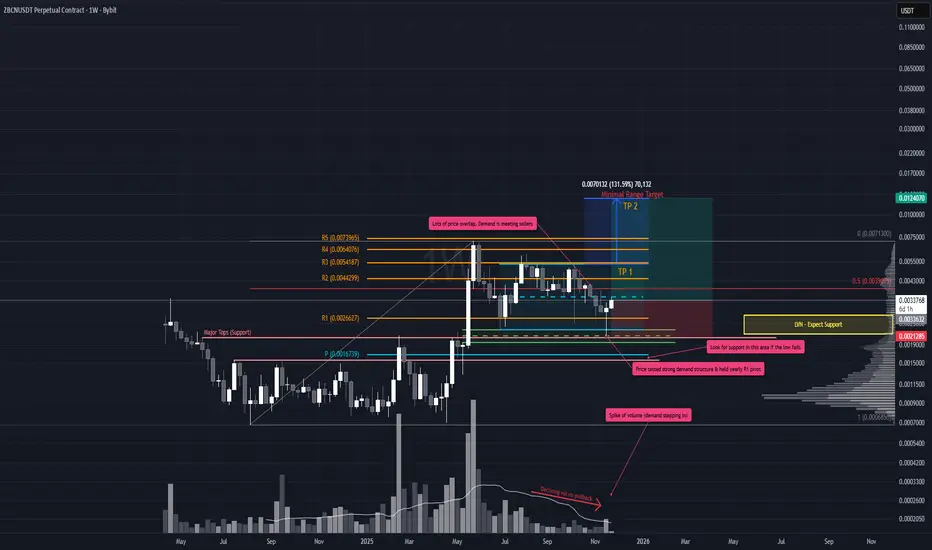
Range Reclaim with Volume SpikeZBCN looking very clean here. After breaking out of the range, price has retraced roughly 70% back toward the range tops. Despite the heavy bearish sentiment across crypto, the chart structure is telling a different story.
The pullback shows declining volume with overlapping price action, a classic sign of buyers quietly absorbing supply. In the week ending 23 November, price drove sharply into a key support zone before closing back inside the range. The weekly candle printed a bullish hammer on elevated volume, signaling potential strength.
Yes, further downside is always possible if sellers return with conviction, but right now the setup is constructive.
Trade Scenario
• Entry: Position can be initiated here.
• Stop Loss (SL): Use the hammer candle low as invalidation.
• If that level fails, look for the next major support highlighted on the chart.
• Take Profit (TP):
• First target: range tops.
• Trail SL as price moves, aiming for a full 100% range extension.
Reminder: No setup is guaranteed. Risk management is non‑negotiable. Protect capital first, profits second.
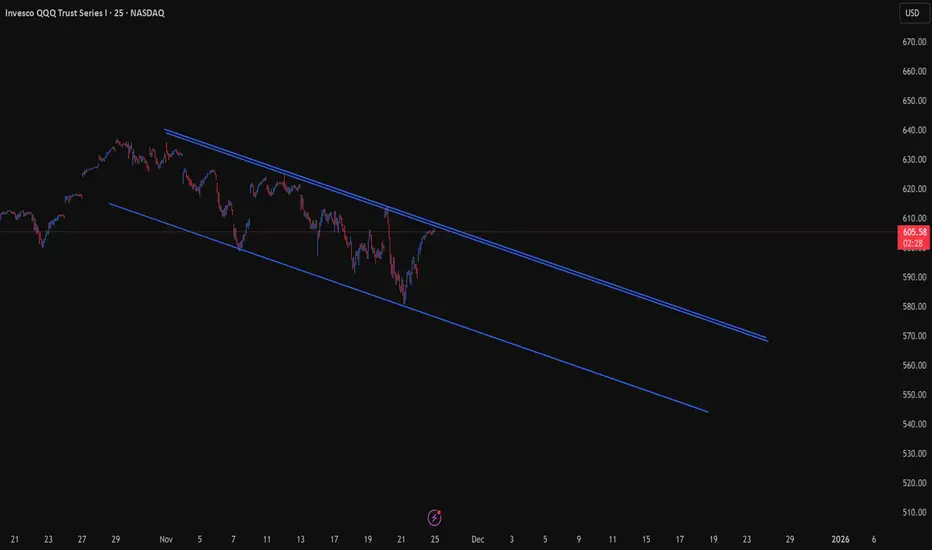
The Geometry of the Week: QQQ Inside the Declining ChannelThis week’s market map centers on a single dominant structure —
a perfect declining parallel channel guiding QQQ through the entire November decline.
Price is now rallying back into the upper rail, the same geometric boundary that rejected every advance this month.
This rail rises at a 1×2 natural angle, meaning:
1 trading day = $2 of vertical movement
A classic slope in fast corrective markets.
1. What Must Happen for the Market to Rise
For QQQ to reclaim strength and retest the November highs, one condition must be met:
QQQ needs a daily close above the upper rail of the declining channel.
Nothing less.
This angle is the gatekeeper.
Without a close above, upside follow-through is limited.
And if price rejects off the trendline?
→ The geometry remains intact
→ The downtrend holds
→ Lower prices become the natural next step
In geometric markets, rejection at the angle is the signal.
2. Compass Reading for the Week
Primary Trend: Down
Secondary Move: Counter-trend rally
Market Location: Testing upper rail resistance
Key Zone: 606-608
Bias: Watch for daily close above or rejection at the angle.
Market Knots Reading — Bull vs. Bear Bias
🔵 Bullish Bias
What the bulls can build a case from:
1. Acceleration is Positive
Acceleration has flipped above zero and is holding there.
This is the earliest sign of internal energy returning.
→ Trend force is rising
→ Short-term conditions favor continuation upward.
2. Speed Is Rising From the Lows
Speed has made a clear higher low and is now climbing toward the mid-range.
→ The market is gaining internal velocity
→ Bulls are defending the short-term structure
3. Price Is Rising Cleanly Within the Channel
On the 50-min view, price is stair-stepping upward and respecting short-term support.
→ Short-term bias: Up
Bull Case Summary:
Acceleration > 0 + rising Speed =
Bulls have the initiative going into the next rail test.
🔴 Bearish Bias
What the bears can counter with:
1. Speed Still Below the October Highs
Even at 125, Speed is far below the momentum peaks seen earlier.
→ The current rally remains weaker than the prior thrusts
→ Internal strength is not matching price strength
2. Rising Into a Major Structure
Price is pushing directly into the upper parallel rail.
→ This is where rallies have consistently failed
→ Bears control the geometry, even if bulls control the short-term motion
3. Acceleration Is Positive But Weak
Acceleration is above zero but not expanding aggressively.
→ This is not “trend breakout” force
→ It’s counter-trend lift inside a broader downtrend
Bear Case Summary:
Speed < November peaks + Weak Acceleration =
Rally may exhaust at the upper rail and fail.
XRP’s Final Bull Run Mapped Out: $33 → $186 → $285 → $1,115.
• Path A (Red) = Immediate delivery
• Path B (Blue) = Normal delivery
• Path B #2 = ONLY triggered if price stays suppressed — final backup execution in Jan 1–6, 2026
This model has 3 possible executions, but only 2 primary paths. Path B #2 only happens if suppression continues.
🔴 PATH A — Immediate Delivery
(Starts: Nov–Dec 2025)
First impulse: $30–$33
Secondary spike: $186
Consolidation → climb toward $285
Final blow-off targets later: $1,115
This is the fast outcome.
🔵 PATH B — Standard Delivery
(Starts: Jan–Mar 2026)
First stop: $30–$33
Volatility waves through Feb–March
Breaks into the macro expansion zone
Major target: $285
Final target: $1,115
This path is smoother and slightly delayed.
🔵 PATH B #2 — Suppressed Variant (Only if A and B fail)
If price stays held down → algorithm resets and fires between Jan 1–6, 2026
Same opening move: $30–$33
Same structure as Path B afterward
Same macro targets: $285 → $1,115
📅 Key Timing Windows
Nov 2025 → Jan 2026: Entry + breakout window
Mar 21, 2026: Mid-cycle reversal point
Aug 14, 2026: Warning Zone
Oct–Nov 2026: Pullback
Jan 1, 2027: Final liquidity window
🔑 Summary
Only Path A or Path B are required. Path B #2 is the failsafe if price remains artificially suppressed. All three lead to the same final targets.
— NeverWishing

60 SECOND GBPUSD BREAKDOWN - Q4 | W48 | D24| Y25 |📅 Q4 | W48 | Y25 |
📊 GBPUSD FRGNT BREAKDOWN
🔍 Analysis Approach:
I’m applying Smart Money Concepts, focusing on:
Identifying Points of Interest on the Higher Time Frames (HTFs) 🕰️
Using those POIs to define a clear trading range 📐
Refining those zones on Lower Time Frames (LTFs) 🔎
Waiting for a Break of Structure (BoS) for confirmation ✅
This method allows me to stay precise, disciplined, and aligned with the market narrative, rather than chasing price.
💡 My Motto:
"Capital management, discipline, and consistency in your trading edge."
A positive risk-to-reward ratio, paired with a high win rate, is the backbone of any solid trading plan 📈🔐
⚠️ Losses?
They’re part of the mathematical game of trading 🎲
They don’t define you — they’re necessary, they happen, and we move forward 📊➡️
🙏 I appreciate you taking the time to review my Daily Forecast.
Stay sharp, stay consistent, and protect your capital
— FRNGT 🚀
FX:GBPUSD
