GBPUSD FRGNT Daily Forecast -Q4 | W47| D19 | Y25 |📅 Q4 | W47| D19 | Y25 |
📊 GBPUSD FRGNT Daily Forecast
🔍 Analysis Approach:
I’m applying Smart Money Concepts, focusing on:
Identifying Points of Interest on the Higher Time Frames (HTFs) 🕰️
Using those POIs to define a clear trading range 📐
Refining those zones on Lower Time Frames (LTFs) 🔎
Waiting for a Break of Structure (BoS) for confirmation ✅
This method allows me to stay precise, disciplined, and aligned with the market narrative, rather than chasing price.
💡 My Motto:
"Capital management, discipline, and consistency in your trading edge."
A positive risk-to-reward ratio, paired with a high win rate, is the backbone of any solid trading plan 📈🔐
⚠️ Losses?
They’re part of the mathematical game of trading 🎲
They don’t define you — they’re necessary, they happen, and we move forward 📊➡️
🙏 I appreciate you taking the time to review my Daily Forecast.
Stay sharp, stay consistent, and protect your capital
— FRNGT 🚀
FX:GBPUSD
GBPUSD

Hellena | GBP/USD (4H): SHORT to min wave "4" area 1.30100.Colleagues, I haven't reviewed the pound for a long time and now I finally did it)
The wave layout shows that the downward movement is not over yet. I think that wave “4” will soon complete its development and the impulse in wave ‘5’ will start, which will complete the big correction “C”. The minimum target is the support area at 1.30103.
Further we will observe the activity in this area.
Manage your capital correctly and competently! Only enter trades based on reliable patterns!

Stop!Loss|Market View: SILVER🙌 Stop!Loss team welcomes you❗️
In this post, we're going to talk about the near-term outlook for SILVER ☝️
Potential trade setup:
🔔Entry level: 50.69205
💰TP: 47.22310
⛔️SL: 52.42652
"Market View" - a brief analysis of trading instruments, covering the most important aspects of the FOREX market.
👇 In the comments 👇 you can type the trading instrument you'd like to analyze, and we'll talk about it in our next posts.
💬 Description: Based on yesterday's metal price close, a slight rally in both silver and gold is expected today. Silver is expected to rally to 52 in order to liquidate sellers. The most reliable entry point will be a false breakout at 51.30625, which is expected soon. The downside target is seen at key support today—46.20000—while the medium-term outlook is near 40.
Thanks for your support 🚀
Profits for all ✅

Stop!Loss|Market View: GBPUSD🙌 Stop!Loss team welcomes you❗️
In this post, we're going to talk about the near-term outlook for the GBPUSD currency pair☝️
Potential trade setup:
🔔Entry level: 1.32300
💰TP: 1.30490
⛔️SL: 1.33190
"Market View" - a brief analysis of trading instruments, covering the most important aspects of the FOREX market.
👇 In the comments 👇 you can type the trading instrument you'd like to analyze, and we'll talk about it in our next posts.
💬 Description: The pound remains a selling priority, but potential manipulation remains near 1.31590. Therefore, a short-term upside move to 1.32000 - 1.32500 is likely, from where, under a more aggressive scenario, selling could be considered. Furthermore, a more medium-term downside target of 1.27000 - 1.28000 remains.
Thanks for your support 🚀
Profits for all ✅

GBPCHF → Countertrend correction. Retest of resistance FX:GBPCHF is testing key resistance at 1.0515 as part of a countertrend correction. Bears are behaving quite aggressively in the current market...
The global trend is downward. After retesting the local bottom, the currency pair is forming a correction to the previously broken consolidation border.
The key area of interest is 1.0515, and bears are trying to hold it. The battle for the zone has been going on for several hours. In extreme cases, a retest of 1.054 is possible before a decline.
A false breakout of resistance (consolidation border) is forming as part of a countertrend movement...
Resistance levels: 1.0515, 1.0542
Support levels: 1.0486, 1.0443
If the bears keep the price below 1.0515, completing the reversal pattern, this could trigger a further decline. Otherwise, the currency pair may form a short squeeze and test 1.0542 before declining...
Best regards, R. Linda!

GBP/USD – Intraday Bearish Structure Maintains PressureGBP/USD – Intraday Bearish Structure Maintains Pressure, Key Support Retest in Focus
GBP/USD continues to trade within a clear lower-high structure on the H1 timeframe. Despite short-term consolidations, the market is repeatedly rejecting the same supply zones, indicating that sellers remain in control. Price is now moving toward the major support zone that has acted as the base of multiple reactions.
The chart structure suggests that a bearish continuation remains highly probable unless buyers reclaim the upper supply area.
Technical Breakdown
1. Market Structure
The pair is forming repetitive lower highs, confirming a sustained intraday downtrend.
Each rally toward resistance has been followed by aggressive selling, showing a textbook bearish swing structure.
2. Key Resistance Zones
These levels continue to cap upside momentum:
1.3200 – 1.3215: Main supply zone where previous rallies were rejected.
1.3155 – 1.3170: Minor resistance aligned with EMA rejection and lower-high formation.
Unless price breaks above these zones with strong bullish candles, sellers maintain full advantage.
3. Key Support Zones
1.3110 – 1.3120: Primary support zone and current bearish target.
Below this level, the next support comes near 1.3075.
Multiple touches of this zone indicate liquidity buildup; a breakout could accelerate bearish momentum.
4. EMA and Momentum
Price is trading below the 9-period EMA, signaling continuation pressure.
EMA is acting as dynamic resistance throughout the structure.
RSI remains neutral-to-weak, providing room for further decline.
5. Pattern Formation
The repeated lower-high pattern resembles a descending structure, often leading to a support breakdown.
The bearish arrow in your setup aligns with this technical bias.
Trade Idea (Based on Chart Setup)
Bias: Bearish continuation as long as price stays below 1.3170
Entry Zone
1.3135 – 1.3140 (current rejection area)
Stop Loss
1.3155
Placed above minor resistance and recent lower high.
Take Profit
Primary TP: 1.3110
Extended TP: 1.3075 if bearish momentum accelerates.
This setup offers a clean R:R and follows the established trendline and structural flow.
Conclusion
GBP/USD remains under clear downward pressure, with repeated rejections confirming that sellers are defending resistance aggressively. As long as the pair trades below 1.3170, the market favors a continuation toward 1.3110 and potentially lower afterward.
If you find this analysis helpful, remember to follow and save this post for more daily trading strategies.

GBP/USD, GBP/CAD, GBP/AUD Techical SetupsUK CPI data in 8hrs could spark some volatility across British pound pairs. Even so, price action has presented several bearish clues across GBP/USD, GBP/CAD and GBP/AUD.
Matt Simpson, Market Analyst at City Index

GBP/USD – Major Resistance Rejection SetupThis GBP/USD weekly chart shows a long-term ascending channel driving price toward a multi-year diagonal resistance zone. Each rally into this resistance has produced a strong rounded top, signaling that buyers lose strength exactly at the upper trendline — and sellers take control.
Price is again approaching this same resistance after completing another rounded cycle. This behavior suggests a repeating pattern:
Resistance → Rejection → Drop to Support.
If price rejects from the resistance again, the first downside target is the 1.2700 area, followed by a deeper drop toward the major weekly support near 1.2200. A break of this level opens the door for a high-timeframe bearish continuation down toward 1.0650, where the next macro demand zone sits.
However, if bulls defend the mid-level and push back up strongly, another retest of the diagonal resistance becomes likely — but historically this area has acted as a ceiling, not a breakout zone.
This chart is basically showing a macro exhaustion pattern, with the market respecting structure cleanly:
Rally → Exhaust → Correction → Repeat.

GBPUSD Buy Strategy: From Safe Zone to the TopGuys,
I have prepared a GBPUSD analysis for you.
📌 When GBPUSD reaches the 1.31642 - 1.31495 zone, I will open a buy position, aiming for the 1.37937 level as my target.
My friends, I share these analyses thanks to each like I receive from you. I sincerely thank all of you who support me with your appreciation.

EUR/USD | Euro Preparing for a Bearish Reversal Zone! (READ)By analyzing the EURUSD chart on the 6H timeframe, we can see the price trading around 1.1590. I expect a small push upward first, followed by a potential rejection from the 1.16085–1.1640 zone. If we get a strong rejection there, a powerful bearish move could follow.
This bearish scenario only fails if the price breaks above 1.1660.
Please support me with your likes and comments to motivate me to share more analysis with you and share your opinion about the possible trend of this chart with me !
Best Regards , Arman Shaban

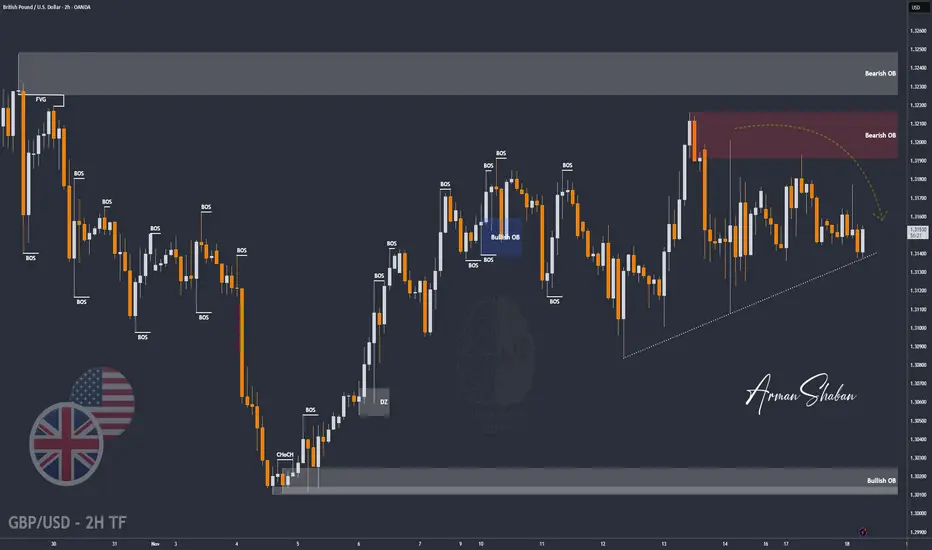
GBP/USD | Pound Setting Up for a Pullback Move! (READ CAPTION)By analyzing the GBPUSD chart on the 2H timeframe, we can see the price trading around 1.3150. I expect a small move to the upside first, followed by a stronger drop.
Key supply zones are 1.31770, 1.31910–1.32170, and 1.32250–1.32490.
This analysis will be updated soon.
Please support me with your likes and comments to motivate me to share more analysis with you and share your opinion about the possible trend of this chart with me !
Best Regards , Arman Shaban
EUR/USD Bearish Setup – 1hEUR/USD 15M Analysis:
Price is approaching marked seller zones. Expecting a potential retracement toward 1.15897–1.15986 before a bearish rejection. A clean break below 1.15832 could open the path toward 1.15728 and lower levels. Watching market structure, liquidity sweep, and bearish order blocks for confirmation. This is a technical outlook, not financial advice.

Fundamental Market Analysis for November 18, 2025 GBPUSDThe GBPUSD pair is holding near 1.31500–1.31600, as the dollar is supported by cautious market sentiment ahead of upcoming US data and by revised expectations for a Fed rate cut. Any strong figures on employment or inflation in the US strengthen the case for keeping rates high for longer and limit the upside potential for the pound.
On the UK side, pressure comes from weak growth and signs of a cooling labor market. Recent GDP figures confirmed only modest expansion, while labor market reports indicate slower job creation, which increases the likelihood of a Bank of England rate cut next year.
Additional pressure on the pound comes from the high sensitivity of households and businesses to borrowing costs and from uncertainty around fiscal policy. Against the backdrop of a strong dollar and growing expectations of a softer stance from the Bank of England, fundamental factors tilt the balance in favor of further GBPUSD downside, which supports short positions from around 1.31550 with a target near 1.30550.
Trading recommendation: SELL 1.31550, SL 1.32050, TP 1.30550

DXY FRGNT Daily Forecast - Q4 | W47| D18 | Y25 |📅 Q4 | W47| D18 | Y25 |
📊 DXY FRGNT Daily Forecast
🔍 Analysis Approach:
I’m applying Smart Money Concepts, focusing on:
Identifying Points of Interest on the Higher Time Frames (HTFs) 🕰️
Using those POIs to define a clear trading range 📐
Refining those zones on Lower Time Frames (LTFs) 🔎
Waiting for a Break of Structure (BoS) for confirmation ✅
This method allows me to stay precise, disciplined, and aligned with the market narrative, rather than chasing price.
💡 My Motto:
"Capital management, discipline, and consistency in your trading edge."
A positive risk-to-reward ratio, paired with a high win rate, is the backbone of any solid trading plan 📈🔐
⚠️ Losses?
They’re part of the mathematical game of trading 🎲
They don’t define you — they’re necessary, they happen, and we move forward 📊➡️
🙏 I appreciate you taking the time to review my Daily Forecast.
Stay sharp, stay consistent, and protect your capital
— FRNGT 🚀
TVC:DXY

Stop!Loss|Market View: EURUSD🙌 Stop!Loss team welcomes you❗️
In this post, we're going to talk about the near-term outlook for the EURUSD currency pair☝️
Potential trade setup:
🔔Entry level: 1.15351
💰TP: 1.14184
⛔️SL: 1.15903
"Market View" - a brief analysis of trading instruments, covering the most important aspects of the FOREX market.
👇 In the comments 👇 you can type the trading instrument you'd like to analyze, and we'll talk about it in our next posts.
💬 Description: The main scenario for selling via a breakout of the 1.15500 - 1.16000 support area remains. The USD is gaining momentum and is likely to continue strengthening in the medium term. Against this backdrop, a shorter-term sell-off is being looked for. The lows from early this week serving as a potential sell entry point. Downside targets are considered as low as 1.14000.
Thanks for your support 🚀
Profits for all ✅

Sterling Strengthens: Price Action Confirms Buyer ControlPrice has been trending downward, respecting a clean descending trendline across multiple sessions. However, the market has now tapped into a key support zone, where buyers previously showed strong interest.
Key Observations
🔹 Support Zone Rejection
Price reacted sharply from the marked support area (orange zone), suggesting fresh demand entering the market.
🔹 Trendline Break + CHoCH
The latest bullish impulse breaks above the descending trendline and prints a CHoCH, signaling a potential shift from bearish to bullish structure.
🔹 Tokyo Session Breakout
During Tokyo, price consolidated before breaking upward with strong momentum—indicating liquidity sweep followed by bullish intent.
🔹 Weak High as Target
The next logical liquidity target is the Weak High, where buy-side liquidity sits. This aligns with your marked target zone.
Bullish Outlook
Price is expected to retrace slightly toward the breakout area (blue circle), then continue higher toward 1.31900, the key target zone.
As long as structure holds above support and the bullish CHoCH remains intact, the short-term bias favors continued upside.

Wait for a potentil breakout?Cable (GBP/USD) is reacting off the pivot level, and a breakout below this area could drive the price toward the 1st support.
Pivot: 1.3151
1st Support: 1.3112
1st Resistance: 1.3179
Disclaimer:
The opinions given above constitute general market commentary and do not constitute the opinion or advice of IC Markets or any form of personal or investment advice.
Any opinions, news, research, analyses, prices, other information, or links to third-party sites contained on this website are provided on an "as-is" basis, are intended to be informative only, and are not advice, a recommendation, research, a record of our trading prices, an offer of, or solicitation for, a transaction in any financial instrument and thus should not be treated as such. The information provided does not involve any specific investment objectives, financial situation, or needs of any specific person who may receive it. Please be aware that past performance is not a reliable indicator of future performance and/or results. Past performance or forward-looking scenarios based upon the reasonable beliefs of the third-party provider are not a guarantee of future performance. Actual results may differ materially from those anticipated in forward-looking or past performance statements. IC Markets makes no representation or warranty and assumes no liability as to the accuracy or completeness of the information provided, nor any loss arising from any investment based on a recommendation, forecast, or any information supplied by any third party.

GBP/USD: Trouble Brewing for Bulls?A revisit of the November lows may be on the cards for cable, coiling within what resembles a rising wedge following its lurch lower in October. Sitting on uptrend support and showing little inclination to bounce meaningfully in recent days, traders should be on alert for a potential downside break.
If we see a bearish wedge break, shorts could be established beneath the level with a stop above for protection, targeting 1.3100 initially. Unless the move is definitive, a close beneath the uptrend would be preferable before entering the position.
As a bearish continuation pattern, convention suggests we may see the starting point for the wedge revisited, putting 1.3010 on the radar as a level to assess whether to hold, add or reverse should the price return there.
There’s evidence that downside strength is building again, with RSI (14) breaking its uptrend before reversing away from the neutral 50 level. MACD remains in negative territory but has yet to cross the signal line from above. If that occurs, it will increase conviction in the trade.
Good luck!
DS

GBPUSD OUTLOOK 17 - 21 NOV 2025Last week we saw UK Claimant count come in higher than expected indicating a slowing down of the labor market. This Wednesday we have a forecast of 3.6% CPI which is lower than the previous 3.8%. If CPI comes in as expected that will be bearish on the the Pound and more so if it is lower than expected.
With lower CPI and higher unemployment the logical outcome should be for interest rates being reduced which is bearish for GBP.
On the dollar we have sticky inflation which came in at 3%. Lower than the expected 3.1% however higher than the previous reading of 2.9%. This week we have FOMC minutes on Wednesday and NFP on Thursday. NFP forecast is 58K which is much higher than the previous 28K. NFP coming in as expected or better yet higher would support my GBPUSD short idea as the FED should consider the risk to inflation more. Powell also said that a cut in December is not locked in and they will also be looking at the data for inflation and the labor market to make their final decision.
This analysis outlines everything I want to see for a high probability short on this pair both fundamentally and technically. For a bullish scenario all figures would be the opposite of what I want to see.
Trade safe and don't get margin called.

Cable Surge Potential: MA Breakout Signals Bullish Pathway📊 GBP/USD "THE CABLE" | Bullish Breakout Setup - Swing Trade Alert 🚀
🎯 TRADE PLAN: BULLISH MOMENTUM PLAY
📍 Entry Strategy:
✅ Pending BUY Order @ 1.32000 (Post Moving Average Breakout)
⏰ Wait for confirmed breakout + candle close above the MA
🛡️ Stop Loss:
❌ Conservative SL @ 1.30500 (-150 pips)
⚠️ RISK DISCLAIMER: This is MY stop loss based on my strategy. Adjust according to YOUR risk tolerance, position sizing & trading plan. Trade at your own risk.
🎯 Take Profit Target:
💰 Primary TP @ 1.33700 (+170 pips)
📊 Moving Average acting as resistance + overbought zone confluence
⚠️ PROFIT DISCLAIMER: Lock partials on the way up. Trail your stops. This is NOT financial advice - manage YOUR exits based on YOUR strategy.
🔍 TECHNICAL ANALYSIS:
📈 Trend: Bullish structure forming
🧱 Key Level: 1.32000 breakout zone = trigger
🚧 Resistance: MA + 1.33700 zone acting as "police barricade"
⚡ Setup: Classic MA breakout + momentum continuation
💱 CORRELATED PAIRS TO WATCH:
Positive Correlation (Move Together):
EUR/USD - Currently @ 1.1609 - Both pairs influenced by USD strength/weakness. If EUR/USD rallies, GBP/USD typically follows.
GBP/JPY - Currently @ 203.39 - Confirms GBP strength across multiple pairs
Inverse Correlation (Move Opposite):
USD/JPY - Currently @ 154.69 - USD strength indicator. If USD/JPY falls, it signals USD weakness = GBP/USD strength
DXY (Dollar Index) - Watch for DXY weakness to confirm GBP/USD upside
Key Correlation Insight:
🔗 If you see EUR/USD breaking resistance + DXY breaking support simultaneously = HIGH probability GBP/USD follows through to target
⚠️ RISK MANAGEMENT RULES:
✔️ Never risk more than 1-2% of account per trade
✔️ Set alerts, don't chase the market
✔️ Respect your stop loss - NO EXCEPTIONS
✔️ Take partials at key levels (1.3250, 1.3300)
✔️ Monitor correlations - if EUR/USD reverses, watch GBP/USD closely
👊 Good luck, OG Traders! Drop a 👍 if you're watching this setup!

GBPJPY:LIVE TRADEHello friends
With the breakdown of the ascending channel, you can see that the power has fallen to the sellers and now the price is expected to see lower targets.
Don't forget risk and capital management.
*Trade safely with us*

XAU/USD | Gold Holding Strong – More Upside If Support Holds!By analyzing the #Gold chart on the 4H timeframe, we can see that after a pullback, the price climbed again to $4112 before making a small correction. It’s now trading around $4078.
If gold can hold above $4048, we can expect another move to the upside.
The next potential targets are $4106, $4112, $4133, and $4159.
Please support me with your likes and comments to motivate me to share more analysis with you and share your opinion about the possible trend of this chart with me !
Best Regards , Arman Shaban

GBPUSD Bearish below 1.3220 resistanceThe GBPUSD pair is currently trading with a bearish bias, aligned with the broader downward trend. Recent price action shows a retest of the falling resistance, suggesting a temporary relief rally within the downtrend are possible.
Key resistance is located at 1.3220, a prior consolidation zone. This level will be critical in determining the next directional move.
A bearish rejection from 1.3220 could confirm the resumption of the downtrend, targeting the next support levels at 1.3100, followed by 1.3050 and 1.3000 and 1.2950 over a longer timeframe.
Conversely, a decisive breakout and daily close above 1.3220 would invalidate the current bearish setup, shifting sentiment to bullish and potentially triggering a move towards 1.3290, then 1.3360.
Conclusion:
The short-term outlook remains bearish unless the pair breaks and holds above 1.3220. Traders should watch for price action signals around this key level to confirm direction. A rejection favours fresh downside continuation, while a breakout signals a potential trend reversal or deeper correction.
This communication is for informational purposes only and should not be viewed as any form of recommendation as to a particular course of action or as investment advice. It is not intended as an offer or solicitation for the purchase or sale of any financial instrument or as an official confirmation of any transaction. Opinions, estimates and assumptions expressed herein are made as of the date of this communication and are subject to change without notice. This communication has been prepared based upon information, including market prices, data and other information, believed to be reliable; however, Trade Nation does not warrant its completeness or accuracy. All market prices and market data contained in or attached to this communication are indicative and subject to change without notice.
