GBPUSD is in the Buying DirectionHello Traders
In This Chart GBPUSD HOURLY Forex Forecast By FOREX PLANET
today GBPUSD analysis 👆
🟢This Chart includes_ (GBPUSD market update)
🟢What is The Next Opportunity on GBPUSD Market
🟢how to Enter to the Valid Entry With Assurance Profit
This CHART is For Trader's that Want to Improve Their Technical Analysis Skills and Their Trading By Understanding How To Analyze The Market Using Multiple Timeframes and Understanding The Bigger Picture on the Charts
Gbpusdanalysis

GBPUSD – Sellers Regain Control After Failing at ResistanceCable has slipped back under pressure after another rejection from a strong supply zone. Despite recent rallies, the broader picture shows that GBPUSD is struggling to hold ground as fundamental and technical forces align against the pound. The rejection above 1.36 sets the stage for renewed downside momentum, with sellers eyeing deeper support levels.
Current Bias
Bearish – GBPUSD faces downside pressure after failing to sustain above resistance.
Key Fundamental Drivers
BoE Policy: The Bank of England recently cut rates to 4%, highlighting a cautious stance amid weakening growth. Inflation risks remain, but softer data supports easing bias.
UK Economy: Labor market slack is increasing, retail sales remain weak, and wage growth has softened, limiting GBP upside.
US Dollar: While the Fed is preparing to cut rates eventually, safe-haven flows and tariff-driven inflation risks are helping the dollar hold firm.
Macro Context
Interest Rates: UK yields are under pressure after the BoE’s dovish shift, while US yields remain supported by safe-haven demand despite slowing growth.
Economic Growth: The UK economy shows stagnation with downside risks, while US growth, though slowing, still looks relatively resilient.
Commodity Flows: Lower oil prices are mildly supportive for the UK as an importer, but not enough to offset domestic economic weakness.
Geopolitics: Brexit-related trade frictions remain in the background, while global tariff escalation and Middle East tensions drive USD demand.
Primary Risk to the Trend
A surprise hawkish pivot from the BoE or sharply weaker U.S. inflation could flip sentiment back toward GBP upside.
Most Critical Upcoming News/Event
UK GDP and retail sales updates
U.S. Core PCE inflation data
Leader/Lagger Dynamics
GBPUSD tends to lag behind EURUSD when reacting to broad USD trends, often following the euro’s lead. However, it can act as a leader within GBP crosses (e.g., GBPAUD, GBPJPY).
Key Levels
Support Levels: 1.3371, 1.3242
Resistance Levels: 1.3599, 1.3716
Stop Loss (SL): 1.3599 (above key resistance zone)
Take Profit (TP): 1.3371 (first target), extension to 1.3242
Summary: Bias and Watchpoints
GBPUSD carries a bearish bias after failing to hold above 1.36, with sellers now targeting 1.3371 and potentially 1.3242. A stop loss above 1.3599 helps protect against another test of resistance, while profit targets favor a continuation lower in line with soft UK fundamentals and sticky USD demand. Watch for UK GDP and retail data, along with U.S. Core PCE, as key catalysts. GBPUSD remains a lagger to EURUSD in broader USD direction but will be a leader for GBP crosses.

GBPUSDGBPUSD needs a push up first before any further downside.
Disclosure: We are part of Trade Nation's Influencer program and receive a monthly fee for using their TradingView charts in our analysis.

GBPUSD Analysis week 39🌐Fundamental Analysis
Fed: Cut interest rates by 25 basis points Signals that there could be two more cuts this year due to concerns about a weak labor market. Emphasizes that inflation risks are still tilted to the upside, the rate cut is risk management. The Fed will be cautious, waiting for each meeting to continue to assess.
USD market: Initially down but reversed to increase sharply after the FOMC meeting. However, the increase is difficult to maintain, supporting GBP/USD to recover.
GBP & BoE: GBP is supported as expectations of an immediate BoE rate cut gradually decrease. BoE is expected to keep interest rates unchanged due to high inflation
🕯Technical Analysis
GBPUSD fell sharply at the end of the week, aiming for technical support at 1.342 and 1.335 next week. Pay attention to the price reaction at this support zone to have a BUY strategy towards the resistance levels of 1.353 and 1.358. If strong selling pressure appears from the resistance zone, it can create a long downtrend for this currency pair.
📉Trading Signals
BUY GBPUSD 1.33500-1.33300 Stoploss 1.33000
SELL GBPUSD 1.35800-1.36000 Stoploss 1.36300

GBPUSD 20ema BreakoutsWaiting for flags above the 20 EMA that break to the upside provides a suitable risk-reward setup (Tp1, Tp2) and a chance for the trade to trend.

GBPUSD and GBPJPY Analysis todayHello traders, this is a complete multiple timeframe analysis of this pair. We see could find significant trading opportunities as per analysis upon price action confirmation we may take this trade. Smash the like button if you find value in this analysis and drop a comment if you have any questions or let me know which pair to cover in my next analysis.

GBPUSD rejected from long term resistance line!GBPUSD with FOMC rejection from the high price currently below the weekly support may continue to drop as the last day of trading week, it is possible for the market to break back to weekly and monthly support level as price has got rejection from monthly high, we could see test of monthly low which is now high liquidity zone.
Potential buy zone at around 1.3534 level.

GBPUSD Daily Forecast -Q3 | W38 | D19 | Y25|
📅 Q3 | W38 | D19 | Y25|
📊 GBPUSD Daily Forecast
🔍 Analysis Approach:
I’m applying Smart Money Concepts, focusing on:
Identifying Points of Interest on the Higher Time Frames (HTFs) 🕰️
Using those POIs to define a clear trading range 📐
Refining those zones on Lower Time Frames (LTFs) 🔎
Waiting for a Break of Structure (BoS) for confirmation ✅
This method allows me to stay precise, disciplined, and aligned with the market narrative, rather than chasing price.
💡 My Motto:
"Capital management, discipline, and consistency in your trading edge."
A positive risk-to-reward ratio, paired with a high win rate, is the backbone of any solid trading plan 📈🔐
⚠️ Losses?
They’re part of the mathematical game of trading 🎲
They don’t define you — they’re necessary, they happen, and we move forward 📊➡️
🙏 I appreciate you taking the time to review my Daily Forecast.
Stay sharp, stay consistent, and protect your capital
— FRNGT 🚀
FX:GBPUSD

GBP/USD Bearish Setup – Supply Zone Rejection Targeting 1.3338"Chart Analysis:
Trend:
The pair was in a strong uptrend inside a rising channel.
Recently, price broke below the channel, signaling potential weakness.
Key Zones:
Supply Zone (Resistance): Around 1.3605 – 1.3660.
This is where sellers are expected to step in if price retraces back up.
Support Zone: Around 1.3510 – 1.3525, price reacted here before.
Trading Plan (Marked on Chart):
Entry Point: Around 1.3605 (short entry if price retests supply zone).
Stop Loss: Around 1.3661 (above supply zone).
Target Point: Around 1.3338 (major support below).
Risk-Reward Ratio (RRR):
Entry ~1.3605, SL ~1.3661 → Risk ≈ 56 pips.
TP ~1.3338 → Reward ≈ 267 pips.
RRR ≈ 1:4.7 → Very favorable.
Price Action Outlook:
If price pulls back into the supply zone, it’s a good short opportunity.
If price fails to retest supply and breaks below current support, continuation downside is confirmed.
Only a strong close above 1.3660 would invalidate this bearish setup.
📌 Summary:
The chart suggests a bearish retracement trade setup for GBP/USD.
Best strategy: Sell near supply zone (1.3605–1.3660).
Targeting 1.3338 with SL at 1.3661.
Great RRR, but patience is needed for entry confirmation.

GBPUSD(20250919)Today's AnalysisMarket News:
On Thursday, the U.S. reported its largest drop in initial jobless claims in nearly four years, reversing the previous week's sharp increase. (Note: Hours after the data was released, news broke that North Carolina's continuing claims data had been incorrectly and significantly understated by over 19,000. A Labor Department spokesperson stated that the matter is still under investigation.)
Technical Analysis:
Today's Buy/Sell Levels:
1.3582
Support and Resistance Levels:
1.3708
1.3661
1.3631
1.3534
1.3503
1.3456
Trading Strategy:
On a breakout above 1.3582, consider a buy entry, with the first target at 1.3631.
On a breakout above 1.3534, consider a sell entry, with the first target at 1.3503.

GBPUSD Rejection at 1.3727 – Sell Rallies, Eye 1.32In my previous analysis on FX:GBPUSD , I highlighted the 1.3600 zone as a key resistance area that could trigger a reversal and open the way towards 1.3200.
I initially took a short position, but as the buying pressure persisted, I closed the trade with a 40-pip loss and stepped aside, keeping my medium-term bearish view unchanged.
That decision proved correct: yesterday the pair spiked to a local high at 1.3727, only to reverse sharply and leave behind a long-tailed bearish Pin Bar — a strong technical signal of rejection at the highs.
My bias remains the same: I expect the market to eventually move lower and test the 1.3200 area.
📉 Trading Plan: I will look to sell rallies, with confirmation of downside acceleration coming on a break back below 1.3550.

GBP/USD Gave Fake Breakout , Short Setup Valid To Get 200 Pips !Here is my 2H Chart on GBP/USD , We Have A Fake Breakout and then the price Back below my old res and we have a very good bearish Price Action on 1 And 2 Hours T.F Also the price playing very good around my res and i`m waiting the price to retest the broken area and giving a good bearish price action on smaller time frames to can get a confirmation to enter , So i see it`s a good chance to sell this pair if it go up a little to retest the broken area and then we can sell it and targeting 100 to 150 pips . and if we have a daily closure again above my new res then this idea will not be valid anymore .
Reasons To Enter :
1- Perfect Breakout .
2- Clear Bearish Price Action .
3- Bigger T.F Giving Good Bearish P.A .
4 - Perfect 15 Mins Closure .
5- The Price Respect The Res Again .

GBPUSD Bullish Breakout!
HI,Traders !
#GBPUSD made a strong
Bullish breakout of the
Key horizontal resistance
Level around 1.35738
So we are bullish biased
And we will be expecting
A further bullish move up !
Comment and subscribe to help us grow !

GBPUSD Daily Forecast -Q3 | W38 | D18 | Y25|📅 Q3 | W38 | D18 | Y25|
📊 GBPUSD Daily Forecast
🔍 Analysis Approach:
I’m applying Smart Money Concepts, focusing on:
Identifying Points of Interest on the Higher Time Frames (HTFs) 🕰️
Using those POIs to define a clear trading range 📐
Refining those zones on Lower Time Frames (LTFs) 🔎
Waiting for a Break of Structure (BoS) for confirmation ✅
This method allows me to stay precise, disciplined, and aligned with the market narrative, rather than chasing price.
💡 My Motto:
"Capital management, discipline, and consistency in your trading edge."
A positive risk-to-reward ratio, paired with a high win rate, is the backbone of any solid trading plan 📈🔐
⚠️ Losses?
They’re part of the mathematical game of trading 🎲
They don’t define you — they’re necessary, they happen, and we move forward 📊➡️
🙏 I appreciate you taking the time to review my Daily Forecast.
Stay sharp, stay consistent, and protect your capital
— FRNGT 🚀
FX:GBPUSD

GBPUSD 15M, TRADE IDEA 17,SEP 2025.Trade idea based originally on the 4H Timeframe, 15M entry bases, expecting further move to the upside from here, as the overall trend is Bullish, let's see what price does.

GBPUSD Daily Forecast -Q3 | W38 | D17 | Y25|📅 Q3 | W38 | D17 | Y25|
📊 GBPUSD Daily Forecast -
🔍 Analysis Approach:
I’m applying Smart Money Concepts, focusing on:
Identifying Points of Interest on the Higher Time Frames (HTFs) 🕰️
Using those POIs to define a clear trading range 📐
Refining those zones on Lower Time Frames (LTFs) 🔎
Waiting for a Break of Structure (BoS) for confirmation ✅
This method allows me to stay precise, disciplined, and aligned with the market narrative, rather than chasing price.
💡 My Motto:
"Capital management, discipline, and consistency in your trading edge."
A positive risk-to-reward ratio, paired with a high win rate, is the backbone of any solid trading plan 📈🔐
⚠️ Losses?
They’re part of the mathematical game of trading 🎲
They don’t define you — they’re necessary, they happen, and we move forward 📊➡️
🙏 I appreciate you taking the time to review my Daily Forecast.
Stay sharp, stay consistent, and protect your capital
— FRNGT 🚀
FX:GBPUSD

GBPUSD Daily Forecast - Video Breakdown -Q3 | W38 | D17 | Y25|📅 Q3 | W38 | D17 | Y25|
📊 GBPUSD Daily Forecast - Video Breakdown
🔍 Analysis Approach:
I’m applying Smart Money Concepts, focusing on:
Identifying Points of Interest on the Higher Time Frames (HTFs) 🕰️
Using those POIs to define a clear trading range 📐
Refining those zones on Lower Time Frames (LTFs) 🔎
Waiting for a Break of Structure (BoS) for confirmation ✅
This method allows me to stay precise, disciplined, and aligned with the market narrative, rather than chasing price.
💡 My Motto:
"Capital management, discipline, and consistency in your trading edge."
A positive risk-to-reward ratio, paired with a high win rate, is the backbone of any solid trading plan 📈🔐
⚠️ Losses?
They’re part of the mathematical game of trading 🎲
They don’t define you — they’re necessary, they happen, and we move forward 📊➡️
🙏 I appreciate you taking the time to review my Daily Forecast.
Stay sharp, stay consistent, and protect your capital
— FRNGT 🚀

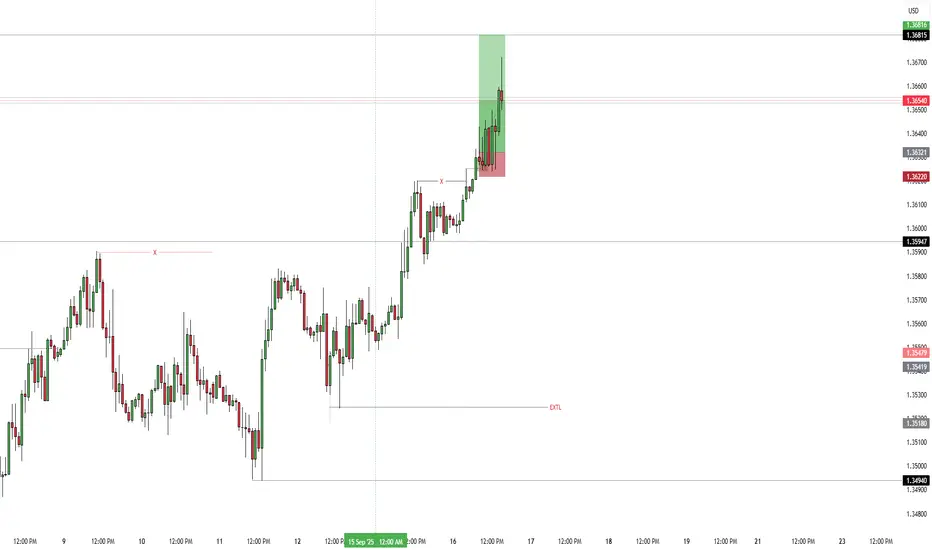
GBPUSD: Buy SignalPrice already broke and retested the breaker block around 1.3640–1.3645. This are is is holding and showing a strong reaction on retest.
Market recently made a weak high at 1.3680 which is still untested. So price hasn't found a ceiling yet.
PDH sits just below that weak high so we have some liquidity resting above.
🟢Market Execution
Entry 1.36506
SL 1.362
TP 1.375
✅ Pullback Buy
Entry 1.3620–1.3625
SL 1.3600
TP 1.3680
TP2 1.3720
✅ Breakout Buy
Entry: M15 close above + retest 1.3680.
SL 1.3655
TP1 1.3720
TP2 1.3750

UPDATE - GBP/USD Momentum Faces Key Test at ResistanceHi everyone,
A quick update on our GBP/USD idea shared earlier in the week:
As anticipated, once GBP/USD broke above the 1.35300 level, momentum carried the pair higher, pushing beyond 1.35955 and bringing it within reach of the 1.36850 zone. We expect this area to present notable resistance, and price action here will be key in determining whether buyers have the strength to extend the rally further.
A decisive break above 1.36850 would bring the next key upside targets into focus, in particular the 1.37890 level. The impulsive rally from the 1st August low continues to underpin our bullish outlook on GBP/USD.
We’ll be monitoring price action closely to see how this structure develops in the sessions ahead.
The longer-term outlook remains bullish, with expectations for the rally to continue extending from the 1.20991 January low toward 1.40000 and 1.41700.
We’ll keep you updated throughout the week with how we’re managing our active ideas.
Thanks again for all the likes, boosts, comments, and follows — we really appreciate the support!
All the best for the week ahead.
Trade safe,
BluetonaFX

[UPDATE] ON GBPUSD HOURLY TRADE IDEAThe cable so far respected the structure and respected the trend as previously predicted, although I was stopped out and no longer in this trade due to breakeven when the price retraced to our entry due to the NY OPEN pre-market trading and volatility.
Note: This is not financial Advice. Trade responsibly!
GBP/USD Rate at 2-Month HighGBP/USD Rate at 2-Month High
As the GBP/USD chart shows, the pair is trading this morning above 1.3620 – its highest level since the beginning of July.
The bullish sentiment is driven by the divergence in central bank policies:
→ United States: Traders are betting on an interest rate cut, supported by President Trump. The Federal Reserve will announce its decision tomorrow at 21:00 GMT+3, and the market expects a reduction of at least 0.25%, from 4.25%–4.50% to 4.00%–4.25%.
→ United Kingdom: Traders anticipate the rate will remain at 4.00%. The Bank of England will announce its decision on Thursday at 14:00 GMT+3.
Although the rates of the two central banks are comparable, the situation differs: in the UK, inflation is more persistent and rate cuts are seen as risky, while in the US, President Trump is exerting pressure on the Fed’s leadership.
An additional boost for the pound comes from a wave of investment optimism linked to US President Donald Trump’s state visit to the UK. According to media reports, agreements worth around $10 billion are expected to be announced during the visit.
GBP/USD Technical Analysis
Looking at the price movements earlier this month, we noted lower highs and lower lows forming a bearish A→B→C→D structure. We also assumed that:
→ bulls could rely on support at the psychological level of 1.3400;
→ but if bearish pressure intensified, GBP/USD could fall towards the median of the descending channel.
Since then, the situation has changed considerably: bears failed to consolidate below 1.3400, and after a bullish double bottom pattern (1–2) formed, the price surged upwards.
At the same time, the GBP/USD chart highlights key signs of strong demand:
→ the descending (red) channel has been broken, and the bearish A→B→C→D structure is no longer relevant;
→ higher highs and higher lows confirm buyer dominance – providing grounds to outline a rising (blue) channel.
On the other hand, the RSI indicator is close to overbought territory, which suggests a possible pullback.
Potential support levels:
→ 1.34900: the breakout point where bulls started their advance;
→ 1.35890: a level that lost its resistance role this week;
→ the upper boundary and median of the blue ascending channel.
Taking all this into account, we could assume that in the near term, bulls may aim to lift GBP/USD towards the upper boundary of the yellow channel. It is also possible that news from the Fed and the Bank of England will aid them on this path.
This article represents the opinion of the Companies operating under the FXOpen brand only. It is not to be construed as an offer, solicitation, or recommendation with respect to products and services provided by the Companies operating under the FXOpen brand, nor is it to be considered financial advice.

GBPUSD Potentially bearish$SGBPUSD Looking at the chart, we can see a clear triple top with price breaking out on the lower side and potentially creating a lower high. With this in play, If the recent high is confirmed as a new high and with a bearish candle as confirmation, this will be a good sell. Until then, fingers crossed.
#GBPUSD
