XAUUSD (Gold) Technical Analysis & Trading ForecastXAUUSD (Gold) Technical Analysis & Trading Forecast
Current Price: $3,886.75 | Date: October 4, 2025, 12:54 AM UTC+4
Executive Summary
Gold is trading at historic levels above $3,880, reflecting strong safe-haven demand amid ongoing geopolitical tensions and potential monetary policy shifts. The asset is currently testing critical resistance zones while maintaining bullish momentum across multiple timeframes. Both intraday and swing traders should monitor key technical levels for optimal entry and exit strategies.
Multi-Timeframe Technical Analysis
Monthly & Weekly Perspective (Swing Trading)
Gold has experienced significant appreciation in 2025, with the current price action suggesting a continuation of the long-term uptrend that began in late 2022. Monthly charts reveal:
Elliott Wave Analysis: Gold appears to be in Wave 5 of a major impulse sequence, targeting the $4,000-$4,200 zone based on Fibonacci extensions from previous wave structures.
Ichimoku Cloud (Monthly): Price is trading well above the cloud with bullish Tenkan/Kijun cross, confirming strong trend strength. The cloud ahead remains thin, suggesting limited resistance until $4,050.
Gann Analysis: Using the Square of 9 methodology from the 2020 low ($1,450), the current price aligns with the 315-degree angle, projecting next major resistance at $4,015 (360-degree completion) and $4,180 (next 45-degree increment).
Key Weekly Support/Resistance Levels:
Major Resistance: $3,920, $4,015, $4,180
Primary Support: $3,850, $3,765, $3,680
Critical Support: $3,580 (weekly 50 EMA)
Daily Chart Analysis
Candlestick Patterns: The recent price action shows a series of bullish engulfing patterns following pullbacks, indicating strong buying pressure at lower levels.
Wyckoff Analysis: The current phase suggests we are in a re-accumulation schematic, with recent consolidation between $3,850-$3,920 representing a potential spring or test before continuation to higher targets.
Harmonic Patterns: A bullish Gartley pattern completed at $3,765, projecting targets at $3,950 (0.618 retracement) and $4,050 (1.272 extension).
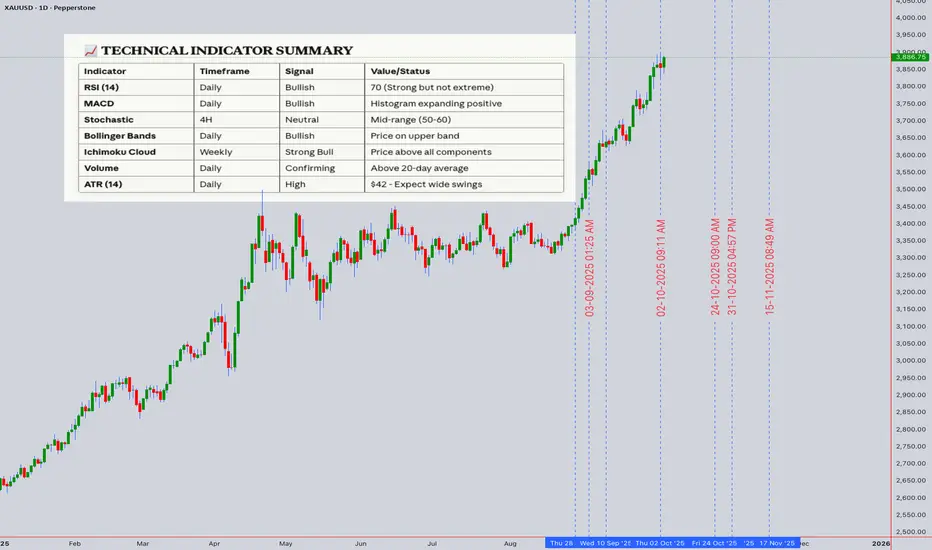
RSI (Daily): Currently at 68, approaching overbought territory but not yet extreme. Historical analysis shows gold can sustain RSI above 70 for extended periods during strong trends.
Bollinger Bands: Price is riding the upper band, with bandwidth expansion indicating increasing volatility. The middle band at $3,820 serves as dynamic support.
Moving Averages:
20 EMA: $3,842 (immediate support)
50 EMA: $3,765 (critical support)
200 EMA: $3,580 (long-term trend confirmation)
Golden Cross remains intact with 50 EMA well above 200 EMA
Intraday Trading Strategy (Next 5 Trading Days)
4-Hour Chart Setup
Current Structure: Gold is forming an ascending triangle pattern with resistance at $3,920 and rising support trend line from $3,765.
VWAP Analysis: Anchored VWAP from October 1st stands at $3,872. Price trading above indicates bullish control. Volume profile shows high volume node at $3,860-$3,870, serving as magnetic support zone.
Scenario 1 - Bullish Breakout:
Entry: Break and close above $3,920 on 4H chart with strong volume
Target 1: $3,965 (measured move from triangle)
Target 2: $4,015 (Gann resistance)
Target 3: $4,050 (Harmonic target)
Stop Loss: $3,875 (below VWAP and triangle support)
Risk/Reward: 1:3
Scenario 2 - Retracement Play:
Entry: Pullback to $3,850-$3,860 zone with bullish reversal candle
Target 1: $3,900
Target 2: $3,920 (triangle resistance)
Stop Loss: $3,830 (below 20 EMA on 4H)
Risk/Reward: 1:2.5
1-Hour Chart Tactical Levels
Immediate Resistance Zones:
$3,900-$3,905 (prior consolidation area)
$3,920-$3,925 (major resistance cluster)
$3,950 (psychological level)
Immediate Support Zones:
$3,872-$3,875 (VWAP & prior resistance turned support)
$3,860-$3,865 (high volume node)
$3,850 (minor swing low)
RSI (1H): Currently 58, neutral zone with room to move higher. Watch for bullish divergence on pullbacks.
Bollinger Bands (1H): Price oscillating between middle and upper band. Squeeze conditions suggest potential breakout imminent.
15-Minute & 5-Minute Scalping Strategy
Best Trading Sessions: London open (08:00-12:00 UTC+4) and US open (15:30-19:30 UTC+4) for highest volatility and volume.
Entry Criteria:
Price must be above 15-min 50 EMA for long entries
RSI pullback to 40-50 zone followed by bullish momentum surge
Volume confirmation (above 20-period VWMA)
Scalping Levels (Valid for next 5 days):
Buy Zone: $3,875-$3,885 (quick 10-15 point targets)
Sell Zone: $3,915-$3,925 (if rejection occurs)
Stop Loss: Maximum 20 points ($200/contract)
Target: 15-25 points ($150-$250/contract)
Pattern Recognition: Watch for bull flags on 15-minute chart during uptrends as continuation patterns, typically resolving within 3-6 candles.
Swing Trading Strategy (1-4 Week Horizon)
Primary Swing Setup - Long Position
Entry Strategy:
Preferred Entry: $3,850-$3,870 on any weekly pullback
Aggressive Entry: Current levels with wider stop
Conservative Entry: Wait for daily close above $3,920
Position Sizing: Allocate only 30-40% of capital initially, scaling in at lower levels if opportunity presents.
Target Zones:
Target 1: $4,015 (15% position exit) - Gann resistance
Target 2: $4,180 (35% position exit) - Elliott Wave projection
Target 3: $4,350 (30% position exit) - 1.618 Fibonacci extension
Runner: Hold remaining position with trailing stop
Stop Loss Management:
Initial Stop: $3,765 (below daily 50 EMA)
Move to breakeven once Target 1 is reached
Trail stop at previous week's low as price advances
Risk/Reward: Approximately 1:4 from current levels
Alternative Swing Setup - Counter-Trend (Higher Risk)
Entry Trigger: Daily close below $3,850 with increased volume
Short Entry: $3,840-$3,850
Targets: $3,765 (T1), $3,680 (T2)
Stop Loss: $3,920
Note: Only consider if clear reversal pattern forms (bearish engulfing, head and shoulders). Current trend remains bullish.
Pattern & Theory Analysis
Elliott Wave Count
Primary Count:
Wave 1: $1,810 to $2,150 (2023)
Wave 2: $2,150 to $1,990 (correction)
Wave 3: $1,990 to $3,200 (extended wave)
Wave 4: $3,200 to $2,960 (complex correction)
Wave 5: $2,960 to current (potentially targeting $4,200+)
We appear to be in sub-wave 5 of larger Wave 5, suggesting final leg of impulse move approaching.
Harmonic Patterns
Completed Patterns:
Bullish Gartley (completed at $3,765)
Bullish Bat pattern (completed in September at $3,680)
Potential Forming Patterns:
Bullish Butterfly pattern developing with D point potential at $3,750 if retracement occurs
Wyckoff Market Phases
Current analysis suggests Phase D (markup) of re-accumulation schematic. Characteristics observed:
Signs of Strength (SOS): Strong rallies from $3,765 to $3,920
Last Point of Support (LPS): Recent test at $3,850-$3,860
Backup to the edge of creek: Minor pullbacks quickly bought
This suggests institutional accumulation continues with further upside likely.
Gann Time & Price Projections
Time Cycles: Significant Gann time windows approaching:
October 7-9, 2025: 90-degree square from previous major low
October 15-18, 2025: 180-degree opposition, potential reversal or acceleration point
Price Squares:
Square of current price ($3,886) suggests natural resistance at $3,969 (square root progression)
Gann angles from September low project resistance at $3,985
Ichimoku Analysis
Daily Ichimoku:
Price above all cloud components (strongly bullish)
Tenkan-sen (9): $3,868
Kijun-sen (26): $3,845
Senkou Span A: $3,810
Senkou Span B: $3,765
Cloud Interpretation: Thick bullish cloud below price provides strong support cushion. Future cloud remains green, suggesting trend continuation expected.
Trap Scenarios
Bull Trap Risk:
If price breaks above $3,920 but fails to hold and reverses below $3,880 within 24 hours with high volume, this could signal a bull trap
Probability: Low (15-20%) given current fundamental backdrop
Bear Trap Watch:
Any sharp drop below $3,850 that quickly reverses above $3,870 could trap bearish traders
This would likely accelerate the next leg higher
Probability: Moderate (35-40%) if pullback occurs
Volume & Momentum Analysis
Volume Profile:
High volume acceptance between $3,800-$3,900
Point of Control (POC): $3,865
Low volume area above $3,950 suggests potential for rapid movement if breached
VWAP Signals:
Price consistently holding above daily VWAP indicates institutional buying
Weekly VWAP at $3,820 serves as strong support for swing positions
Volume volatility increasing suggests preparing for significant move
RSI Across Timeframes:
5-min: 52 (neutral)
15-min: 58 (bullish lean)
1H: 58 (bullish lean)
4H: 64 (approaching overbought, still healthy)
Daily: 68 (strong but not extreme)
Weekly: 71 (overbought but sustainable in strong trends)
Moving Average Analysis:
All major EMAs in bullish alignment (20>50>200)
No death cross signals on any timeframe
Price trading above 20 EMA on all timeframes except 5-min (normal intraday oscillation)
Market Context & External Factors
Fundamental Backdrop
While this is primarily a technical analysis, traders should be aware that gold's current strength reflects:
Geopolitical tensions that may be supporting safe-haven demand
Central bank policies and potential monetary easing cycles
Currency fluctuations particularly USD weakness
Inflation concerns that typically support precious metals
Key Events to Monitor (Next Week)
Federal Reserve speakers: Any dovish commentary could propel gold higher
Geopolitical developments: Escalation or de-escalation affects safe-haven flows
Economic data: Employment figures, inflation reports can trigger volatility
Dollar Index movements: Inverse correlation with gold typically strong
Recommended Approach: Maintain stop losses below technical support levels regardless of fundamental views. Markets can remain irrational longer than traders can remain solvent.
Risk Management Guidelines
Position Sizing
Intraday Trades:
Risk 0.5-1% of account per trade
Maximum 2-3 concurrent positions
Respect maximum daily loss limit of 2% account value
Swing Trades:
Risk 1-2% of account per position
Scale in across multiple entries if possible
Limit total gold exposure to 10-15% of portfolio
Stop Loss Discipline
Non-Negotiable Rules:
Always set stop loss before entering position
Never move stop loss further from entry (only toward profit)
Exit immediately if stop is touched - no exceptions
If stopped out twice from same level, wait for new setup
Profit Taking Strategy
Systematic Approach:
Take partial profits at first target (never wrong to take profit)
Move stop to breakeven after Target 1
Trail stop using previous swing lows (intraday) or daily lows (swing)
Never let winner turn into loser once breakeven is reached
Trading Plan Summary
For Intraday Traders (Next 5 Days)
Primary Focus: Watch for breakout above $3,920 or pullback to $3,860 support zone
Best Times to Trade: London and US session opens for maximum liquidity
Key Levels:
Resistance: $3,920, $3,950, $4,000
Support: $3,875, $3,860, $3,850
Recommended Strategy: Buy dips near support with tight stops, or breakout trades above resistance with momentum confirmation
For Swing Traders (1-4 Weeks)
Primary Outlook: Bullish continuation toward $4,000-$4,200 zone
Optimal Entry: Any pullback to $3,850-$3,870 represents opportunity
Position Management: Scale in across multiple entries, scale out across multiple targets
Major Resistance: $4,015 (Gann), $4,180 (Elliott Wave)
Critical Support: $3,765 (daily 50 EMA) - break here invalidates bullish setup
Conclusion & Final Recommendations
Gold remains in a strong uptrend across all major timeframes with technical indicators supporting further appreciation. The current consolidation near all-time highs is typical behavior before the next leg higher. Both intraday and swing traders have clearly defined opportunities with favorable risk/reward ratios.
Confidence Level: 75% probability of testing $4,000+ within next 2-4 weeks based on technical confluence
Preferred Strategy: Buy dips with defined risk, scale out into strength
Critical Warning: Any daily close below $3,765 would damage the bullish structure and require reassessment
Next Major Update: October 11, 2025, or immediately following any significant technical breakout/breakdown
Disclaimer: This analysis is for educational and informational purposes only. Trading financial instruments involves substantial risk of loss. Past performance does not guarantee future results. Always conduct your own research and consider your risk tolerance before trading. The author is not responsible for any trading losses incurred based on this analysis.
Next Update: October 11, 2025
Analysis Valid Through: October 18, 2025
Prepared using advanced technical analysis incorporating Wyckoff, Elliott Wave, Gann, Harmonic Patterns, Ichimoku, and modern momentum indicators.RetryClaude can make mistakes. Please double-check responses.
Gc1
Options Traders Display Caution As Gold Bulls Gun For $4000With gold trading less than $120 from the $4,000 milestone, it would be rude not to test that key level. While market positioning suggests a move beyond it is possible, options traders appear to be bracing for higher volatility — or even a pullback.
Matt Simpson, Market Analyst at City Index

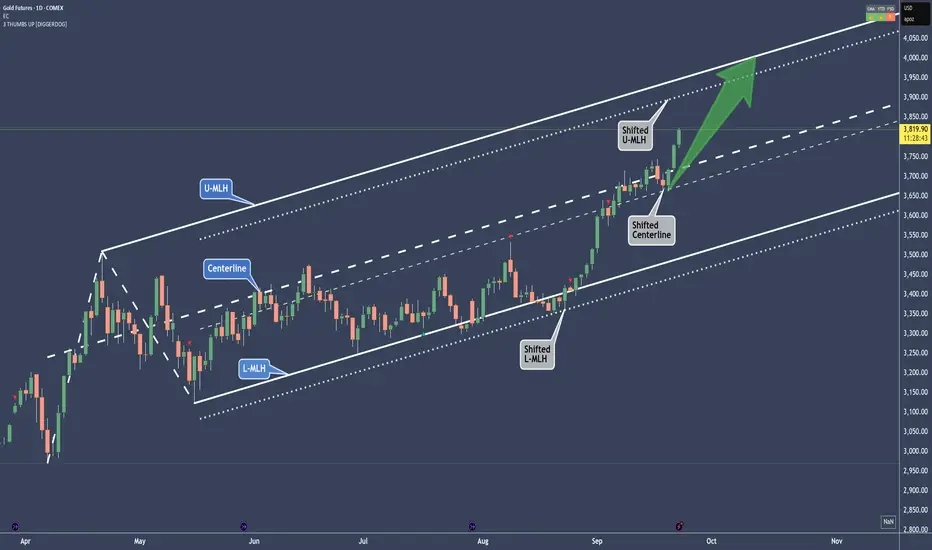
Gold - A shifted move in play and up to 4K🔱 Here’s a shifted move in play 🔱
What exactly is a shifted move?
You see the parallel lines next to the white fork?
Those are the shifted lines.
Now, if you observe how price behaved at the white fork, you’ll notice it was a bit sloppy at the L-MLH, and again at the Centerline after reaching it.
But when we add the dotted parallel lines to the chart and measure the distance from the overshoot at the L-MLH, we find a beautiful support at the Shifted Centerline.
The usual target would be the U-MLH.
So, could the target also be shifted?
And what does that tell us?
Well, if you’re long on Gold, you might want to take some profit at the Shifted U-MLH and let the rest ride up toward 4K—if there’s enough gas in the goose.
For me, a re-entry long would be a pullback to the Centerline—either the original or the shifted one—with a small stop just below some structure.
Let me know what you think ho far Gold will go in the comments.
😊 Thanks for boosting, thanks for following 🙏
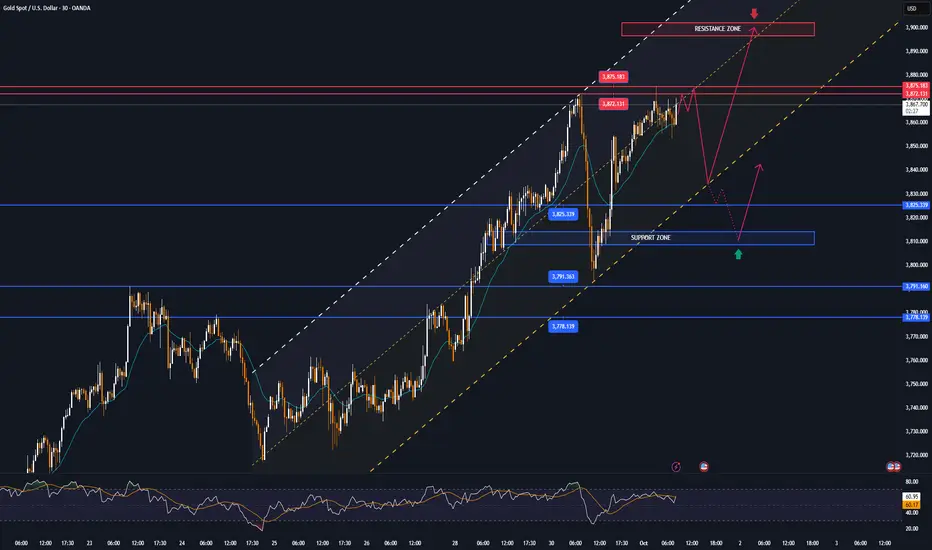
US budget deadlock causes GOLD to break peak, USD to plummetOn September 30, spot OANDA:XAUUSD prices jumped $24.7 to close at $3,858.23 an ounce, after hitting a new record high of $3,871.73 an ounce.
The main reasons came from two factors: concerns about a possible US government shutdown and weak employment data, which raised expectations that the Federal Reserve (Fed) would continue to cut interest rates. This put pressure on the US dollar and boosted demand for safe-haven gold.
According to the US Department of Labor, the number of jobs increased only slightly in August, while the demand for recruitment decreased sharply. Consumer confidence also fell to a five-month low. The US dollar index (DXY) therefore fell 0.17% to 97.78 - the lowest level in a week.
Experts say gold benefits from the weaker dollar and the prospect of the Fed cutting interest rates in October, with the probability of up to 97% according to the CME FedWatch tool.
Meanwhile, the stalemate between the two parties in Congress has put the US government at risk of running out of budget by midnight on September 30. If no agreement is reached, the shutdown will disrupt the release of many important economic data, including the non-farm payroll report.
If the US government shutdown lasts longer, the negative impact on the economy could force the Fed to loosen policy more strongly, thereby further boosting the gold price rally.
Technical outlook analysis of OANDA:XAUUSD
Main trend:
• Gold is still in a narrow uptrend channel (parallel uptrend channel).
• Candlesticks are sticking close to the upper edge of the uptrend channel ⇒ buying power is quite strong but also showing signs of “overextending”.
• RSI above 70 ⇒ Gold is in the overbought zone, risk of short-term correction.
Important levels (Fib + Resistance/Support):
• Strong resistance: 3,872 – 3,875 USD/oz (Fib 0.618 + psychological block).
• If broken, the next target is 3,938 – 4,022 USD/oz.
• Nearby support: 3,825 USD (Fib 0.5) and 3,778 – 3,791 USD (confluence of Fib 0.382 + horizontal support).
SELL XAUUSD PRICE 3901 - 3899⚡️
↠↠ Stop Loss 3905
→Take Profit 1 3893
↨
→Take Profit 2 3887
BUY XAUUSD PRICE 3810 - 3812⚡️
↠↠ Stop Loss 3806
→Take Profit 1 3818
↨
→Take Profit 2 3824
GOLD surges, US faces risk of government shutdownOn September 29, the spot price of OANDA:XAUUSD increased by nearly 2%, surpassing the threshold of 3,800 USD/ounce and setting a record high. At the end of the session, the gold price reached 3,833.53 USD/ounce, up 74.13 USD compared to the previous session. During the day, this precious metal had reached a peak of 3,834.18 USD/ounce.
The sharp rise in gold prices is due to many factors: concerns about the risk of a US government shutdown, expectations that the Federal Reserve (Fed) will soon cut interest rates and escalating geopolitical tensions.
US President Donald Trump met with senior leaders of both parties in Congress on September 29 to find a solution to extend the budget. If no agreement is reached, the federal government will begin to shut down on October 1, right when the 2026 fiscal year begins. The US Department of Labor also confirmed that it will temporarily suspend the release of economic data, including the September jobs report, if this scenario occurs.
On the geopolitical front, the Russian Defense Ministry said its troops had taken control of the village of Shandryholove in the Donetsk region, adding to the uncertainty and boosting safe-haven demand for gold.
Falls in US Treasury yields also helped support gold prices. The 10-year yield fell 3 basis points to 4.141%, while real yields fell 3.5 basis points to 1.761%.
The US dollar also weakened, with the DXY index down 0.27% to 97.91, making gold cheaper for holders of other currencies.
According to forecasting platforms Kalshi and Polymarket, the possibility of a US government shutdown on October 1 has increased to 70%, compared to about 50% at the end of last week. This has further increased the uncertainty in the market. Since the beginning of the year, gold prices have increased by more than 43%, thanks to the demand for reserves from central banks and expectations of the Fed easing monetary policy. Many major financial institutions, including Goldman Sachs and Deutsche Bank, continue to forecast that gold has room to increase in the coming time.
Technical analysis & trading strategies OANDA:XAUUSD
Quick Summary
Price is in a clear ascending channel on the daily chart, short-term MAs are moving up to support and RSI has some momentum. Fibonacci on the chart shows clear targets: 3.872 (0.618) → 3.938 (0.786) → 4.022 (1.00). Immediate support is in the ~3.791–3.777 range. Overall: the main trend is still up, trade with the trend is preferred.
Main setup, Long in trend (Safety / Swing)
Idea: Buy when price returns to support zone in rising channel (pullback) or confirms touching the lower edge of the channel and bounces up.
Breakout (Strong, Confirmed)
Idea: If price closes Daily & has a strong bullish bar above the resistance level 3.872 (Fibo 0.618) or closes above the channel top with high volume → buy chasing the strong trend.
Breakdown scenario
• If the daily close is below 3,720–3,706 (MA + channel bottom), the bullish structure is considered damaged — exit long or switch to wait for deeper buy-on-dip.
• In that case, a reasonable new buy point would be at 3,630–3,680 (deep support zone, fib 0).
Risk Management
• Risk events: NFP, Fed speeches, US government shutdown risk — strong volatility can wipe out SL. Before big news: reduce order size or limit trade.
• RSI: high (near overbought zone) → technical correction is likely to appear; therefore, prioritize entry at pullback rather than catching the top.
• Capital management: risk per trade ≤ 1–2% of capital; use order size appropriate to SL distance.
Big Attention!
• Price enters Entry zone or closes on the day of Breakout confirmation.
• Support volume (Breakout with increased volume is a strong signal).
• Clear SL, TP divided into 2-3 parts.
• Reduce weight before big news (NFP / Fed / risk-off).
SELL XAUUSD PRICE 3867 - 3865⚡️
↠↠ Stop Loss 3871
→Take Profit 1 3859
↨
→Take Profit 2 3753
BUY XAUUSD PRICE 3782 - 3784⚡️
↠↠ Stop Loss 3778
→Take Profit 1 3790
↨
→Take Profit 2 3796

XAUUSD Has Left the buildingOn the way up, we first found support at the L-MLH (1).
Then the Centerline stepped in as resistance (2), but it eventually couldn’t hold price down.
Eating through the Centerline like a mouse through cheese, price found support again at (2) before blasting upward to the U-MLH — and quickly through it.
Once again, the U-MLH turned from prior resistance into fresh support.
From there, price mirrored (2), moving sideways before blasting off to the moon! 🚀
I’m surprised that WL1 offered no resistance at all.
Now that we’ve left WL1 behind, WL2 is the next target.
Watching the show patiently.

GOLD surpasses historical peak - waiting for boost from NFPNews of the past week: OANDA:XAUUSD approaches historical peak, benefits from US tariffs and geopolitical tensions
• In the trading session on September 26, the spot gold price surpassed the $3,760/ounce mark and fluctuated around $3,780, just a short distance from the historical peak of $3,791 set earlier this week. This is also the sixth consecutive week of increase for the precious metal, thanks to increased demand for safe havens in the context of new US tariffs and escalating geopolitical tensions.
• The August personal consumption expenditures (PCE) inflation report contained few surprises: Core PCE rose 0.2% month-over-month, in line with forecasts and below July's initial 0.3% reading (which was later revised down). Year-over-year, core PCE held steady at 2.9%, still above the Fed's 2% target. Total PCE rose 0.3% month-over-month, up from July's 0.2% reading; year-over-year, it edged up to 2.7% from 2.6%.
• This inflationary trend has weakened the US dollar, providing additional support for gold prices. However, the Fed’s monetary policy picture remains cautious. After cutting interest rates by 25 basis points last week, many Fed officials have stressed that there is no need to rush to ease further as price pressures persist despite signs of a slowdown in the labor market.
• Meanwhile, U.S. economic data released on Thursday, including stronger-than-expected second-quarter GDP growth and lower jobless claims, added to the Fed’s concerns, potentially complicating the path to rate cuts, while gold continues to benefit from haven demand and a fraught political and trade environment.
This week: Global markets await US jobs data and signals from the Fed
• From September 29 to October 4, global financial markets will be watching the speeches of US Federal Reserve (Fed) officials after the September interest rate cut. The biggest highlight is the non-farm payroll (NFP) report released on Friday, a factor that could shape the interest rate path at the Fed's meeting in late October.
• At the start of the week, the Eurozone will release a series of data on economic sentiment, consumer confidence and industrial climate, important indicators to check the possibility of escaping the risk of stagflation. On Tuesday, Australia decides on its benchmark interest rate, Japan publishes its policy summary, while China releases its manufacturing PMI. Germany also releases CPI and retail sales on the same day. In the US, Chicago PMI and JOLTs employment data will be released, along with a series of speeches from regional Fed presidents, where views on interest rate cuts are clearly divided.
• Wednesday will see the US ADP jobs report and the Eurozone harmonized CPI, which are key data for ECB policy. In addition, the final PMIs from the Eurozone, Germany, France and the UK will be released. The Fed continues its series of speeches, including from the Vice Chairman, which will further focus the market on the employment-inflation balance.
• The climax comes on Friday when the US releases its September non-farm payrolls. If the data is weaker than expected, the chances of the Fed cutting interest rates by another 25 basis points in October will increase, weakening the USD and supporting gold prices. Conversely, strong data could reverse expectations and strengthen the greenback. On the same day, Japan releases its unemployment rate, adding to the currency market.
• Overall, this week is a clash of economic data and policy guidance. NFP will be a key measure to break the Fed’s current balance, while European and Japanese data reflect global policy divergence. For investors, gold and the US dollar are likely to be volatile, while crude oil will be influenced by inventory data and Chinese PMIs.
Technical Outlook Analysis OANDA:XAUUSD
Summary: Gold on the daily chart is running in a clear uptrend channel, buyers are still in control but need to pay attention to the accumulation phase and high RSI before entering orders.
Technical perspective
• Main trend: Strong increase — price is fluctuating in a clear uptrend channel, tops/cores/bottoms are all making lower and higher lows → bullish structure is intact.
• Moving average (MA): Short-term MA is pointing up, price is above MA → confirms the uptrend and MA acts as dynamic support when there is a pullback.
• Key support: ~3,720–3,738 USD/oz (near support/lower consolidation band); stronger support around 3,629–3,630 (previous bottom).
• Technical resistance/target: immediate resistance ~3,791 USD (recent top). Fibonacci targets if broken: 3,825 (0.5) → 3,872 (0.618) → 3,938 (0.786) → extension to ~4,022 (extension).
• RSI & momentum: RSI is in high territory but not yet giving strong reversal signals — momentum remains positive but warns of technical correction risk.
Risk management tips & signals to watch
• Split orders, don't go all-in; limit risk to 1–2% of account per order.
• Monitor RSI: if you see a negative Divergence + a strong bearish candle closing below the lower channel boundary, postpone the Buy.
• Macro news (PCE, NFP, Fed speech) can create a strong gap, it is best to use Stop Trading around those events.
• If it breaks below 3,630 with high Volume, the Bullish Scenario is null, need to switch to capital preservation.
Basic scenario: still prioritize long because of the bullish structure and MA support. However, smart Trades buy with a plan, have disciplined Stop, and don't forget: gold likes macro Drama, so keep a flexible mentality.
SELL XAUUSD PRICE 3813 - 3811⚡️
↠↠ Stop Loss 3817
→Take Profit 1 3805
↨
→Take Profit 2 3799
BUY XAUUSD PRICE 3753 - 3755⚡️
↠↠ Stop Loss 3749
→Take Profit 1 3761
↨
→Take Profit 2 3767

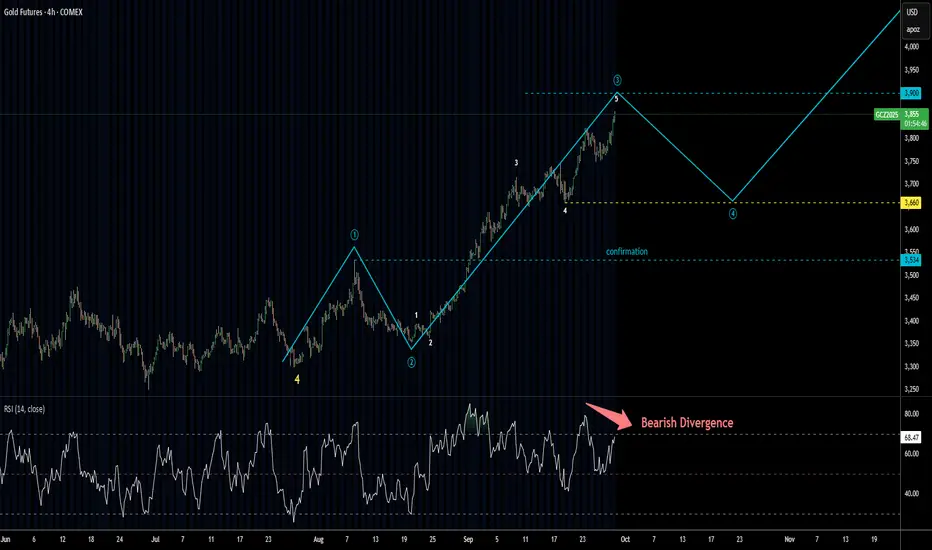
Gold Update 29SEP2025: Top Is Soon, Then PullbackGold Futures are following the projected path closely
The first target at $3,900 is now just "miles" away
This level could mark the top of wave (3) of ((5))
After that, we might see a pullback to around $3,660 in wave (4) of ((5)),
which typically revisits the low of the smaller wave 4
On the 4-hour chart, RSI shows bearish divergence,
as it fails to confirm the new high at $3,859 with a lower peak
Despite this signal, the market could still reach the $3,900 level
Once wave (4) of ((5)) completes,
we can reassess and project wave (5) of ((5)) —
which might form as a triangle or another complex correction.
XAUUSD targeting 3860 with the 1H MA50 supporting.Gold (XAUUSD) has entered a new Channel Up pattern by turning its 1H MA50 (blue trend-line) into Support.
The last time it formed such a pattern after a -2.00% decline was during September 19 - 23. Both fractals are identical in structure both in 1H MA50 and Channel terms.
The previous Channel Up eventually peaked a little above the 2.0 Fibonacci, which more than covers our 3860 Target. The pattern gets technically invalidated if the 1H MA50 breaks.
-------------------------------------------------------------------------------
** Please LIKE 👍, FOLLOW ✅, SHARE 🙌 and COMMENT ✍ if you enjoy this idea! Also share your ideas and charts in the comments section below! This is best way to keep it relevant, support us, keep the content here free and allow the idea to reach as many people as possible. **
-------------------------------------------------------------------------------
💸💸💸💸💸💸
👇 👇 👇 👇 👇 👇

Gold | Oil | Dollar | Silver | Natural Gas Price ForecastGold | Oil | Dollar | Silver | Natural Gas Price Forecast
AMEX:UNG AMEX:BOIL AMEX:KOLD COMEX:SI1!

GOLD MARKET ANALYSIS AND COMMENTARY - [Sep 29 - Oct 03]This week, after opening at $3,683/oz, OANDA:XAUUSD prices jumped to $3,791/oz after NATO forces intercepted three Russian MiG-31 fighter jets when they violated Estonian airspace, causing investors to worry about an escalation of the NATO-Russia conflict. However, after that, Fed Chairman Jerome Powell's cautious tone about further interest rate cuts, along with the US GDP data in the second quarter soaring to 3.8%, pushed gold prices down to $3,717/oz. Gold prices then recovered and closed the week at $3,760/oz.
Next week, the US will announce the non-farm payroll (NFP) figures for September, which are expected to reach 51,000 jobs, much higher than the 22,000 jobs in August. The recovery in NFP figures compared to the previous period is also natural when the US economy still maintains its growth momentum.
However, according to many experts, the September NFP may only be around the expected level, and it is unlikely to exceed the expected level of 51,000 jobs, because US businesses are still facing difficulties due to tariffs and have not expanded their recruitment activities this month. If the NFP is only below 51,000 jobs, this will still be a concern for the FED, forcing the agency to consider further interest rate cuts, supporting the gold price next week to move closer to 3,800 USD/oz, or even exceed this level.
📌In terms of technical analysis, the average price calculated for the D1 chart corresponds to 3,425-3,450 USD/oz. Since breaking through the peak of 3,500 USD/oz, the gold price has increased by approximately 300 USD. Technical indicators signal an overbought state, but the gold price has not shown any signs of a correction. The next resistance zones are based on round resistance levels such as 3,800-4,000 USD/oz. In the near future, if the gold price continues to increase, it may touch around 3,800-3,850 USD/oz. In case of a correction, the price will return to around 3,650 USD/oz.
Notable technical levels are listed below.
• Key support: ~3,720–3,738 USD/oz (near support/lower consolidation band); stronger support around 3,629–3,630 (previous bottom).
• Technical resistance/target: immediate resistance ~3,791 USD (recent top). Fibonacci targets if broken: 3,825 (0.5) → 3,872 (0.618) → 3,938 (0.786) → extension to ~4,022 (extension).
SELL XAUUSD PRICE 3824 - 3822⚡️
↠↠ Stop Loss 3828
BUY XAUUSD PRICE 3659 - 3661⚡️
↠↠ Stop Loss 3655

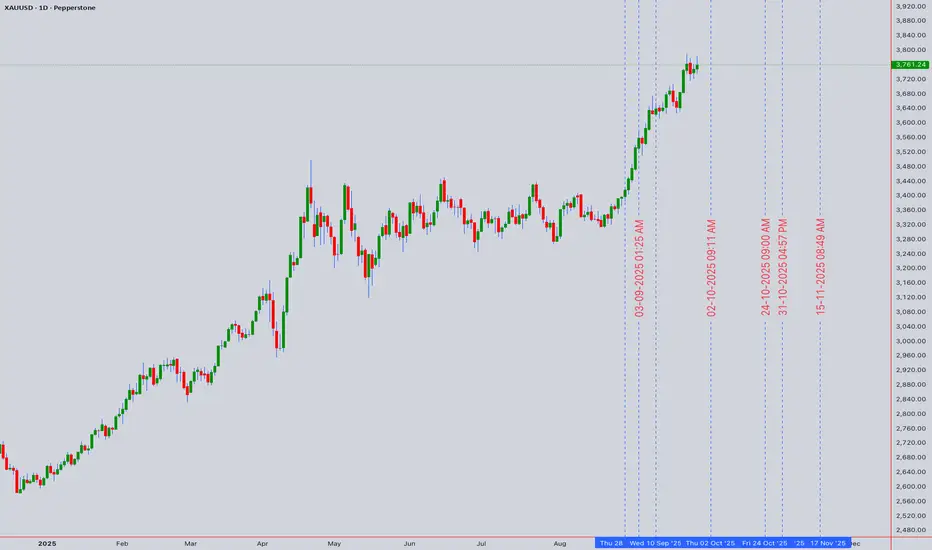
XAUUSD: MASSIVE BREAKOUT IMMINENT! Multi-Timeframe Analysis# 🚀 XAUUSD: MASSIVE BREAKOUT IMMINENT! Multi-Timeframe Analysis 📊
Closing Price: $3,761.24 | Date: Sept 27, 2025 ⏰ UTC +4
📈 INTRADAY TRADING SETUPS (Next 5 Days)
🎯 BULLISH SCENARIO
Entry Zone: $3,755 - $3,760 📍
Stop Loss: $3,740 🛑
Target 1: $3,785 🎯
Target 2: $3,810 🚀
🎯 BEARISH SCENARIO
Entry Zone: $3,770 - $3,775 📍
Stop Loss: $3,790 🛑
Target 1: $3,730 🎯
Target 2: $3,700 📉
🔍 TECHNICAL ANALYSIS BREAKDOWN
📊 KEY INDICATORS STATUS:
RSI (14): 67.2 ⚡ *Approaching Overbought*
Bollinger Bands: Price at Upper Band 🔥
VWAP: $3,752 - Acting as Dynamic Support 💪
EMA 20: $3,748 ✅ *Bullish Cross Confirmed*
Volume: Above Average 📊 *Institutional Interest*
🌊 WAVE ANALYSIS:
Elliott Wave suggests we're in Wave 3 of larger uptrend 🌊
Fibonacci Extension: $3,820 (161.8% target) 🎯
🔄 HARMONIC PATTERNS:
Bullish Gartley completion at $3,745 ✨
PRZ (Potential Reversal Zone) active 🔄
⚖️ SWING TRADING OUTLOOK (1-4 Weeks)
🚀 BULLISH TARGETS:
Weekly Resistance: $3,820 🏆
Monthly Target: $3,880 🌙
Gann Square of 9: $3,900 ⭐
📉 BEARISH INVALIDATION:
Weekly Support: $3,680 ⚠️
Critical Level: $3,650 🚨
🎭 MARKET STRUCTURE:
Trend: Strong Bullish 💪
Momentum: Accelerating 🔥
Wyckoff Phase: Mark-up Phase 📈
Ichimoku: All systems GREEN 🟢
⚡ RISK MANAGEMENT:
Max Risk per Trade: 2% 🛡️
R:R Ratio: Minimum 1:2 ⚖️
Position Size: Based on volatility 📏
🌍 MARKET CATALYSTS:
- Fed Policy Meeting Next Week 🏛️
- Geopolitical Tensions Supporting Gold 🌐
- Dollar Weakness Continuing 💵
🎯 FINAL VERDICT:
Gold shows STRONG BULLISH BIAS with multiple confluences aligning! 🚀
Watch for breakout above $3,775 for explosive move to $3,820+ 💥
Trade Management: Trail stops every 4H close above entry 📈
Key Level to Watch: $3,752 VWAP support 👀
---
*⚠️ Disclaimer: Trading involves risk. Always use proper risk management and never risk more than you can afford to lose. This analysis is for educational purposes only.*
For individuals seeking to enhance their trading abilities based on the analyses provided, I recommend exploring the mentoring program offered by Shunya Trade. (Website: shunya dot trade)
I would appreciate your feedback on this analysis, as it will serve as a valuable resource for future endeavors.
Sincerely,
Shunya.Trade
Website: shunya dot trade
🔔 Follow for Daily Updates | 💬 Comment Your Thoughts Below
XAUUSD (GOLD) Short to take out liquidityI think that gold will take out the trendline liquidity first before making new ATH again

GOLD falls slightly, market awaits inflation dataIn the Asian trading session on Friday morning (September 26), spot OANDA:XAUUSD hovered around 3,747 USD/ounce, as if "listening" for important news: the upcoming US PCE inflation data. This is considered an information bomb that can cause the gold market, US Dollar and stocks to shake strongly.
Earlier, on Thursday, gold lost steam when the number of unemployment claims in the US unexpectedly decreased. Specifically, the US Department of Labor reported that the week ending September 20 had only 218,000 applications, lower than the forecast of 235,000 and down 14,000 compared to the previous week. This news reduced the market's expectation that the Federal Reserve (Fed) would quickly cut interest rates.
However, gold prices still closed up 0.36% at $3,749.36/ounce, after rising as much as 0.6%. Also in the week, gold hit a historic peak of $3,790.82/ounce on Tuesday, a figure that made many investors “just sit and watch the chart and sigh with regret, just like AD, reviving when preparing to go to the island”.
According to CME's FedWatch tool, the possibility of the Fed cutting interest rates in October is now priced by the market at 85%, down from 90% before the employment data was released. In other words, the Fed is still holding the knife, just hasn't decided whether to cut the "interest rate" yet.
The US Bureau of Economic Analysis will release its PCE index for August today. Forecasts show PCE rising 2.7% year-on-year, up from 2.6% previously. The core PCE (excluding volatile energy and food prices) is expected to rise 2.9%, the same as in July.
Since this is the Fed’s preferred measure of inflation, any higher-than-expected figure could strengthen the US dollar, sending gold tumbling in the short term.
Gold, by its nature, does not generate interest. It only really shines in a low-interest-rate environment, which investors are hoping the Fed will soon bring.
Analysis of the technical outlook for OANDA:XAUUSD prices
Main Trend
Gold is still in a fairly clear uptrend channel.
The price is fluctuating around 3,739 USD/oz, approaching the midline of the uptrend channel.
Short-term trend: up but with slight corrections.
Important resistance
3,779 USD (Fib 0.382): if broken, gold can quickly test 3,825 - 3,872 USD.
3,938 - 4,022 USD: strong resistance zone, reaching the top of the uptrend channel, easy to take profit.
Important support
3,738 USD (current price).
3,720 USD (Fib 0.236 + nearest MA zone).
3,706 USD: strong support, breaking this zone, there is a risk of returning to test 3,628 USD.
RSI
Still above 60, indicating the market is still biased towards buyers, but showing signs of being a bit “overextended”.
SELL XAUUSD PRICE 3815 - 3813⚡️
↠↠ Stop Loss 3819
→Take Profit 1 3807
↨
→Take Profit 2 3801
BUY XAUUSD PRICE 3682 - 3684⚡️
↠↠ Stop Loss 3678
→Take Profit 1 3690
↨
→Take Profit 2 3696

Powell tightens, Dollar flies high, GOLD is falling!US Dollar Accelerates, Gold “Slides” After Fed Chairman Powell’s Cautious Speech OANDA:XAUUSD spot prices plunged in the latest session as the US dollar and Treasury yields rose in tandem, following a cautious speech by US Federal Reserve Chairman Jerome Powell.
Powell: “Caution remains the priority”
In his speech on Tuesday, Mr. Powell said the Fed still needs to carefully consider the two parallel risks: high inflation and a weak labor market. According to him, current monetary policy is still “sufficient to respond to the underlying economic developments,” although it is still limited.
Powell this time appeared “more open but tough,” as if to emphasize that the Fed cannot rush to cut interest rates when inflationary pressures are still persistent.
Yields and US Dollar put pressure
The sharp fall in gold prices also came from rising US Treasury yields. The 10-year yield inched up 3 basis points to 4.137%, while real yields rose nearly 3.5 basis points to 1.767%. This made gold, which does not yield interest, less attractive.
The US dollar index (DXY) also rose 0.66% to 97.85, making US dollar-denominated gold more expensive for investors holding other currencies.
Markets await US economic data
Traders are now focused on US GDP data, jobless claims and personal consumption expenditure (PCE) for fresh clues on monetary policy.
The gold market is reacting to both the Fed comments and geopolitical tensions.
Russia-Ukraine tensions and the haven factor
On the geopolitical front, US President Donald Trump unexpectedly declared support for Ukraine, asserting that “Kiev can take back all its territory”. At the same time, the Ukrainian army said it had attacked two oil pumping stations in Volgograd (Russia).
In the context of instability, gold is often considered a safe haven. However, with the acceleration of the dollar and bond yields, the pressure on gold is still quite large.
Outlook
The Fed will continue to rely on economic data to make decisions, thereby directly affecting the US dollar, interest rates and market sentiment.
Investors now expect the Fed to cut interest rates by 25 basis points at each of its remaining meetings in 2025, with another cut in the first quarter of 2026.
However, with interest rates still an “unknown” factor, gold, which does not generate income, will find it difficult to break out if the Fed does not send a clear signal about the pace of policy easing.
Technical outlook analysis of OANDA:XAUUSD
Overall Trend
• The daily chart (D1) shows that gold has been in an uptrend channel since August, with breakout candles accompanied by high volume.
• Current price: 3,734 USD/oz (after testing resistance near 3,750 – 3,791).
• The main trend is still up, but the price is having a technical correction after a hot rally.
Key technical milestones
Key Technical Levels
• Near Resistance:
3,791 USD (Fib 0.382 + recent high).
3,825 USD (Fib 0.5).
• Far Resistance:
3,872 USD (Fib 0.618).
3,938 USD (Fib 0.786).
4,022 USD (maximum target according to Fib 1.0).
• Important Support:
3,720 USD (Fib 0.236 + MA zone).
3,628 USD (Fib 0.0 – stronger support, in case of deep correction).
RSI
• RSI has reached the overbought zone (>70) and cooled down → supporting a short-term correction before continuing to increase.
Personal trading idea
• Entry 1 (cautious): Wait for the price to correct to 3.720 – 3.730 (nearby support) to buy.
• Entry 2 (risky): Can enter immediately when the price holds above 3.734 with a short stoploss.
• Stoploss: Below 3.700 (safer than below 3.628 if you want to hold long-term).
• Take Profit (TP):
o TP1: 3.791 (nearby resistance).
o TP2: 3.825 (Fib 0.5).
o TP3: 3.872 – 3.938 (strong resistance).
o Further: 4.022 (maximum target in an uptrend).
SELL XAUUSD PRICE 3767 - 3765⚡️
↠↠ Stop Loss 3771
→Take Profit 1 3759
↨
→Take Profit 2 3763
BUY XAUUSD PRICE 3700 - 3702⚡️
↠↠ Stop Loss 3696
→Take Profit 1 3708
↨
→Take Profit 2 3714

Gold Long Setup: Tight Stop, 29x Risk/Reward#DayTrading #Gold
TVC:GOLD trade with a tight stop loss. Risk/Reward 29. I ignored gold’s uptrend for a while but decided to try a long position with a short stop loss. Looking at the 6-month chart, there’s still room to climb.
Entry: $3,642
Stop Loss: $3,609
First Take Profit: $4,600
Risk/Reward: 29.03
Chart:

GOLD has all-round support, Fed, geopoliticsOn September 23, the OANDA:XAUUSD market experienced a “roller coaster”: initially soaring to a record $3,791/ounce in the European session, then cooling significantly when the US Federal Reserve Chairman Jerome Powell spoke. However, gold still closed higher than at the beginning of the day, showing that the big uptrend has not been shaken.
As of the time of writing, gold has adjusted down slightly to $3,754/oz, equivalent to a decrease of 0.25% and about $10 on the day.
What keeps gold “shining”?
• Fed monetary policy: Powell stressed that the Fed must balance high inflation with a weakening job market. The Fed cut interest rates last week and the FedWatch tool shows a nearly 90% chance of further cuts in October. Lower interest rates make gold more attractive than bonds or savings.
• Fed view: While Powell has been cautious, other officials such as Bowman have warned that the Fed may be “slowing down” and need to cut interest rates faster if the economy worsens. This further reinforces expectations that gold will benefit.
• Hot geopolitics: NATO accused Russia of repeatedly violating the airspace of member countries, while Russia-Ukraine tensions were further complicated by the latest statement from former President Donald Trump. After meeting with President Zelensky, Trump unexpectedly strongly supported the possibility of Ukraine regaining all of its territory. This escalation of tensions has caused a sharp increase in safe-haven demand for gold.
• Market demand: Commerzbank pointed out that in addition to interest rates, factors such as ETF capital flows, doubts about the independence of the Fed and global political risks are simultaneously pushing up gold prices.
Fundamental Outlook:
Investors are focusing on the Personal Consumption Expenditures (PCE) index, the Fed’s preferred inflation measure, due later this week. If inflation continues to run hot, the Fed may be more cautious, but the pressure of US public debt and international instability remains a “golden support” for the price of this precious metal.
Since the beginning of the year, gold prices have increased by nearly 40%, the strongest pace since the late 1970s. With low interest rates, political risks and increased demand for shelter, the general trend still favors gold to maintain its “halo”.
Technical outlook analysis of OANDA:XAUUSD
• Main trend:
Gold price is still in the uptrend channel, each correction to the lower edge bounces up → buyers are in control.
• MA line:
Price is firmly above the EMA21 line, and the EMA21 is still pointing up → confirming the uptrend. The EMA plays a quite effective dynamic support role.
• Important support:
o Nearby: 3,720 – 3,738 USD (Fibo 0.236 zone + lower channel edge).
o Stronger support: around 3,628 USD (Fibo 0 bottom).
• Resistance – target above:
o Nearby: 3,779 – 3,791 USD (Fibo 0.382 + previous candle high).
o Next target: 3,825 USD (Fibo 0.5) → 3,872 USD (Fibo 0.618). If the breakout is successful, the possibility of advancing to the 3,939 USD zone is still open.
• RSI & momentum:
RSI is high, but has not yet fallen into extreme overbought. Momentum shows that there is still momentum, but there may be a pause (small pullback) before continuing to increase.
• Candlestick structure:
Recent candles have small bodies, narrow fluctuations → signs of market accumulation around the top. If the breakout is accompanied by liquidity, the possibility of further increase is very high.
The current gold trend is still inclined to increase. As long as the price stays above the support zone of 3,720 - 3,738 USD, the prospect of conquering the 3,779 - 3,825 - 3,872 USD marks is completely feasible.
SELL XAUUSD PRICE 3826 - 3824⚡️
↠↠ Stop Loss 3830
→Take Profit 1 3818
↨
→Take Profit 2 3812
BUY XAUUSD PRICE 3728 - 3730⚡️
↠↠ Stop Loss 3724
→Take Profit 1 3736
↨
→Take Profit 2 3742

GOLD (XAUUSD): Bullish! Continue To Buy! In this Weekly Market Forecast, we will analyze the Gold (XAUUSD) for the week of Sept. 22 - 26th.
Gold is bullish on all HTFs. Selling is not an option. Wait for a pullback, and jump on the uptown train! Dips are your friend, so be patient and wait this market to take a breather.
Selling is only valid when there is a bearish break of structure. Until that happens, buy it, my friend.
Be wary of the pullback, as that move is likely to be corrected, but that would set up a great long opportunity!
Enjoy!
May profits be upon you.
Leave any questions or comments in the comment section.
I appreciate any feedback from my viewers!
Like and/or subscribe if you want more accurate analysis.
Thank you so much!
Disclaimer:
I do not provide personal investment advice and I am not a qualified licensed investment advisor.
All information found here, including any ideas, opinions, views, predictions, forecasts, commentaries, suggestions, expressed or implied herein, are for informational, entertainment or educational purposes only and should not be construed as personal investment advice. While the information provided is believed to be accurate, it may include errors or inaccuracies.
I will not and cannot be held liable for any actions you take as a result of anything you read here.
Conduct your own due diligence, or consult a licensed financial advisor or broker before making any and all investment decisions. Any investments, trades, speculations, or decisions made on the basis of any information found on this channel, expressed or implied herein, are committed at your own risk, financial or otherwise.

GOLD continues to set records, market awaits Powell's speechIn the Asian trading session on the morning of September 23, the spot OANDA:XAUUSD price fluctuated around 3,745 USD/ounce, after just setting a new record. Previously, in the first session of the week (September 22), gold increased sharply by 62.23 USD (equivalent to 1.7%), closing at 3,746.63 USD/ounce and on this trading day, it jumped to 3,759.29 USD/ounce, the highest level in history.
OANDA:XAUUSD was supported by expectations that the US Federal Reserve would continue to cut interest rates. Low interest rates are generally beneficial for the precious metal because they do not yield. Despite being considered “overbought”, gold has yet to show any signs of technical weakness.
Last week, Fed Chairman Jerome Powell “poured cold water” on expectations of too-fast policy easing after the Fed cut interest rates. However, the move did not stop money from pouring into gold ETFs, with holdings rising the most in more than three years.
This week, global investors are focused on a series of speeches from Fed officials, especially Mr. Powell's public speech on Tuesday afternoon (US time). According to the schedule, he will attend the "Economic Outlook Lunch" event in Rhode Island on September 24, where he will dialogue with more than 500 business and civil leaders. This is considered an opportunity for the market to grasp more about the upcoming monetary policy direction from the Fed.
Technical analysis of OANDA:XAUUSD outlook
Main Trend
Gold is in a steep uptrend channel, showing strong momentum.
The most recent candles are all sticking to the channel line and above the MA line, showing that the uptrend is still maintained.
Support and Resistance zones
Important support: 3,707 USD and 3,673 USD/ounce (Two green lines on the chart). This is the zone where if the price corrects, it is likely to bounce back.
Nearest resistance: 3,779 USD (Fibonacci level 0.382). If broken, gold can head towards: 3,825 USD (Fib 0.5), 3,872 USD (Fib 0.618), further: 3,938 USD (Fib 0.786).
Technical indicators
RSI: is in the high zone (above 70, signaling “overbought”), but has not given a strong reversal signal → indicating that the market still has upward momentum.
MA: moving average is sloping up, price is much higher than MA → strengthening the uptrend.
Trend analysis
Gold may have some short-term corrections to “gain momentum” around the $3,707 – $3,673 range, but the medium-term trend remains bullish. If the price channel is maintained and the support zone is not breached, there is a high possibility that gold will conquer the $3,779 → $3,825 → $3,872 range in the near future.
SELL XAUUSD PRICE 3789 - 3787⚡️
↠↠ Stop Loss 3793
→Take Profit 1 3781
↨
→Take Profit 2 3775
BUY XAUUSD PRICE 3726 - 3728⚡️
↠↠ Stop Loss 3722
→Take Profit 1 3734
↨
→Take Profit 2 3740

XAUUSD Very aggressive Bullish Leg started.Gold (XAUUSD) is on a remarkable bounce just after marginally breaking below the 4H MA50 (blue trend-line) and reaching the bottom of the 1-month Channel Up, which is technically the new Bullish Leg of the pattern.
The previous one extended all the way to +10.65% (which gives us a $4000 long-term Target) before the 4H RSI started to decline on Lower Highs, which on a sidenote gave us the bullish confirmation required when the RSI broke above them today.
On the short-term however, we are looking for a much more plausible Target at $3800, which has been the standard mini-rally sequence that this Channel Up has offered.
-------------------------------------------------------------------------------
** Please LIKE 👍, FOLLOW ✅, SHARE 🙌 and COMMENT ✍ if you enjoy this idea! Also share your ideas and charts in the comments section below! This is best way to keep it relevant, support us, keep the content here free and allow the idea to reach as many people as possible. **
-------------------------------------------------------------------------------
💸💸💸💸💸💸
👇 👇 👇 👇 👇 👇

GOLD MARKET ANALYSIS AND COMMENTARY - [Sep 22 - Sep 26]Last week, OANDA:XAUUSD prices fluctuated strongly: opening at 3,645 USD/oz, falling to 3,626 USD/oz, rebounding to 3,707 USD/oz after the FED cut interest rates by 0.25%, but being under profit-taking pressure and cautious statements from Chairman Powell, the price fell to 3,627 USD/oz before recovering and closing at 3,685 USD/oz.
The Dot Plot shows that the FED may only cut 2 more times in 2025 and 1 time in 2026, while Powell's speech is no longer highly appreciated by the market due to the end of his term and the influence of President Trump.
In the short term, gold may adjust and accumulate, waiting for US economic data, US-China trade and geopolitical tensions. This week, the focus will be on the August PCE index: if it exceeds 3% YoY, the FED may postpone the interest rate cut, creating downward pressure on gold; if it is around 2.9% or lower, gold will be supported.
📌According to technical analysis, the gold price continues to be in the overbought zone. If the gold price does not surpass 3,708 USD/oz this week, it will quickly be pushed down to 3,626 USD/oz. If this level cannot be maintained, the gold price is at risk of falling to the 3,550 USD/oz area, or lower. On the contrary, if it surpasses 3,708 USD/oz, the gold price next week may reach 3,750 USD/oz.
Notable technical levels are listed below.
Support: 3,673 – 3,614 – 3,600 USD
Resistance: 3,700 – 3,707 USD
SELL XAUUSD PRICE 3751 - 3749⚡️
↠↠ Stop Loss 3755
BUY XAUUSD PRICE 3549 - 3551⚡️
↠↠ Stop Loss 3545

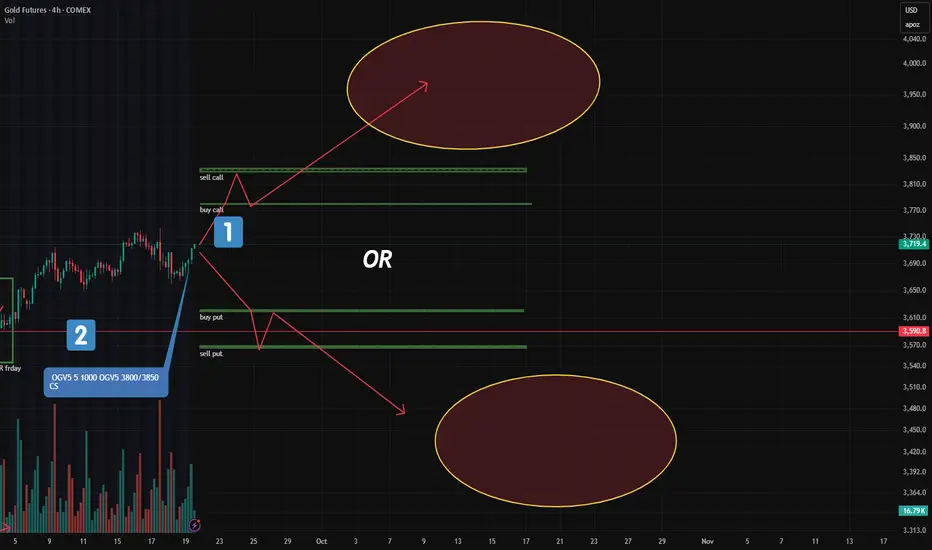
Gold: Major New Option Portfolios Signal Strong Moves AheadFriday’s CME report showed a surge in large option blocks in gold — two of them stand out.
🔹 1. "Long Condor" on December Futures (GCZ24)
This is the most significant structure added:
Targets a move below $3,620 or above $3,780
In other words: a breakout is expected, not consolidation
📌 Key point:
A "Long Condor" profits from volatility, not direction.
It wins if price moves sharply — up OR down — but loses if it stays flat.
💡 My note:
When I first encountered delta-neutral strategies like this as a Forex trader — my brain exploded.
No directional bias… yet clearly positioned for action?
That was the moment I realized: options are a different game.
🔹 2. Bull Call Spread (Oct Series): $3800–$3850
Another key play:
A classic bullish call spread at 3800/3850
Target: upside beyond current levels
But here’s the difference:
Unlike the "Long Condor", this one needs a clear upward move — and soon. Within a few days.
This isn’t about volatility.
It’s a directional bet that gold will rise.
🧠 Bottom Line:
One portfolio says: "Breakout coming — no matter which way."
Another says: "Gold goes up — and soon."
Are they aligned?
Contradictory?
Or could both win?
Trade smarter, not harder! Looking to boost your profits with valuable market insights and data-driven entry points? Join us or keep moving!
XAUUSD (GOLD) Forecast✨📊 XAUUSD (GOLD) Forecast – Intraday & Swing Outlook ✨💰
Asset Class: XAUUSD (GOLD CFD)
Closing Price: 3,685.11 📍 (20th Sept 2025, 12:50 AM UTC+4)
🔎 Multi-Lens Technical Analysis
🕯 Candlestick & Patterns
📉 Head & Shoulders → Watching neckline at 3,660
📈 Bull Trap/ Bear Trap → Possible fakeouts near 3,700 zone
🔄 Harmonics + Fibonacci → Reversal signals align around 3,640 – 3,650
🌊 Theories in Play
Elliott Waves → Wave 5 completion likely near 3,710 – 3,725
Wyckoff → Distribution phase signs visible 🔔
Gann → Time/price square shows resistance 3,720 – 3,730
Ichimoku → Cloud support at 3,655
📊 Indicators & Tools
RSI: 64 → Near overbought ⚠️
Bollinger Bands: Upper band at 3,710 = overextension risk
VWAP: Anchored VWAP support at 3,660
Moving Averages:
EMA20 (H1) = 3,662 ✅
Golden Cross intact (Bullish bias)
⏱ Trading Time Frames
Intraday Focus: 5m / 15m / 1H / 4H
Swing Focus: 4H / Daily / Weekly
🎯 Trading Strategy
Intraday Plan (Sept 20 – 23)
🟢 Buy Zone: 3,655 – 3,665 (Target: 3,690 – 3,705)
🔴 Sell Zone: 3,710 – 3,725 (Target: 3,670 – 3,650)
Swing Plan (Sept 20 – 27)
🟢 Swing Long Entry: 3,640 – 3,655 (Target: 3,720 – 3,745)
🔴 Swing Short Entry: 3,730 – 3,745 (Target: 3,660 – 3,640)
🌍 Market Context
📰 Fed policy & USD strength will remain key drivers
⚔️ Geopolitical tensions = higher volatility expected
🛡 Gold remains safe-haven bid during risk-off
✅ Conclusion
📊 Gold (XAUUSD) trades in critical resistance zone near 3,700.
Short-term bias → Bullish, but cautious of traps
Swing bias → Range-bound 3,640 – 3,745
🎯 Traders should buy dips & sell rallies within zones
⚡Stay sharp, manage risk! ⚡
For individuals seeking to enhance their trading abilities based on the analyses provided, I recommend exploring the mentoring program offered by Shunya Trade. (Website: shunya dot trade)
I would appreciate your feedback on this analysis, as it will serve as a valuable resource for future endeavors.
Sincerely,
Shunya.Trade
Website: shunya dot trade
⚠️Disclaimer: This post is intended solely for educational purposes and does not constitute investment advice, financial advice, or trading recommendations. The views expressed herein are derived from technical analysis and are shared for informational purposes only. The stock market inherently carries risks, including the potential for capital loss. Therefore, readers are strongly advised to exercise prudent judgment before making any investment decisions. We assume no liability for any actions taken based on this content. For personalized guidance, it is recommended to consult a certified financial advisor.
