100% UPSIDE Precious Metals Playbook — Gold, Silver & Miners ETF🏛️ Precious Metals Playbook — Gold, Silver & Miners ETFs
🔑 Executive Summary
• We combine the 2026 parabolic metals thesis gold/silver/platinum with leveraged ETF implementation to target triple-digit portfolio upside under view that gold’s bull run continues into 2026 $5,500–$6,500/oz.
• Miners’ torque has been massive in 2025: GDX ~+123% YTD while gold itself is up ~51% YTD; levered miners e.g., NUGT, JNUG, GDXU show ~360–700%+ YTD — confirming high beta to metal.
• Implementation below caps any single ETF at 10% within 10–20% limit and keeps ≥50% of the book in 2×–3× products for upside torque while diversifying across metal vs. miners and gold vs. silver.
________________________________________
🌍 Market View Condensed
• Gold: Momentum + macro easing bias, softer USD, central-bank demand support the “second-leg melt-up” case into 2026; miners’ margin torque can deliver 2–3× metal beta.
• Silver: Structural deficits + PV/EV/datacenter demand have super-charged silver miners in 2025.
________________________________________
📊 2025 YTD Scorecard Key ETFs
• Gold metal (unlevered): GLD +50.9% YTD.
• Gold miners (unlevered): GDX ~+123% YTD.
• Silver miners (unlevered): SIL ~+137% YTD.
• Leveraged miners:
o NUGT (2× miners) ~+361% YTD; JNUG (2× juniors) ~+394% YTD.
o GDXU (3× miners ETN) ~+706% YTD (top performer cohort of 2025).
• Leveraged gold & silver metals: UGL (2× gold) ~+125% YTD; DGP (2× gold ETN) ~+123% YTD; AGQ (2× silver) ~+159% YTD.
________________________________________
🧩 Portfolio Construction Target book: $100,000
Constraints honored: max 10% per ETF, ≥50% allocation to 2×/3× ETFs.
🎯 Target Allocation 60% leveraged / 40% unlevered
Leveraged — 60% total
• 10% GDXU 3× gold miners ETN
• 10% NUGT 2× gold miners
• 10% JNUG 2× junior gold miners
• 10% AGQ 2× silver
• 10% UGL 2× gold
• 10% DGP 2× gold ETN
Rationale: diversify torque across miners vs. metals, 2× vs. 3×, and gold vs. silver to avoid single-product concentration risk.
Unlevered — 40% total
• 10% GDX VanEck Gold Miners
• 10% GLD SPDR Gold Trust
• 10% SIL Global X Silver Miners
• 10% SLV (or) IAU silver or gold bullion, choose per preference
Rationale: ballast and liquidity; preserves exposure if volatility in levered products forces risk-off.
Dollar mapping (@ $100k):
• Each 10% line = $10,000 notional; 10 tickers → $100,000 fully invested.
________________________________________
📈 Scenario Analysis Hypothetical, path-dependent
Gold advances toward $5,500–$6,500 by 2026. We translate that into rough upside bands using historical betas and allowing for daily-reset drag on leveraged products.
• Base case +100% portfolio:
o Gold +40–60% from here; 2× gold funds net ~+70–110% conservative for compounding/decay.
o GDX sensitivity ~2–3× metal → ~+80–150%; 2× miners ~+160–300%; 3× miners can overshoot in trending tapes.
o With 60% in levered assets and 40% in unlevered miners/metals, blended outcome can land near ~+100% if trends persist and volatility stays manageable.
• Stretch case +200% portfolio:
o If the “second-leg melt-up” plays out momentum + flows + central-bank bid and miners’ margins expand, levered miners dominate returns similar to 2025 YTD pattern.
o Portfolio hits ~+200% if miners continue to over-beta the metal and 3× exposure compounds favorably no major whipsaws.
Risk reality check: Leveraged ETFs reset daily; high volatility or choppy reversals can erode returns even if the long-term trend is up. Position sizing 10% lines and diversification across instruments help mitigate single-name decay risk.
________________________________________
🧭 Implementation Notes
• Execution: stage entries over several days reduce gap/vol risk, prioritize liquid hours; use stop-loss/hedge bands on the 3× sleeve.
• Rebalancing: monthly bands ±3–5% per line to defend the 60/40 torque mix.
• Risk budget: expect 3× ETN drawdowns >60% in sharp pullbacks; keep dry powder OR pre-define risk limits.
________________________________________
🗂️ Product Appendix — Quick Stats
• GDXU (3× miners ETN): ~+706% YTD; ER ~0.95%.
• NUGT (2× miners): ~+361% YTD.
• JNUG (2× junior miners): ~+394% YTD.
• AGQ (2× silver): ~+159% YTD.
• UGL (2× gold): ~+125% YTD.
• DGP (2× gold ETN): ~+123% YTD.
• GDX (miners): ~+123% YTD.
• SIL (silver miners): ~+137% YTD.
• GLD (gold): ~+50.9% YTD.
________________________________________
⚠️ Disclosures & Risks
Leveraged ETFs/ETNs are short-term trading tools with daily reset/compounding; they can significantly underperform their leverage multiple over holding periods with high volatility or mean-reversion. ETNs (e.g., GDXU, DGP) also carry issuer credit risk. This memo is informational, not investment advice; consider your risk tolerance, liquidity needs, and tax/ETN suitability.
GDX

GDX Calls So currently I think gdx is about to explode…. Gold has extended its rally and gdx has been dead in water. From 1 hr chart is in ascending triangle… as long as we hold this should pop out and once it does this 97-100 in sight. Especially if gold continues match to $4650 by EOY.

Silver Market Once in a Lifetime Breakout: 120/140 USD PT📌 Base case unchanged: I’m still targeting $125–$150 within 12–24 months. The next leg of the bull run should accelerate after the all-time-high (~$49–$50) breaks and sticks. Spot is circling the mid-$40s (recent highs ~$46–$47), so the setup is in place. 💎✨
🎯 Bottom line
Silver’s structural deficit + gold leadership + policy-driven cost inflation meet a fresh technical regime. The ATH break is the ignition; $65–$75 is the first destination, and the $125–$150 12–24M target stays live if real yields drift down and PV/electronics demand stays elevated despite thrifting. Manage the whipsaws; respect $38 as the cycle guardrail. BUY/HOLD bias remains warranted. 🚀💎🔥
________________________________________
📊 Technical Outlook (2-week candles)
• Structure: Multi-year Cup & Handle from 2011 → 2020 base → 2024/25 handle. The $40 neckline break is done; a weekly/monthly close > $49.50 flips the market into price discovery.
• Levels that matter:
— Resistance: $49–$50 (ATH), then $65–$75 (measured move / vacuum), interim supply near $57–$60.
— Support: $44.5–$45 (breakout retest), $41–$42 (former cap), deeper $38 and $34 (trend break if lost).
• Momentum breadth: Higher highs on price with constructive consolidation while gold prints records → classic GSR mean-reversion tailwind. 📈⚡
________________________________________
🧭 12–24 Month Path Outlook
Base (55%) – Break & run: Close above $50 triggers trend systems and discretionary chase → extension to $65–$75 by mid-’26, stair-step into $100–$125 by late ’26/early ’27; overshoot to $150 on macro squeeze. 🚀
Alt up (15%) – Blow-off: Parabolic sprint to $85–$100 immediately post-break, sharp retrace to high-$60s, then grind to $125–$150.
Pullback (25%) – Fakeout & reload: Failure at $49–$50, mean reversion to $41–$42 or even $38, rebuild positioning; timeline slips ~1–2 quarters.
Bear tail (5%) – Macro shock: USD spike + real-yield jump + PV air-pocket; lose $34 → cycle delay (target deferred, not canceled). ⚠️
________________________________________
🚦 Catalyst Scorecard — Visible & Hidden Drivers (0–10)
1. Fed path & real yields — 9.0/10 (Bullish)
The Fed cut 25 bps on Sept 17 (now 4.00–4.25%) and signaled scope for more easing this year; several officials reinforced that bias. Lower real yields are the single strongest tailwind for non-yielding metals. 🏦
2. U.S. Dollar trend — 6.0/10 (Net-Bullish for silver)
DXY has been firm the last two weeks, a minor headwind; but with the Fed easing bias, dollar upswings look tactical, not structural. Any USD rollover clears the runway. 💵
3. Gold leadership & GSR mean-reversion — 8.5/10 (Bullish)
Gold at/near record highs ~$3.75–$3.80k keeps silver in tow. GSR ~80–84 is elevated vs. bull-market medians → skew favors silver outperformance on a gold grind. 🪙⚖️
4. Structural deficit — 8.5/10 (Bullish)
Fourth straight sizable deficit; ~678 Moz cumulative drawdown since 2021. 2025 still projected to run a ~115–120 Moz deficit despite softer bar/coin demand. 📉📦
5. Industrial demand (PV/Electronics) — 7.5/10 (Bullish with nuance)
PV/electrical demand at record highs; PV up again in 2024 (+3% y/y) and installations broadened across 38 “>1GW” countries. Offsetting force: silver thrifting (0BB, copper plating) → another 10–12% loading cut likely in 2025. Net: total ounces still robust as capacity growth outpaces thrifting… for now. ☀️🔋
6. ETP/ETF flows — 7.5/10 (Bullish)
Global silver ETPs flipped to net inflows in 2024 (+62 Moz) and kept adding into 2025. SLV shows ~15,362 tonnes in trust as of Sept 26—a sizable base of “sticky” investment metal. 📊📈
7. LBMA & COMEX stocks / liquidity premia — 7.0/10 (Bullish)
LBMA silver in London: 24,646 t (Aug) — up m/m but well below pre-2020 peaks; COMEX registered ~196 Moz. Tight-ish float + delivery frictions can widen location premia during spikes. 🏭📦
8. Tariff & logistics regime — 7.0/10 (Bullish via inflation/frictions)
U.S. 50% copper tariff (Aug 1) lifts domestic copper premia and can indirectly affect by-product silver flows and refining economics. Recent gold bar tariff confusion also showed how policy can snarl bullion logistics; LBMA welcomed clarifications, and noted silver discussions continue—headline risk persists. 🚢⚙️
9. Base-metal supply shocks (by-product linkage) — 6.5/10 (Bullish)
Grasberg disruptions and Peru protest-related shutdowns point to emerging fragility in copper output; since much silver comes as a by-product, copper hiccups can tighten silver supply at the margin. ⛏️🌍
10. Mexico policy/permitting — 6.0/10 (Bullish later, volatile now)
World’s top silver producer remains mired in regulatory overhang; exploration still depressed post-2023 reforms. Any genuine permitting thaw would be years from ounces—near-term effect is restraint. 🇲🇽📜
11. India retail/investment demand — 6.5/10 (Bullish)
Silver hitting record rupee highs; local ETFs up ~50%+ YTD; retail investment +7% y/y in H1’25. Seasonal tailwinds into festivals. 🎉🇮🇳
12. China macro & manufacturing — 5.5/10 (Mixed)
Electronics appetite is steady, PV leadership intact; property stress caps jewelry, but investment demand remains opportunistic. Net: supportive on dips, headline-sensitive. 🏗️🇨🇳
13. Systematic/CTA & options positioning — 6.0/10 (Volatility amplifier)
Trend models chased the $40 break; dealer gamma turns negative above $45–$47 at times, inviting intraday whipsaws. 🎯📉📈
14. Geopolitics (Ukraine/Mideast/Taiwan) — 5.5/10 (Event-Bullish)
Safe-haven jolts remain episodic; they matter more after the ATH triggers chase behavior. 🌍🔥
________________________________________
🧨 Hidden (under-traded) catalysts
• GSR compression trade: Once $50 breaks, programmatic rebalancing from gold to silver can accelerate relative gains. (GSR in the 60s pulls silver deeper into triple digits fast.) ⚖️💥
• By-product elasticity: Copper policy & outages (tariffs, mine incidents) can reduce silver by-product feed even as PV demand hums—this is not fully priced. 🔧⛏️
• Vault/warehouse microstructure: LBMA/COMEX stock changes vs. delivery notices can suddenly widen time/location spreads → sparks short-term basis fireworks that lift spot. 📦⏳
________________________________________
🛠️ Positioning & Execution
• Core: BUY/HOLD core metal exposure; add on $44–$45 retests; reload heavier on $41–$42.
• Breakout tactics: On a weekly close > $50, ride call spreads (e.g., $60/$90 9–15M out on SI or SLV) or risk-reversals (sell $35 puts to fund $80–$100 calls).
• Risk controls: Invalidate momentum if weekly close < $38; cut leverage.
________________________________________
🧩 Fundamental NOTES
• Spot context: XAG/USD ~$46, 52-week range ~$28–$46.7. ATH ~$49–$50 (1980/2011).
• Deficit math: Metals Focus/Silver Institute show fourth straight deficit; 2025 deficit ~117 Moz amid record industrial demand and only modest supply growth.
• Supply: 2024 mined = 819.7 Moz; 2025e ≈ 835.0 Moz (+1.9% y/y). Primary mine share keeps slipping; AISC fell in 2024 (by-product credits).
• PV nuance: Silver loadings ↓ ~10–12% in 2025e, but global PV installations broadened; total silver ounces into PV remain lofty even as intensity falls.
• Vaults/ETFs: LBMA London holdings 24,646 t (Aug). SLV metal in trust 15,361.84 t (Sep 26). COMEX registered ~196 Moz.
• Macro winds: Fed cut and may cut more in 2025 → lower real yields + easier USD path.
• Policy kicker: U.S. copper tariffs live; gold bar tariffs clarified after August confusion; silver remains under policy watch—any mis-classification can jolt premia.
________________________________________

GDX - Gold Miners ETF: Inverse Head & shouldersGold prices have surged to unprecedented levels in light of recent trade policy changes. The announcement by US President Donald Trump regarding a new 25% tariff on essential imports such as cars, semiconductors, and pharmaceuticals has created a wave of uncertainty among investors. This risk-off sentiment has driven many to seek refuge in safe-haven assets like gold.
Nevertheless, this upward momentum may encounter challenges if a trade agreement with China comes to fruition. A successful deal could alleviate global trade tensions, leading to a decrease in gold demand and possibly resulting in selling pressure.
However sustained high bullion prices could prove to be a significant advantage for gold miners. The GDX ETF is showing a persistent inverse head and shoulders pattern, indicating potential for further gains.

Is the Gold Bull Market Over? Gold has had a double digit correction form the all time high.
Pulling back just over 11% is very healthy if the bull market trend is to resume.
On an intra day 4 hour time frame gold is still looking very weak.
However the weekly pattern was able to hold a key weekly bullish level.
Gold is at a very tricky inflection point so i would personally wait until you get some key breakout or breakdown signals.
Look towards your miners to see if they are gaining additional liquidity. They will often lead.

GOLD Bull Market Over?Gold has fallen yet again today. Busting through some major technical support.
Gold is falling for 3 main reasons;
1. Trump / XI (USA vs China) meeting is expecting positive negotiations.
2. Mega Cap Tech Earnings: markets love to chase tech higher.
3. FOMC rate cut expectations.
We believe gold had a strong chance at retesting the daily 200 MA.
Picked up some GLD calls today.

GOLD Bull Market Price Target is 7 500 USD accumulate on dips🏆 Gold Market Long-Term Update 12/24 months
📊 Technical Outlook Update
🏆 Bull Market Overview
▪️2weeks/candle price chart
▪️Gold Bull market in progress
▪️1976/1979 650% gains - Bull Market 1
▪️1999/2012 650% gains - Bull Market 2
▪️2016/2027 650% gains- Bull Market 3
▪️Price Target BULLS 7500 USD
▪️650% gains off the lows
▪️will hit in 2026/2027
⭐️Recommended strategy
▪️BUY/HOLD accumulate dips
▪️BUY/HOLD physical gold
▪️BUY/HOLD GLD/GDX

2026 Precious Metals ETF Playbook: GDX SIL PPLT Parabolic Rally🚀 2026 Precious Metals Playbook: Why GDX, SIL & PPLT Could Go Parabolic
________________________________________
🏁 Gold’s 2025 melt-up has flipped the script: spot blew through records and major banks now float targets near $3,800 by late-2025 and ~$3,900 by mid-2026. With expected Fed cuts, a softer USD, and persistent central-bank buying, the macro setup could keep miners turbocharged into 2026.
🧲 At the same time, robust demand (ETF inflows + central banks) even with real yields elevated shows that “fear and fiscal” have joined real rates as primary drivers. That’s the kind of buyer base that can underpin a blow-off leg higher in gold.
🔥 The gamma-squeeze setup is real in commodities too: heavy call buying can force dealers to chase deltas in futures, adding fuel to upside. If momentum reignites, gold’s second leg could shock even the bulls.
⚡️Silver is riding a different (but rhyming) story: persistent structural deficits and 14-year-high prices, with industry demand led by solar PV, electronics, EVs—and increasingly high-end compute/AI infrastructure where silver-bearing solders, contacts, and power electronics are critical.
☀️Macro tailwinds for silver’s industrial side look alive into 2026: PV installations, grid storage rollouts, and electrification keep factory demand stout—even with ongoing thrifting. Sheer volume growth can still outmuscle intensity declines.
🛠️Platinum’s bull case hinges on multi-year market deficits, entrenched autocatalyst substitution from palladium, and optionality from the early hydrogen economy. Supply hiccups in South Africa, paired with steady auto/industrial draws, can squeeze inventories quickly.
________________________________________
🎯 Aggressive 2026 Scenarios & Targets
🧭 Premise: a “second-leg” melt-up where gold futures extend from ~$3,500 toward ~$7,000 (+100%) via treasury-to-hard-assets rotation and options-driven squeezes; silver plays catch-up with an industrial/safe-haven crescendo; platinum rides persistent deficits and auto/hydrogen demand.
GDX — VanEck Gold Miners ETF
Aggressive 2026 price target: $150–$220 (vs. ~$70 now).
Why it could happen:
• 💹 Margin math: with AISCs roughly anchored, every +$1000/oz in gold drops largely to miner margins, historically producing 2–3× sensitivity in equities vs. the metal.
• 🔁 Flow catalysts: ETF inflows, central-bank buying, CTA trend signals, and options gamma dynamics can stack.
• 🏦 Treasury rotation: if real yields slide and fiscal angst lingers, the allocation shift into gold miners can snowball.
SIL — Global X Silver Miners ETF
Aggressive 2026 price target: $95–$130 (vs. ~$66 now).
Why it could happen:
• 🏭 Industrial drumbeat: PV growth into 2026 + electrification keeps factory demand strong—even with thrifting.
• 🧮 Deficit persistence: multiple years of market deficits tighten balances and prime upside tails.
• 🧠 AI halo effect: data-center buildouts and advanced packaging sustain electronics demand where silver’s conductivity wins, adding narrative firepower to price action.
PPLT — abrdn Physical Platinum Shares
Aggressive 2026 price target: $250–$375 (vs. ~$128 now).
Why it could happen:
• ⛏️Deficits, again: without a step-change in mine supply, persistent market shortfalls can spark violent repricing.
• 🚗 Sticky substitution: platinum that replaced palladium in gasoline autocats is embedded in designs—demand that doesn’t easily reverse.
• 🔋 Optionality: PEM electrolyzers/fuel cells (hydrogen) magnify the upside if policy or energy security tightens timelines.
________________________________________
🧭 2026 Primary Drivers to Track
🏛️Monetary & macro: Fed path, USD, and real yields remain core—if they trend down, gold’s opportunity cost falls and risk-hedging bids rise.
🏦 Official sector: Central-bank purchases have become a structural pillar—watch for continuity (or pauses) in monthly updates.
📈 Flows & positioning: ETF creations, futures options open interest, and CTA signals can amplify moves far beyond fundamentals (gamma-squeeze dynamics).
Industrial pulse (silver): PV installations, EV production, grid/storage rollouts, and semiconductor packaging demand. Even with thrifting, sheer volume growth can drive sustained demand. 🔌
________________________________________
🔍 Other High-Octane Catalysts To Watch
🧩 Policy whiplash: tariffs, clean-energy incentives, and regional manufacturing policies can shift where PV growth lands, but global additions remain robust into 2026.
🌍 Geopolitical risk: commodity sanctions, shipping disruptions, and elections tend to feed gold’s safe-haven bid and can intermittently kink PGM supply chains.
⚙️South Africa power stability: any setbacks could crimp platinum supply; under-investment keeps the system fragile even with recent improvements.
________________________________________
🧱 Positioning Blueprint (conceptual, not advice)
🧮 In a $7k gold blue-sky, miners should outrun the metal (margin + duration), silver miners should over-beta gold if the PV/AI/EV demand boom continues, and platinum offers clean metal-beta through PPLT. Platinum miners could add torque but also carry South Africa–specific risks.
⚠️Risks: inflation re-acceleration forcing hikes, a USD surge, ETF liquidation waves, PV-demand disappointments, or supply snap-backs could maul these targets; miners also carry idiosyncratic risks (cost inflation, permitting, geopolitics).
________________________________________
🎯 Targets (2026 “go-for-it” bull case)
• 🎢 GDX: $150–$220 on 2–3× torque to a gold melt-up, plus multiple expansion.
• 🧪 SIL: $95–$130 if silver sprints on deficits + PV/AI/EV demand, with miners over-beta.
• 🧰 PPLT: $250–$375 with sustained platinum deficits and sticky auto substitution.

Gold Bull Markets Long Term Overview and 2025 Market UpdateGold Bull Markets Long Term Overview and 2025 Market Update
________________________________________
• This cycle is different: record central-bank buying + renewed ETF inflows + lower real rates = powerful tailwind.
• Price: Gold notched fresh ATHs this month (up to $3,790.82). 2025 is shaping up as the strongest year since the late 1970s.
• Relative: Gold is crushing equities YTD (≈+40% vs S&P 500 ≈+13% total return).
• Setup: A 13-year “cup-and-handle” breakout in 2024 kick-started the move.
• Outlook: Base case from the Street: $3,700 by end-’25 and ~$4,000 by mid-’26; upside to $4,500 if flows accelerate.
________________________________________
🏆 Historic Gold Bull Markets — Timeline & Stats
1) 1968–1980 “Super Bull”
• Start/End: ~$35 → $850 (Jan 1980)
• Gain: ~2,330%
• Drivers: End of Bretton Woods, oil shocks, double-digit inflation, geopolitical stress.
• Drawdown: ~–45% (1974–1976) before the final blow-off run.
2) 1999–2011/12
• Start/Peak: ~$252 (1999) → ~$1,920 (2011–12)
• Gain: ~650%
• Drivers: Commodities supercycle, EM demand, USD weakness, GFC safe-haven bid.
3) 2016/2018–Present (The “CB-Led” Cycle)
• Start Zone: $1,050–$1,200 → New ATH $3,790 (Sep 2025)
• Gain: ~215–260% (depending on 2016 vs 2018 anchor)
• Drivers: Record central-bank accumulation, sticky inflation/low real rates, geopolitics; 2024 13-yr base breakout.
________________________________________
📊 At-A-Glance Comparison (Updated 2025)
Metric 1968–80 Super Bull 1999–2012 2016/18–2025 Current
🚀 Total Gain ~2,330% ~650% ~215–260% (so far)
⏲️ Duration 12 yrs 13 yrs 7–9 yrs (ongoing)
💔 Max Drawdown ~–45% (’74–’76) ~–30% (’08) ~–20% (2022)
🏦 Main Buyer Retail/Europe Funds/EM Central Banks (dominant)
🏛️ Pattern Secular parabolic Cyclical ramps 13-yr base → breakout (’24)
Notes: current cycle characteristics validated by WGC demand trends & technical breakout in Mar 2024.
________________________________________
📈 Top 10 Stats of the Current Bull (2025)
1. Price & ATHs: Spot $3,75–$3,79k; fresh ATH $3,790.82 on Sep 23, 2025.
2. 2025 YTD: Roughly +40–43% YTD (best since the late ’70s).
3. Central Banks: 1,045 t added in 2024 (3rd straight 1k+ year). H1’25 ≈ 415 t (still elevated).
4. ETF Flows: Strongest half-year inflows since 2020, aiding the surge.
5. Gold vs Equities: Gold ≈+40% vs S&P 500 ≈+13% total return YTD.
6. Jewelry Demand: Price strength is crimping tonnage (2024 down ~11%; Q2’25 –14% y/y), even as value hits records.
7. Gold–Silver Ratio: Now around ~85–88 (silver catching up as it pushes $43–$44).
8. Macro Link: Strong safe-haven bid + rate-cut hopes supporting new highs.
9. Technical: Confirmed cup-and-handle breakout (Mar ’24) underpinning trend.
10. Street Forecasts: DB lifts 2026 to $4,000; GS baseline $4,000 by mid-’26, upside $4,500 with bigger private-investor rotation.
________________________________________
🔄 What Makes This Bull Different (2025 Edition)
• 🏦 Central-Bank Dominance — Official sector is the anchor buyer (3rd straight 1k+ tonne year in 2024; 2025 tracking strong despite Q2 deceleration).
• ⚡ Faster Recoveries — Pullbacks have been shallower and shorter vs the 1970s analog.
• 📈 Coexisting With Risk Assets — Rare combo: gold ATHs with equities up YTD suggests a macro hedge bid alongside optimism in select risk assets.
• 📐 Structural Breakout — The 13-year base cleared in 2024 set multi-year targets.
________________________________________
🎯 Strategy Ideas (2025 & Beyond)
Core
• Buy/Hold on Dips: Stagger entries (DCA) into physical (allocated), ETFs (e.g., GLD/IAU), and quality miners/royalties.
• Prefer Physical/Allocated where counterparty risk matters; use ETFs for liquidity.
Satellite/Leverage
• Silver & GSR Mean-Reversion: With the GSR ~85–88, silver historically offers torque in up-legs. Pair with high-quality silver miners.
• Factor Tilt in Miners: Focus on low AISC, strong balance sheets, growing reserves, and jurisdictions with rule-of-law.
Risk-Management
• Define max drawdown tolerance per sleeve; pre-plan trims near parabolic extensions or if macro invalidates (e.g., real-yield spike).
________________________________________
🧪 Reality Check: What Could Invalidate the Bull?
• Real yields + USD rip higher (sustained), dampening non-yielding assets.
• Sharp halt in official-sector buying (e.g., policy shifts).
• Rapid growth re-acceleration reducing safe-haven & rate-cut expectations.
________________________________________
🧭 Quick Reference Tables
🧾 Summary: Historic vs Current
Feature 1968–80 1999–2012 2016/18–2025
Total Gain ~2,330% ~650% ~215–260%
Duration 12 yrs 13 yrs 7–9 yrs (ongoing)
Correction ~–45% ~–30% ~–20% (’22)
Main Buyer Retail/Europe Funds/EM Central Banks
Pattern Parabolic Cyclical Cup & Handle → Secular
🧩 “If-This-Then-That” Playbook
• If real yields fall & CB buying persists → Ride trend / add on consolidations.
• If USD + real yields jump → Trim beta, keep core hedge.
• If GSR stays >80 with silver momentum → Overweight silver sleeve for torque.
________________________________________
🧠 Outside-the-Box Adds
💼 Role in a Portfolio (example frameworks)
• Resilience sleeve (5–10%): Physical + broad ETF.
• Offense sleeve (2–5%): Quality miners/royalties; optional silver tilt.
• Tactical (0–3%): Trend-following overlay (breakouts/consolidations).
🧭 Decision Checkpoints (quarterly)
• Central-bank net purchases (WGC).
• ETF flows (Western markets).
• Real yields (10y TIPS), USD trend, and GSR.
________________________________________
🔚 Key Takeaways (Updated)
• Relentless official-sector demand + technical breakout are the twin pillars of this cycle.
• Macro mix (policy easing expectations, geopolitics, diversification from USD reserves) supports an extended run.
• Base case: Street sees $3.7k by end-’25 and ~$4k by mid-’26, with upside to $4.5k if private capital rotation accelerates. Manage risk; embrace volatility.

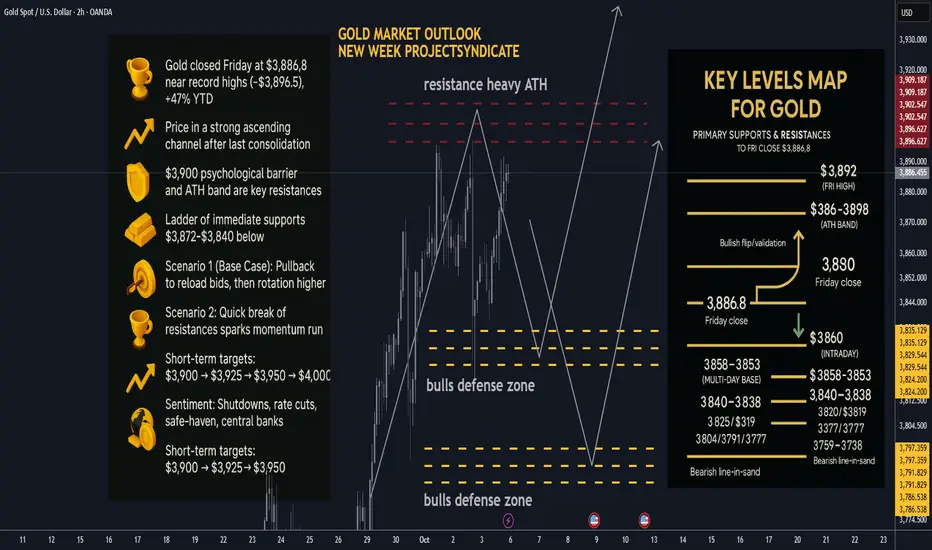
Gold next week: Key S/R Levels and Outlook for Traders🏆 Friday’s Close & Recent ATH:
Gold (XAUUSD) closed Friday at $3,886.8, after printing a session high near $3,891.9. The latest all-time high is ~$3,896.5 (Thu), putting $3,900 squarely in play as the next psychological milestone. YTD performance remains extraordinary (≈+47% in 2025).
📈 Trend Structure:
Price continues to track a well-defined ascending channel on 1H/4H with a clean impulsive leg out of the last consolidation. Market character = higher highs / higher lows, persistent dip-buying, and strong trend adherence into quarter-turn levels (25/50 handles).
🔑 Key Resistance Levels:
The most critical resistance now sits at $3,900 (psychological + round-number supply). Beyond that, watch the ATH band $3,896–$3,898 and Friday’s spike high $3,892. Break/acceptance above opens $3,925–$3,950 as measured-move extensions, with $4,000 as a probable magnet on momentum follow-through.
🛡️ Support Zones:
Immediate supports step down as follows: $3,872–$3,860 (intraday pivot), $3,858–$3,853 (multi-day base), $3,840–$3,838 (Fri low). Deeper structural shelves: $3,825–$3,820, $3,804, $3,791, $3,777. A sustained break below $3,838–$3,825 would signal a more meaningful corrective phase.
⚖️ Likely Scenarios:
• Scenario 1 (Base Case) – Pullback then push: Controlled dip into $3,858–$3,838 to reload bids, then rotation higher toward $3,900+.
• Scenario 2 – Straight break: Quick clearance of $3,892/ATH $3,896–$3,898 → $3,900, unleashing a momentum run into $3,925–$3,950.
(Overbought signals persist, but structural demand keeps dips shallow.)
📊 Short-Term Targets:
On continuation: $3,892 → $3,900 → $3,925 → $3,950, with $4,000 as stretch if acceptance holds above $3,900. On retrace: $3,858 → $3,840 → $3,825.
💡 Market Sentiment Drivers:
• Shutdown-driven data delays & uncertainty are boosting safe-haven bids; Friday’s NFP was delayed, reinforcing cut expectations.
• Rate-cut odds remain elevated into October, keeping the opportunity cost of holding gold low (FedWatch/BofA commentary).
• Official-sector demand stays constructive (central banks resumed net +15t buying in August per WGC), underpinning dips.
• Macro/geopolitical risk + tariff chatter continue to provide a tailwind; 2025’s ~47% surge underscores the regime shift.
🔄 Retracement Outlook:
A tag of $3,858–$3,853 (multi-day pivot) or a stop-run to $3,840–$3,838 is a typical “healthy” pullback zone inside trend. Swift reclaim of $3,858/53 after a liquidity flush often precedes fresh ATHs.
🧭 Risk Levels to Watch:
Holding above $3,858–$3,838 keeps the bullish structure intact. Failure/acceptance below $3,825 shifts risk toward $3,804 → $3,791 → $3,777 and opens the door to $3,759–$3,738.
🚀 Overall Weekly Outlook:
Gold remains in a power-trend with $3,892/ATH $3,896–$3,898 → $3,900 as the immediate battleground. Expect orderly, buyable dips while those supports hold; topside roadmap favors $3,925–$3,950 with $4,000 viable on a decisive breakout/acceptance.
________________________________________
🗺️ Key Gold Levels Map — Primary Supports & Resistances (Updated to Fri Close $3,886.8):
Primary Resistances: 3892 (Fri high) → 3896–3898 (ATH band) → 3900 → 3925 → 3950 → 4000.
Primary Supports: 3872–3860 (intraday) → 3858–3853 (multi-day base) → 3840–3838 (Fri low) → 3825 / 3819 → 3804 / 3791 / 3777 → 3759–3738 (deeper control).
Bullish flip/validation: Sustained acceptance ≥3900 turns dips into buys toward 3925–3950.
Bearish line-in-sand: Daily close <3825 weakens the trend; <3791 confirms a broader corrective swing.
XAUUSD H2 XABCD SHORT/LONG sequence with price targets🔸Hello traders, let’s review the 2-hour chart for GOLD (XAUUSD). Price action has been volatile, but the market continues to respect harmonic levels. We are tracking a clean XABCD harmonic structure, offering both higher-risk and lower-risk opportunities depending on your trading style.
🔸Speculative XABCD structure defined by the following pivots:
X = 3625 A = 3689 B = 3639 C = 3709 D/PRZ = 3603
This setup still pending PRZ/D point, giving us potential reversal scenarios.
Advanced short entry is from C at 3709 with target exit at D/PRZ 3603 – higher-risk setup still pending
🔸Trade Analysis and overview:
Advanced short is still available from point C at 3709 with exit target at PRZ/D 3603. This is a higher-risk play, still pending
Now we shift focus to the lower-risk reversal setup: buying near the D/PRZ level at 3603. Harmonic patterns often suggest strong bounce potential from the PRZ, making this a solid buy/hold opportunity.
🔸Strategy & Targets:
BUY/HOLD from PRZ/D = 3603
TP1 = 3700 (first profit zone / re-test of structure)
TP2 = 3750 (extended target into higher resistance)
Manage risk with proper SL placement beneath PRZ.
🔸Key Notes:
Pattern suggests a bullish reversal from current zone.
Traders should remain patient as volatility around PRZ is common.
This is a swing trade setup, so allow time for structure to develop toward TP levels.
🎁If you find this analysis useful:
Hit the like button to show support 🙌
Drop a comment and let us know your view on GOLD!

Gold Deep Dive: Cycles, Correlations, Divergences, SymmetryGold has been in a raging bull market and almost up over 100% since its monthly bullish engulfing candle.
Gold sniffing out week monetary policy and rallying on the back of easing global monetary policy.
Historically from a trading standpoint, Gold is extremely overbought and could be 4-8 weeks away from a considerable pullback of 15-30% .
Many Signals such as symmetrical moves, Monthly overbought RSI, Copper / Gold Divergence, GDX resistance is telling us to use caution and trim long profits.
It does seem like gold wants $3500 before it has a reversal back down. We are looking for a liquidity sweep of the ATH as a possible short zone. (Not FA advice)
Once gold resets some indicators and allows longer term moving average to catch up it will likely keep pushing but we only for see that in mid to late 2026.
If we make a new high....we don't see much upside for the next 3-6 months.

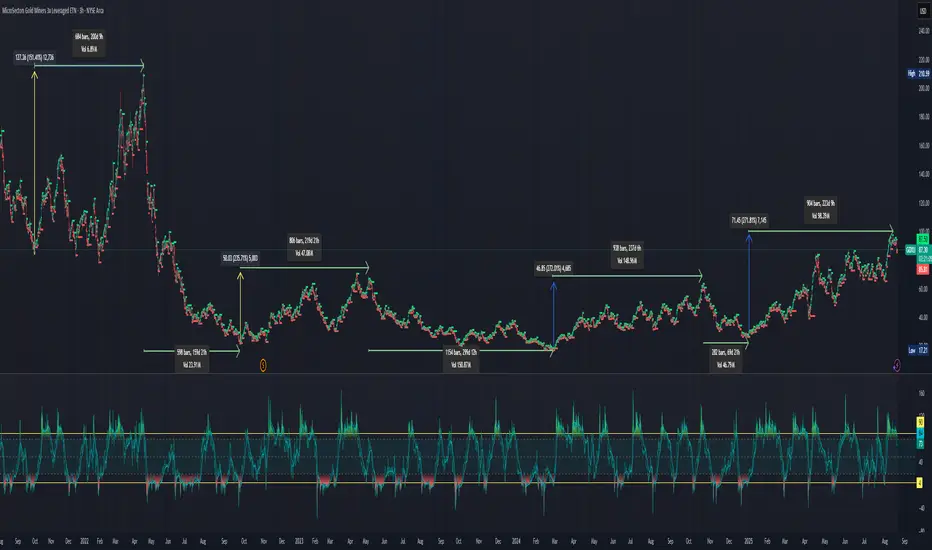
SHORT: Short term GDXU 2X pull back, is it now time to go GDXDI've laid out the major run ups and pull backs. The last 3 run ups have lasted 219 - 237 days. If the last peak was put in by GDXU it would put it at 225 days. I'm looking at this as a potential repeating pattern. Note the GDXU run ups based on a % gain from the bottom, assuming, the most recent peak was the final high in this run up. The run ups were +241%, +270%, and +279%. The run up also reasonable for the peak.
Big question, what about the draw downs. The last 2 have been -54%, -42%, and-60%. In GDXD, the inverse gold miners ETF 2X levered resulted in a gain of +90%, +58%, and +95%. The run up on the inverse side lasted 53, 20, and 22 days. GDXD is currently up +13% in the last 7 days.
Take aways, reduce/eliminate position in long GDXU and wait for a better buy in position and potential upside in the inverse gold miners etf.
Gold Miners Stocks Go 'The Rife Game' in Town. Here's WhyGold mining stocks have emerged as one of the top-performing asset classes in 2025, driven by a combination of surging gold prices, improved profitability, and shifting investor sentiment.
Here’s fundamental and technical analysis of the key factors behind this outperformance, by our @PandorraResearch Super-Duper Beloved Team :
Record-High Gold Prices Fuel Margins
Gold prices surpassed $3,000 per ounce in March 2025 for the first time in history, marking a 14% year-to-date increase. This rally stems from:
Safe-haven demand amid geopolitical tensions, economic and political uncertainty including U.S. trade policy volatility.
Central bank buying , particularly by China, India, Turkey, and Poland, to diversify away from the U.S. dollar.
Anticipated interest rate cuts , which reduce the opportunity cost of holding non-yielding assets like gold.
Higher gold prices directly boost miners’ revenues.
For example, the NYSE Arca Gold Miners Index NYSE:GDM returned nearly 30% YTD by early March, outpacing both physical gold OANDA:XAUUSD (+14.5%) and the S&P 500 SP:SPX (-3.8%). Companies like Agnico Eagle Mines NYSE:AEM and Wheaton Precious Metals NYSE:WPM reached all-time highs, while ASX-listed miners such as Evolution Mining ASX:EVN (+39.5% YTD) and West African Resources ASX:WAF (+56.6% YTD) outperformed Australia’s broader market.
Margin Expansion and Shareholder Returns
Gold miners are leveraging rising prices to improve profitability:
Stabilized costs for labor, energy, and equipment have widened profit margins.
Free cash flow growth enabled dividend hikes and share buybacks. U.S. Global Investors, for instance, offers a 3.91% annualized dividend yield.
Undervalued stocks: Many miners traded at historically low valuations relative to gold prices, creating buying opportunities. Barrick Gold NYSE:GOLD (P/E 15.6) and Newmont Corp NYSE:NEM (P/E 15.5) remained attractively priced despite gains.
Royal Gold NASDAQ:RGLD , a streaming company with a 60.3% operating margin, exemplifies how non-traditional miners capitalize on gold’s rally without direct operational risks.
Sector-Specific Catalysts
Mergers and acquisitions. Consolidation activity has increased, with larger firms acquiring high-potential projects.
Copper exposure. Miners like Evolution Mining benefit from rising copper demand, diversifying revenue streams.
Institutional upgrades. Analysts at Macquarie and Morgan Stanley endorsed Newmont and Evolution Mining, citing currency tailwinds and free cash flow potential.
Macroeconomic and Market Dynamics
Dollar weakness. A declining U.S. dollar enhances gold’s appeal as a hedge.
Equity market volatility. With the S&P 500 struggling, investors rotated into gold equities for diversification (0.3 correlation to broader markets).
Fiscal deficits. U.S. budget imbalances and inflationary pressures reinforced gold’s role as a store of value.
Outlook for 2025
Analysts project further gains, with gold potentially reaching $3,300 per ounce. Miners are expected to sustain momentum through:
Operational efficiency improvements to align with higher gold prices.
Continued capital discipline , avoiding overinvestment in new projects.
Dividend growth , as seen with U.S. Global Investors’ monthly payouts.
Technical Outlook
The main technical graph for Gold Miners ETF AMEX:GDX indicates on further Long-Term Bullish opportunity, to double the price over next several years, in a case of the epic $45 mark breakthrough.
Conclusion
In summary, gold miners’ 2025 rally reflects a confluence of macroeconomic uncertainty, disciplined capital management, and gold’s structural demand drivers. While risks like cost inflation persist, the sector’s fundamentals and valuation upside position it as a compelling component of diversified portfolios.
--
Best 'Golden Rife' wishes,
@PandorraResearch Team 😎

Wheaton precious Metals can push on to $90It could be a HOT summer for the gold and silver bugs
And the speculators in the mining sector!
WPM ( formerly Silver Wheaton #SLW)
Has a broken out of a inverse head and shoulders
Two targets provided
Also important to note this inv head and shoulders is a continuation pattern not a bottom pattern.

Gold Market Update: Bears will target 3150 USD🏆 Gold Market Mid-Term Update
📉 Gold Drops: Prices dip as risk appetite grows and profit-taking kicks in.
🤝 U.S.-China Deal: 90-day tariff pause boosts USD, pressures gold.
📊 Tech Watch: Key support levels eyed by traders for entry points.
🔮 EUROTLX:4K Forecast?: Analysts still see path to $4,000 amid uncertainty.
⚠️ Recession Signal: Oil-gold gap hints at slowdown—bullish for gold.
🏠 Investment Shift: Gold now 2nd-best long-term U.S. investment (after real estate).
🌍 BRICS Buying: Emerging nations hoard gold to ditch dollar.
🛡️ $3,200 Holds: Gold maintains key support despite volatility.
📈 JP Morgan Bullish: EUROTLX:4K gold possible even with growth.
💰 Live Price: Gold at $3,253.40 (+0.52%) today.
📊 Technical Outlook Update
🏆 Bull Market Overview
▪️pullback in progress still
▪️3300 USD cleared by the BEARS
▪️market gapped down at open
▪️3300 is heavy resistance for now
▪️Compression on lower timeframes
▪️Flag on Flag Bearish pattern
▪️short-term expecting more losses
⭐️Recommended strategy
▪️Short Sell Rips/Rallies
▪️TP Bears 3150 USD

Unpopular opinion, but I think it's time to short GoldThis melt-up is approaching resistance, and the symmetry on the chart is compelling. It could set up a great short opportunity as gold consolidates ahead of its next major move higher, likely in 2027.
However, if it breaks out of the current channel, we could be entering a true melt-up phase — and there's potential for significantly higher prices.

Silver Massive C&H Bull Market 400%+ gains Lifetime opportunity🏆 Silver Market Update (April 13th, 2025)
📊 Technical Outlook Update
▪️Long-term outlook 2weeks/candle
▪️Massive C&H formation in progress
▪️40 USD breakout pending now
▪️PT BULLS 400%+ gains BUY/HOLD
▪️Price Target BULLS 125/150 USD
▪️Bull market still pending
▪️BUY/HOLD now or miss out on gains
📢 Silver Market Update – April 2025
📈Silver is widely used in electronics due to its exceptional electrical and thermal conductivity, making it ideal for various applications, including printed circuit boards, connectors, and contact surfaces.
🚀 It is also employed in devices like touch screens, batteries, and solar panels. Silver's high conductivity, solderability, and resistance to corrosion and oxidation contribute to its popularity in the electronics industry.

GDX Gold miner ETF looking promising right now GDX Gold miner ETF looking promising right now
Similar to other precious metal price action right now

Elliott Wave View: Gold Miners ETF (GDX) Impulse Rally ProgressShort Term Elliott Wave View in Gold Miners ETF (GDX) suggests rally from 12.30.2024 low is in progress as an impulse. Up from 12.30.2024 low, wave 1 ended at 38.2 and dips in wave 2 ended at 36.84. Internal subdivision of wave 2 unfolded as a zigzag Elliott Wave structure. Down from wave 1, wave ((a)) ended at 37.31 and wave ((b)) ended at 37.95. Wave ((c)) lower ended at 36.83 which completed wave 2 in higher degree.
The ETF has extended higher in wave 3 with subdivision as a 5 waves with extension (a nesting impulse). Up from wave 2, wave ((i)) ended at 38.16 and pullback in wave ((ii)) ended at 36.84. The ETF extended higher in wave (i) towards 39.73 and pullback in wave (ii) ended at 38.14. Up from there, wave i ended at 39.92 and wave ii ended at 39.24. Wave iii higher ended at 41.53 and pullback in wave iv ended at 40.80. Expect the ETF to end wave v of (iii), then it should pullback in wave (iv) before higher again. Near term, pullback should find support in 3, 7, or 11 swing against 36.83 low for further upside.

Opening (IRA): GDX Dec 20th 36 Covered Call... for a 35.29 debit.
Comments: Selling the -75 delta call against stock to emulate the delta metrics of a 25 delta short put, but with the built-in defense of the short call.
Metrics:
Buying Power Effect/Break Even: 35.29/share
Max Profit: .71
ROC at Max: 2.01%
50% Max: .36
ROC at 50% Max: 1.00%
That 1.00% ROC at 50% max is kind of "marginal," but just trying to keep theta on and burning with little stuff that I can add to should I have the opportunity to get in in higher IV/weakness.

XAUUSD - Mining in China Vs GoldGold is below the EMA200 and EMA50 in the 4-hour timeframe and is moving in its Neroli channel. If the upward movement continues, we can see the limited supply and sell within that range with the appropriate risk reward. The continuation of the gold neroli movement will provide us with the next opportunity to buy it.
Chinese officials have announced the discovery of a huge deposit of high-quality gold ore, estimated to be worth around $83 billion, and may be the largest known deposit of the precious metal in the world.
Chinese scientists have discovered a "supergiant" deposit of high-quality gold ore near some of the country's existing gold mines. This massive deposit, which could be the largest single reservoir of this precious metal remaining anywhere on Earth, is worth billions of dollars.
Representatives of the Geological Bureau of Hunan Province (GBHP) told Chinese state media on November 20 that the new deposits were discovered in the Wangu gold field in northeastern Hunan province. Workers identified more than 40 gold veins containing about 330 tons of gold down to a depth of 6,600 feet (2,000 meters). However, using 3D computer models, mining experts have predicted that as much as 1,100 tons of gold – roughly eight times the weight of the Statue of Liberty – may be hidden as deep as 9,800 feet (3,000 meters). If true, the total reserves are likely to be worth about 600 billion yuan ($83 billion).
Mark Chandler, referring to the poor performance of gold after the recent drop, said: "The price of gold has not yet recovered even half of its decline and remains below the level of $2,663.40. If the U.S. employment report at the end of next week is stronger than expected (with around 200,000 new jobs forecast), speculation about a Fed rate cut in December is likely to ease. This can help strengthen the dollar and interest rates. However, US policies that threaten to derail the international order have encouraged some foreign central banks to continue hoarding more gold.
Employment data will be the centerpiece of the economic calendar next week and is expected to have a significant impact on the direction of markets. This set of reports includes JOLTS job openings on Tuesday, the ADP employment report on Wednesday, weekly jobless claims on Thursday, and the key nonfarm payrolls (NFP) report on Friday. Each of these reports can provide clues about the state of the labor market and the Federal Reserve's future decisions.
Along with these employment data, ISM purchasing managers' indicators are also in the focus of traders' attention. The index of the production sector is published on Monday and the index of the service sector is published on Wednesday. Additionally, the University of Michigan's preliminary consumer confidence index, an important measure of economic sentiment and consumer purchasing power, will be released on Friday.
Wednesday will be a key opportunity for markets to hear comments from Federal Reserve Chairman Jerome Powell ahead of the Federal Reserve's media silence. Powell is scheduled to participate in a moderated conversation at the New York Times DealBook, an event that is likely to provide clues about the Fed's future policy.

Opening (IRA): GDX January 17th 34 Covered Call... for a 33.28 debit.
Comments: Selling the -75 delta call against stock to emulate the delta metrics of a 25 delta short put, but with the built-in defense of the short call. Adding at strikes/break evens better than what I currently have on. This puppy also happens to have a dividend on offer in December, but is quite variant: www.nasdaq.com
Metrics:
Buying Power Effect/Break Even: 33.28
Max Profit: .72
ROC at Max: 2.16%
50% Max: .36
ROC at 50% Max: 1.08%
