GDX/GOLD Ratio Uptrend Still in TactWhen the GDX/Gold ratio rises, the Gold Miners rise more relative to Gold. Seeing this ratio rise is good to confirm a gold bull market. Gold miners should do well in the coming years.
GDX

THE WEEK AHEAD: AMD, TWTR, FB EARNINGS; SLV, GDX, GDXJ; EWWEARNINGS:
There are a ton of earnings coming out next week, with the most options liquid plays to be had in AMD (44/71), TWTR (77/80), and FB (59/50).
Pictured here is a delta neutral short strangle in AMD in the June cycle (54 days). Camped out around the 20 delta strikes, it paid 3.12 as of Friday close (5.6% as a function of share price) with break evens at 42.88/73.12. Go defined risk with a five-wide iron condor in the same cycle -- the 42/47/70/75, and you'll get paid 1.48, 29.6% return on capital at max, 14.8% at 50%.
A TWTR June 19th 24/36 short strangle paid 1.83 (6.4% as a function of share price) as of the Friday close; the FB June 19th 165/220, 7.07 (3.7% as a function of share price). Consequently, if you're looking for "buck bang" as a function of share price, your best best is going with the TWTR play, with its higher 30-day.
EXCHANGE-TRADED FUNDS WITH 30-DAY >35% ORDERED BY RANK:
SLV (83/51)
GDXJ (72/79)
GDX (64/63)
EWW (61/60)
XLU (60/40)
EWZ (57/72)
XLE (55/66)
SMH (46/46)
XOP (42/81)
USO (33/192)
USO is going to be undergoing a 1:8 reverse split after the close of markets on April 28th, so you may want to steer clear of entering an options play before then and/or close out any options plays you've got on here to avoid being stuck with nonstandards post-split. As if it wasn't apparent, the juice is in precious metals/miners (SLV, GDX/GDXJ) and oil-related exchange-traded funds (XOP, XLE, USO), with some secondary squeezings to be had out of Mexico (EWW), Brazil (EWZ), and semicons (SMH).
With respect to EWW and EWZ, I considered each for a potential IRA trade, since both pay dividends, although they're only twice a year and somewhat "uneven." (EWW yield shows as 4.93%; EWZ as 5.44%). The EWW June 19th 22 was paying .78 as of Friday close (3.7% return on capital at max), the EWZ June 19th 18, .96 (5.6% return on capital at max), so may consider doing one or the other as a potential aquisitional play.
BROAD MARKET EXCHANGE-TRADED FUNDS WITH 30-DAY >35% ORDERED BY RANK:
TQQQ (60/111)
IWM (56/45)
EEM (46/39)
QQQ (43/36)
SPY (39/35)
FUTURES WITH 30-DAY >35% ORDERED BY RANK:
/NG (98/95)
/SI (83/500
/RTY (56/55
/NQ (43/36)
/ZC (43/36)
/ES (39/36)
/CL (33/948)
VIX/VIX DERIVATIVES:
VIX finished the week at 35.93, well in "high volatility" territory. However, the May and June contracts (36.95 and 35.70, respectively), finished in contango (it's been a while), with the rest of the term structure in backwardation.

$GDX may find some resistance short term$GDX testing UTL resistance along with a few other miners. Confirmation with break of LTL.


Trade Journal: Long $NUGT - 4/22/2020Gold has been consolidating right above the recent highs, since bottoming out last month, and looks prime for a breakout. I went long this morning right at the open on the gap up. Really like this pattern occurring in GOLD which could pick up some momentum near term. GDX is also a valid play for less risk.
Entry - 12.10
Stop loss - 10.90
Target - 14/17.50

GDX Breaks out from a 7 Year ResistanceGDX breaks out from a 7 year Resistance and looks to head higher to 55 in the next year. Fueled by rising gold prices and low oil prices.

Elliott Wave View: GDX Extends Higher to 7 Year HighElliott Wave view in Gold Miners ETF (GDX) suggests the rally from March 16, 2020 low is unfolding as a 5 waves impulsive structure. Up from March 16 low, wave (1) ended at 27.21 and pullback in wave (2) ended at 23. The ETF then extends higher in wave (3) towards 32.27 and wave (4) pullback ended at 29.37. The 45 minutes chart below shows the internal of wave (3) which unfolded as another impulse of lesser degree.
Wave (4) correction ended as a triangle. Wave A ended at 29.37, wave B at 31.12, wave C at 29.45, wave D at 31.13, and wave E of (4) ended at 29.45. The instrument then extends higher again in wave (5) with potential to end at 32.61 – 33.87 (blue box). This move will also complete wave ((1)) and thus ends cycle from March 16, 2020 low. Afterwards, the instrument can see larger pullback within wave ((2)) to correct cycle from March 16, 2020 low in 3, 7, or 11 swing before turning higher again.
We don’t like selling the instrument and GDX can always extend higher as the structure is in 5 waves. Furthermore, the sequence from January 2016 low appears incomplete with 100% – 123.6% Fibonacci target towards 36 – 40.6.

Gold miners ETF 30min chartconsolidating nicely, breaking out of one wedge, and now holding strong. a break of 31 should give way for a quick move to 32 retesting the multiyear resistance above. $GDX $NUGT $GLD

THE WEEK AHEAD: SNAP, NFLX, IBM EARNINGS; /ZC, /CLEARNINGS:
IBM (63/54) announces Monday after market close.
SNAP (92/102) announces Tuesday after market close.
NFLX (66/70) announces Tuesday after market close.
EXCHANGE-TRADED FUNDS ORDERED BY IMPLIED VOLATILITY RANK/PERCENTILE SCREENED FOR RANK >50/IMPLIED >35%:
XLU (77/47)
GDXJ (77/84)
GDX (67/65)
SLV (66/45)
TQQQ (63/111)
USO (62/112)
XLE (59/70)
EWW (58/54)
EWZ (53/69)
XOP (59/91)
BROAD MARKET EXCHANGE-TRADED FUNDS ORDERED BY IMPLIED VOLATILITY RANK/PERCENTILE:
IWM (72/54)
QQQ (47/38)
SPY (45/28)
EFA (44/31)
EEM (41/36)
FUTURES ORDERED BY IMPLIED VOLATILITY RANK/PERCENTILE:
/ES (44/40)
/NQ (47/39)
/YM (51/13)
/RTY 72/53
/CL (62/130)
/NG (94/71)
/GC (67/27)
/SI (66/43)
/ZC (57/28)
/ZS (33/17)
/ZW (27/31)
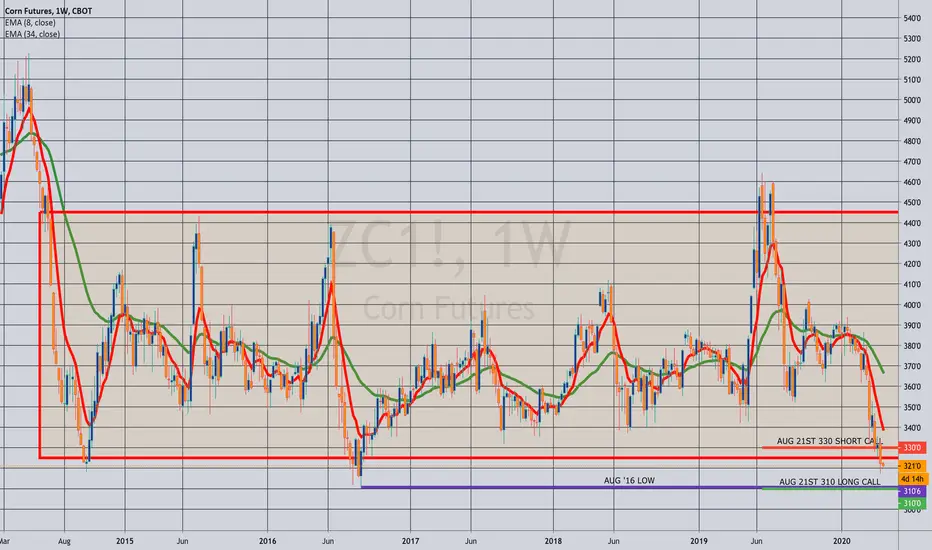
Notes: Pictured here is a /ZC August 21st 310/330 long call vertical, currently trading at 11.25 with a break even at 321.25 versus 321 spot. Ideally, you'd want to put this on with at least make one/risk one metrics, which would occur if the spread priced out at 10.00 even or below. /ZC is tantalizingly close to those August 2016 lows at 310 '06 ... .
Another future worth mentioning here: /CL. As I write this post, the May contract is currently trading at multi-year lows at 15.09, with the June contract trading at 23.66. May drops off this week with the question being how low the June contract will go. I continue to look to sell puts on weakness in the active contract at or below $20.
VIX/VIX DERIVATIVES:
VIX finished the week at 38.15 with the /VX term structure in backwardation.
Gold (AUD) Daily chart- Ascendening Broadening Wedge. Gold (AUD) Daily chart- Ascendening Broadening Wedge.


$GLD is in a 1.5YR Bull TrendIt's a pretty well defined channel so is this the start of a larger, longer run? I recommending googling "trump gold fed".

$GOLD Textbook Nike Swoosh Pattern Forming$GOLD Textbook Nike Swoosh Pattern Forming
$GLD $GDX $XAUUSD

Gold TradeLet's remember John Murphy's intermarket wisdom, we'd like to see the dollar weaken if a new bull market in Gold is to occur.

GDX bearish volume divergence + critical support levelskinda bearish for the short term super bullish mid/long term for gold and gold mining stocks GDX

Gold Testing $1,800 While the stock market isn’t seeing the strong bounce that the Federal Reserve was trying to manifest via trillions of freshly printed dollars thrown at the bond and credit markets, gold is loving the massive increase in the money supply. Price is currently testing highs not seen since October 2012 near $1,800 which is where the current resistance level rests. I’ve been expecting a re-test of the all-time high of $1,923 by the end of the year, but at this pace we may see it within the next month or two.
After finding recent support at the 61.8% Fibonacci level which indicated uptrend continuation, price has now pushed above the 78.6% Fib level which is the most bullish of the Fib levels for price to be trading above. As long as price remains above the 78.6% level the trend can be expected to continue upward. Any pullback that holds above the 61.8% Fib level can be viewed as a bullish pullback and a buy opportunity.
The Relative Strength Index(RSI) shows the green RSI line at the 75 level which indicates strong momentum behind price. Above 50 is bullish, above 60 indicates strong bull momentum. The purple signal line is also above 50 and rising which indicates that the intermediate momentum trend is bullish along with the short-term RSI momentum trend.
The Price Percent Oscillator(PPO) shows the green PPO line rising above the purple signal line, with both lines above the 0 level. This indicates that overall momentum behind price is bullish. As long as the green PPO line is above the purple signal line the short-term momentum will remain bullish.
The overall view on gold remains bullish with the expectation of a new all-time high above $2,000 being made this year.

Gold corrective leg down?$gdx $gdxj $nugt $jnug $jdst $dust $slv $gld I'm bullish on hard assets- watching for possible leg down. A higher high will invalidate this.

GOLD mixed price action between GLD and Gold minersWeird price action for GLD last thursday, as gold futures were up 2% and GLD was only up 2.6%. While senior gold miners index were up 10%, such as NUGT or NEM exploded for 13%. Possible bearish triple top or bullish Inverse Head and shoulders? April 7 COT report was mixed as well, Non-Commmercials were Long, while Commercials were short. FOMC is not for 3 weeks, maybe pull back to FIB .236 ($153.69) Happy Trading!

$GOLD HIGHEST DAILY+WEEKLY CLOSE SINCE JAN 2013!! $GLD $GDX$GOLD HIGHEST DAILY+WEEKLY CLOSE SINCE JAN 2013!!
$GLD $GDX $XAUUSD


GOLD (XAUUSD) preparing for MAJOR SELLOFF before true breakout!!Cycles analysis indicates one more major deflationary move to occur. A selloff approaching for XAUUSD down to support levels near 1380, as well as a retest lower for gold miners. To be followed by a longer term major buy setup for gold. Let's remain objective and not get too excited just yet!!
