Long GLD With rising inflation and politicals risk all around the world, Gold continues to perform as a safe haven for assets. From the TA perspective, Gold has formed a double bottom and it is breaking out late march level ($1957ish). It is aiming for a 0.61 Fib level around $2000, possibly all-time high,
GDX

Gold will hit $2500 around the end of 2022After completing the arc pattern, I would expect gold to hit $2500/oz by late 2022. The rise will match the depth of the downturn we have seen in the arc.

GDX In the last week, GDX erased the bullishness of the preceding month with one fell swoop of an Bearish Engulfing kind (weekly chart).
So expecting continued bearish candles would be expected as it follows through.
The daily chart supports that view so far, and it just broke down of the 55EMA, after a gap down. The good thing is that it did not really gap and run... at least not yet.
Technicals are overall bearish, at least for a bit. Expecting bounces off 36, maybe even 35.

GDX offering a BUY ENTRYAMEX:GDX
All Suggestions Requests and Remarks are Welcome
Enthusiastically Brought to You by ManhattanStocks

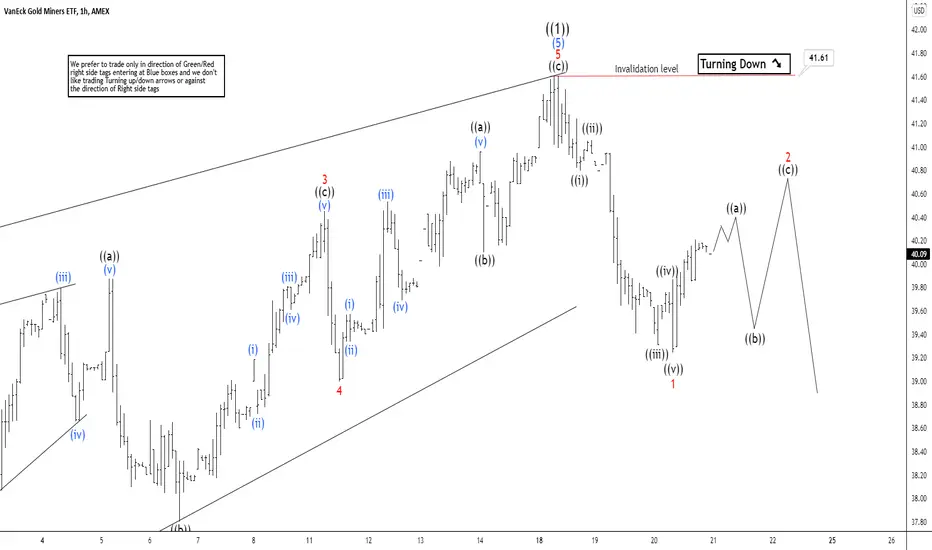
Elliott Wave View: GDX Pullback In ProgressShort term Elliott Wave view in GDX suggests cycle from October 2021 low ended in wave ((1)) at 41.61 as an impulse Elliott Wave structure. Pullback in wave ((2)) is currently in progress with internal subdivision as a zigzag (A)-(B)-(C). The ETF is currently within wave (A) of ((2)) with internal subdivision as a 5 waves. Down from wave ((1)), wave ((i)) ended at 40.8 and rally in wave ((ii)) ended at 41.06. The ETF then extends lower in wave ((iii)) towards 39.31, rally in wave ((iv)) ended at 39.87. Final leg lower wave ((v)) ended at 39.25 which completed wave 1 of (A) in higher degree.
Wave 2 bounce is now in progress to correct the decline from April 18 peak before the ETF resumes lower. Internal subdivision of wave 2 is unfolding as a zigzag structure where wave ((a)) of 2 is expected to end soon. GDX should then pullback in wave ((b)) before another leg higher to end wave ((c)) of 2. Afterwards, it should resume lower in wave 3 to continue the correction to the cycle from October 2021 low. Near term, as far as pivot at 41.61 high remains intact, expect rally to fail in the sequence of 3, 7, or 11 swing for further downside.
Try to run. Try to hide. Break on through to the other side.15-Year Resistance at play. GDX grinds through a battlefield of long term resistance in the $38 to $42 range. Once broken next big resistance @ $54.

GDX continues rallyingTwo weeks ago, a break above 40 was expected , and it just closed the week above 40, in good fashion if I may say so.
The weekly GDX chart followed the previous week's long tailed doji and gapped up, ending near the week's high, with yet another lower tail. Bullish candlestick structure here. Technical RPM indicator is supportive of the momentum, although the MACD expects more.
The daily GDX chart is consistent with a continuing uptrend rally, with higher highs and higher lows. Technically supportive, both the RPM and MACD are crossed up and trending bullishly.
47.50 upside target in sight as projected previously.

4/10/22 GDXVanEck Gold Miners ETF ( AMEX:GDX )
Sector: Miscellaneous (Investment Trusts/Mutual Funds)
Market Capitalization: $ --
Current Price: $39.67
Breakout price: $39.80
Buy Zone (Top/Bottom Range): $38.70-$36.40
Price Target: $44.90-$45.80 (2nd)
Estimated Duration to Target: 100-107d (2nd)
Contract of Interest: $GDX 9/16/22 40c
Trade price as of publish date: $3.75/contract

$39 is a Historic level$39 on the GDX has been a big support/resistance level from the very beginning. In play once again.

4/3/22 NEMNewmont Corporation ( NYSE:NEM )
Sector: Non-Energy Minerals (Precious Metals)
Market Capitalization: 65.607B
Current Price: $82.78
Breakout price (hold above): $80.10
Buy Zone (Top/Bottom Range): $77.65-$74.05
Price Target: $89.20-$90.90
Estimated Duration to Target: 65-68d
Contract of Interest: $NEM 6/17/22 90c
Trade price as of publish date: $2.56/contract

Gold miners ETF (GDX) taking off again!The Gold Miners ETF, GDX, as expected, launched itself after a small recoil.
The Weekly chart key takeaway is that the MACD and RPM followed through, but better yet, this week saw the weekly candlestick to be in a rather bullish position, closing the week on a recent 9-month high.
Fibonacci projections bring a 47.50 upside target in the following weeks.
The Daily chart confirms the bullish indications similarly. Having bounced off an intermediate support, the technicals are turning bullish again as the strong close for the last day of the week encourages a breakout above 40.

Arc in GDXJ / GDX ratio points to junior mining bullmarketIf you make a ratio of Gold Juniors to Gold Majors, you will find that there is an arc in the making since 2010.
It looks like we are about to enter the fun side of the arc, where juniors outperform majors.
This is historically often a sign of liquidity and luster returning to gold, in the form of rising gold prices, and risk securities outperforming.
Got Juniors?

GDX 2hr - Zooming in on the daily lookDialing in to the 2hr chart, GDX continues to demonstrate a bullish stature... Looking for $52 - $54 range to cap off (5) of circle 3... with extension to 1.618 toward $59 as a possiblility. Metals can often extend in very bullish markets. GDX should remain above $35 near term, with $33.50 as my line in the sand.

GDX macro look... Would not short this...Gold charts are tricky right now, but examining the miners, we see a much larger bullish trend that portends higher.

GDX: Room for MoreFor GDX, there is still room for more upwards movement! As the ETF has only touched the blue zone between $39.30 and $43.86 so far, we expect it to go for it again and more firmly this time, crossing even the resistance at $40.13. After it has finished wave (b) in blue in the blue zone, GDX should rattle down through the support at $28.83 and into the magenta zone between $27.49 and $19.52, where it should complete wave (c) in blue as well as wave ii in magenta. Then, GDX should turn around and move upwards, heading for new highs above the resistance at $40.13. However, there is still a 30% chance that the price might not rise from the magenta zone but could fall through it and below the support at $16.18 instead.

potential 1hr bull flag c wave up to 2040-2050?looking on the 1hr and doing an elliott wave count, I see one more possible retest to 2040 from the bull flag c wave up
both bull and bear. I would look to reshort from this point

$GDX Gold Miners WeeklyGDX weekly nice chart with Triangle breakout and volume increasing with MACD opening up all implying more room to the upside.
I'm in April 35/40 debit spreads and looking for 40 as the first price target.
XME (metals) Gold Silver all appear to be ready to make a bull run, keep these on your watchlist especially with some weakness still in the equities market.

Decade of GDX Channels"Market Memory" is illustrated well in the long-term support and resistance lines of GDX

GDX Nice breakout here so farGold and miners might be finally ready to make a run with a nice breakout of resistance line here. MACD showing bullish confluence and 9/20 moving average cross
I'm long april 35/40 debit spreads

GDX... Launched!The Gold miners ETF had a clear launch over the last two weeks, amidst the build up of the global events in Europe.
The Weekly chart has a sustained double breakout of a short term trendline, and the weekly 55EMA. The technicals (MACD and RPM) are very supportive, crossing upwards and into bullish territory.
The Daily chart shows the past two weeks developments, nothing short of being impressive and decisive. An immediate term resistance is seen, but am optimistic that the Gold miners have launched from the base low, at long last.
As previously mentioned... Gold prices have since moved significantly to above 1900, and equites are on the rise.
This are supportive of the GDX. Currently, a slightly stronger USD is disregarded and off set by the previous two.
GDX has since moved up 10% and is slated for much for upside, way above 40 IMHO. Projections in a later following post...

Time for the Juniors to Shine AgainHere we have an extremely similar setup to late 2015, right before the junior miners went on an epic tear. Note the divergence in the dynamic RSI oscillator, and how similar the action now is to 2015. The ratio also just broke out against the S&P.
Are you loaded up for this run??

$GDXAs paper money inflates and loses value gold prices rise.
CHART LEGEND:
white dashed lines = bull/bear takeovers
blue lines = call targets
yellow lines = put targets
red line = danger zone
orange lines = trend lines
green lines = safe zone
any other lines add will be discussed with the ticker
AMEX:GDX

GDX LONG, MASSIVE MONTHLY BULL FLAG = Target $58.40This is a MASSIVE Monthly BULL FLAG (Blue). After breaking down this massive trend channel GDX has recovered and is now breaking back into the huge UPTREND Price channel while MACD is remaining above ZERO.
I realize the month is not over yet but when you are struggling to find places to put your money when the stock market is retracing this would be my next trade. Also with the Gold chart looking better each day and that GLD Trade I posted going so well this would be the place to add to that exposure with more upside potential.
Long at OPEN tomorrow.
Target = height of the flag pole putting us at $58.40
