Day 25 — Trading Only S&P Futures | Gold’s Rally Raises FlagsWelcome to Day 25 of Trading Only S&P Futures!
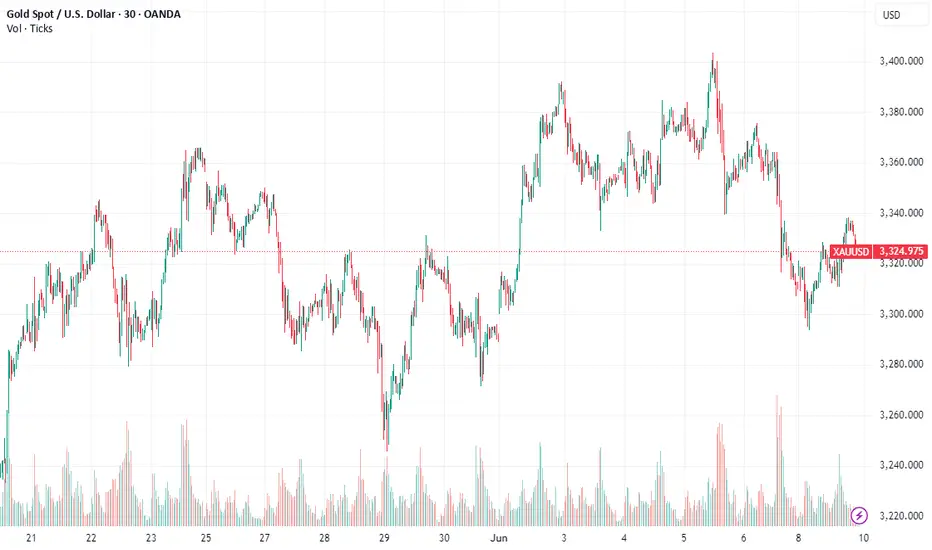
Today started strong with an overnight short and continued by taking longs at major support levels. With the FOMC blackout period in effect, I leaned bullish but stayed selective, waiting for the 5-min MOB to hit before entering. That trade paid off and I wrapped the day at +264.83.
Still, there’s a cautionary note: gold just hit a record high above $3,633/oz, and that could be signaling underlying stress in the markets. Something to keep an eye on as we move forward.
🔑 Key Levels for Tomorrow
Above 6480 = Remain Bullish
Below 6465 = Flip Bearish
📰 News Highlights
SPOT GOLD EXTENDS GAINS, LAST UP 1.3% TO HIT A RECORD HIGH OF $3,633.65/OZ
GLD

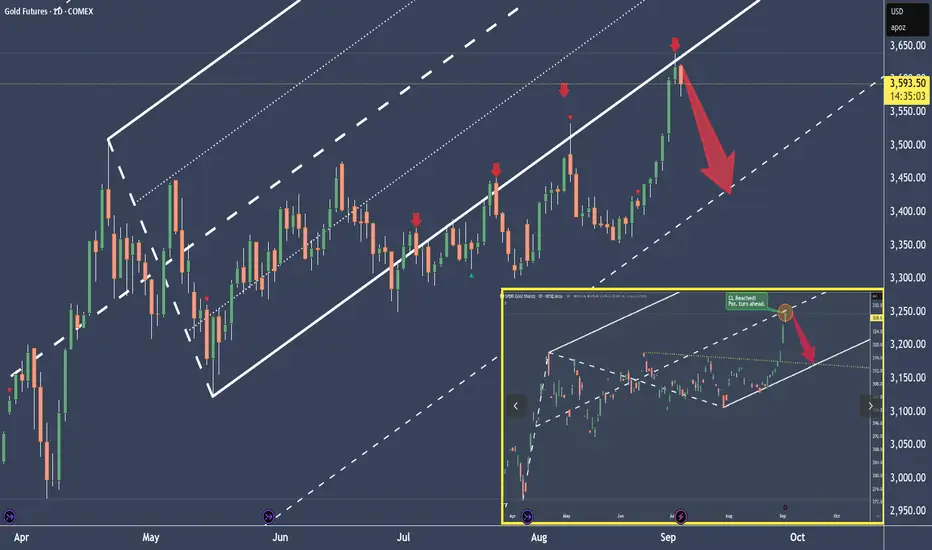
A Gold/GLD Drop Scenario You Should Not IgnoreSometimes you don't need a ton of information.
Sometimes, it's just the right moment when a few facts come together, and you make up your mind.
That's the case now with Gold for me.
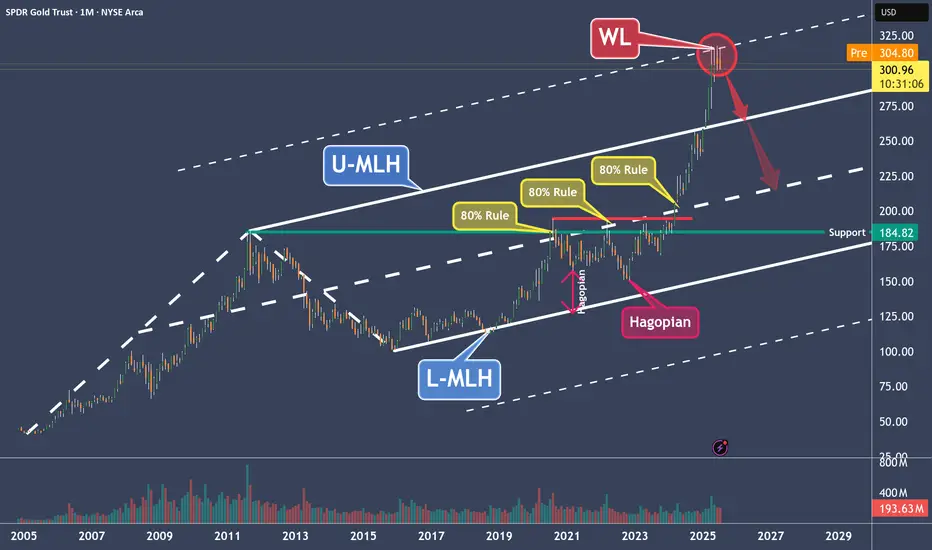
We know that the behavior changed when Gold left the Fork in July.
We also know that if price leaves a Fork, it's highly possible we’ll see a test/re-test at the L-MLH, the lower median line parallel.
Additionally, Allan H. Andrews, the inventor of the Median Lines/Forks, wrote back then that price could also crawl along the parallel line for a longer period. And if price can't manage to jump back into the Fork—regaining the trajectory of the slope—it will trade in the opposite direction sooner or later.
Last but not least: I checked GLD too. Surprisingly it reached the Centerline just yesterday (See screenshot in the right lower corner of the Chart). So price has a high tendency to turn in the opposite direction when balanced again.
So, there you have it.
I’m planning a short, with profits at the WL as my first target.
But what if it goes wrong, if price climbs higher?
Well, then I’ll probably get stopped out, which is nothing more than part of this business.
Any questions?
Don't hesitate to ask me. It's the only way humans learn—by asking questions.
Cheers
§8-)
Gold maybe ready to memeGold has a potentially explosive setup if clears a level directly above. It can meme to $4k

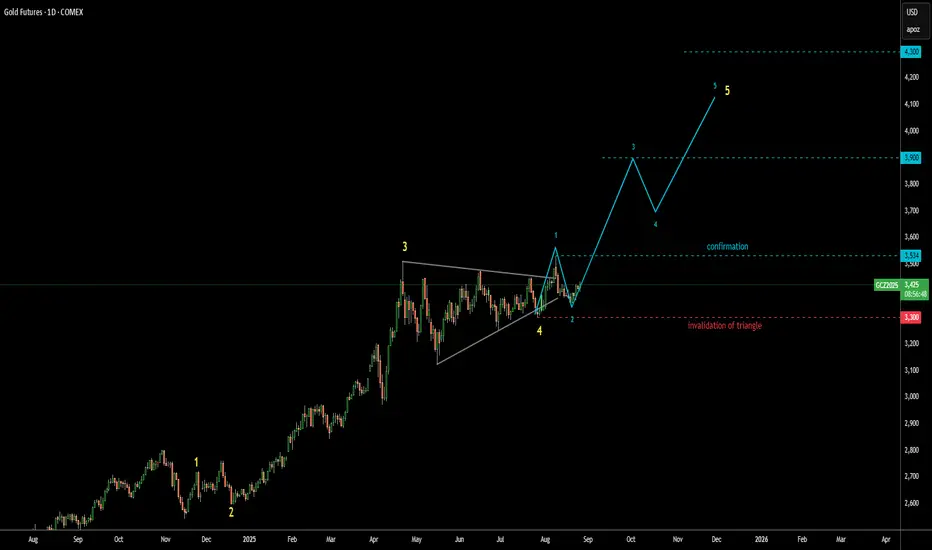
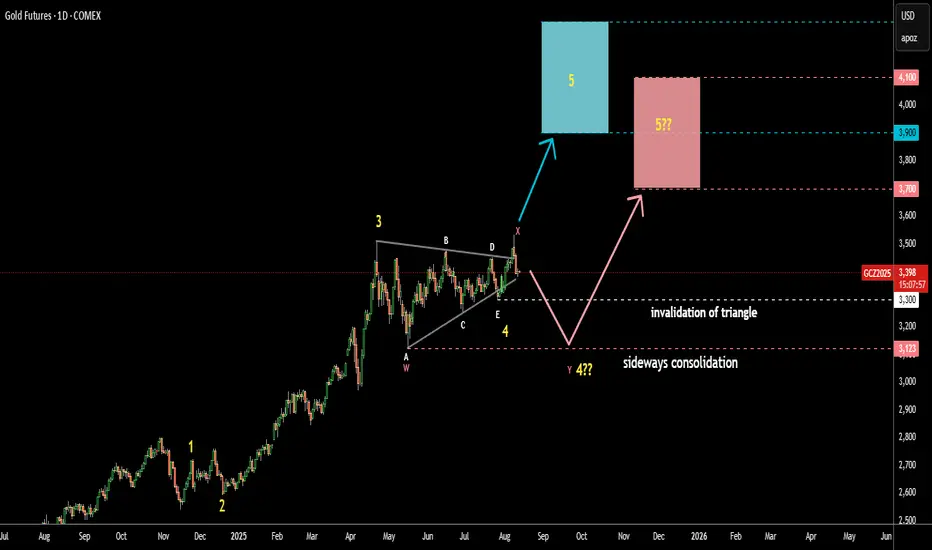
Gold Update 26AUG2025: Bullish Confirmation Above $3,534 The gold futures price has made a U-turn as it didn't trigger Triangle's invalidation at $3,300
This bounce back could be a harbinger of wave 3 within the larger degree wave 5
It will be confirmed once upmove breaks above the top of wave 1 beyond $3,534
I erased the complex correction scenario as the price might be taking off right now
I added the breakdown of the upcoming large wave 5 into smaller 5 waves inside
Target range remains intact between $3,900 and $4,300
Gold Deep Dive: Cycles, Correlations, Divergences, SymmetryGold has been in a raging bull market and almost up over 100% since its monthly bullish engulfing candle.
Gold sniffing out week monetary policy and rallying on the back of easing global monetary policy.
Historically from a trading standpoint, Gold is extremely overbought and could be 4-8 weeks away from a considerable pullback of 15-30% .
Many Signals such as symmetrical moves, Monthly overbought RSI, Copper / Gold Divergence, GDX resistance is telling us to use caution and trim long profits.
It does seem like gold wants $3500 before it has a reversal back down. We are looking for a liquidity sweep of the ATH as a possible short zone. (Not FA advice)
Once gold resets some indicators and allows longer term moving average to catch up it will likely keep pushing but we only for see that in mid to late 2026.
If we make a new high....we don't see much upside for the next 3-6 months.

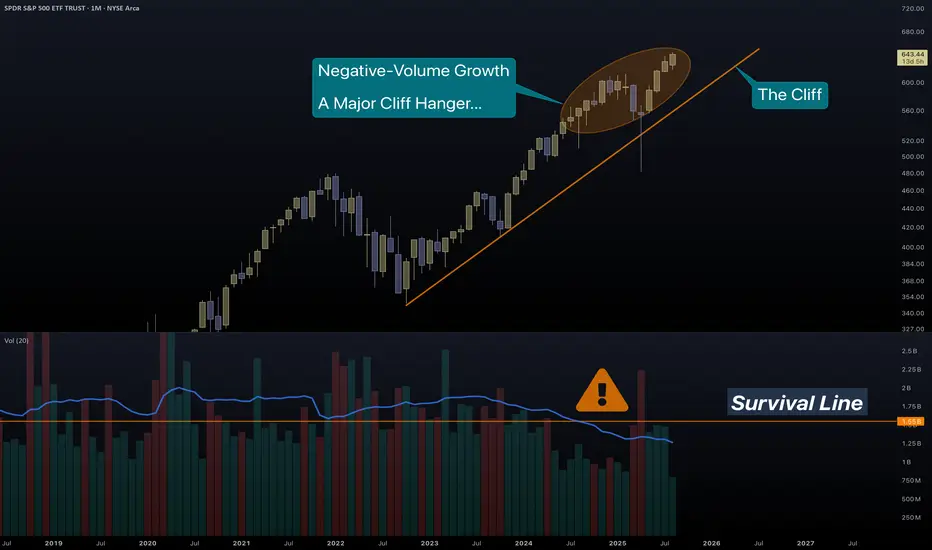
SPY | Leap of Doom?SPY just jumped...
The wrong way up!
To sustain you must conserve. To climb up a hill, you need energy, resources like food and water. The energy they give you far out-weighs their absolute mass. Therefore it makes sense for you to carry them.
And they have taken you very far...
But now you have run out of energy.
Price growth needs transaction volume to have strength and meaning.
You are too light(headed) to realize that moving further up is a dead-end.
THIS IS NOT SOMETHING SMALL.
SPY is one of the largest Funds in the world. A first-ever major violation of volume trend, in such a big index, must not be ignored. Imagine what is happening underneath...
Look at some examples:
NVDA
The most massive of companies, has a multi-year issue with volume.
MSFT
Unlike its first growth, Microsoft has a tremendous loss of strength in volume metrics.
Such long-term drop in volume means that companies offload real stocks for cheap futures .
We witness the same with Bitcoin...
And gold...
Not quite doomed yet, but troublesome still.
TSLA
Tesla with their shiny and financially pointless cars, has made a pointless growth. Just like many stocks as you will soon realize.
AAPL
The masses, even though their name suggests that they have some matter, in reality they don't. 10% of people have 90% of wealth. Investors have long left Apple, leaving the hoard inside to bubble up the dream.
There is more and more proof that the Fab5 (well the Fab500 as we can see from SPY/SPX) are replacing stocks with derivatives. Real money replaced by weapons of mass destruction, just like Warren Buffett said.
Good luck to us all...
PS. Something irrelevant to stocks, but relevant to the fundamentals of investing in AAPL.
Judging by the recent UI decisions, they trapped the users in bubbles and they are unable to see the truth. Brilliantly, they changed the name of soap bubbles to liquid glass. (bubbles are shiny, crystals are rough).
As a long-time Apple user, now not much of an Apple lover, I know quite well the changing philosophy of them. iPhone (and all products) began as a phone for the "smart" ones and ended up the No1 desire for the masses.
After a decade, I have switched to Fedora Silverblue for 90% of my leisure.
GOLD: Squeeze to Rate Cut, then Blast-Off to $4200?The price of gold, a classic safe-haven asset, is currently in a state of flux due to several interconnected factors. Looking at future events and fundamentals, we can anticipate how they might impact its price points.
Powell's Rate Cut
An anticipated rate cut from Federal Reserve Chairman Jerome Powell on 17SEP25 is a key bullish signal for gold. Lower interest rates typically decrease the opportunity cost of holding non-yielding assets like gold, making them more attractive compared to interest-bearing bonds. If JPow begins to drop rates in September (and is dovish in comments regarding further cuts), we could begin to see the beginning of gold's next measured move to around $4200 (see purple target). If JPow doesn't cut, doesn't cut enough, or cuts but is extremely hawkish towards further cuts; expect a pullback towards the 200-day moving average and further ranging for a period until the next Fed Chairman is confirmed.
President Trump has recently called for the Federal Reserve to make significant cuts; in one instance stating that rates should be lowered by three percentage points from their current range. As of 19AUG25, Treasury Secretary Scott Bessent has indicated 11 possible candidates for the next Fed Chair position; expect that when confirmed, the next Fed Chair may significantly reduce rates (but do not assume the next Fed Chair will cut as deep as three percentage points).
BRICS Monetary Competition
Additionally, the push for de-dollarization by BRICS nations is a significant long-term driver for gold. Countries like China and Russia are actively increasing their gold reserves to diversify away from the U.S. dollar, creating sustained demand. This monetary competition fundamentally alters gold's role, positioning it as a key component of a new, multi-polar financial system. As central banks continue to accumulate gold, it strengthens the metal's standing as a universal reserve asset. This trend is likely to provide a strong floor for gold prices around its 200-day moving average, and any significant moves toward a gold-backed BRICS currency could lead to a monumental re-evaluation of gold's value, potentially pushing its price to the $4,000/oz range or higher over time.

Gold Update 13AUG2025: Risk of Sideways Consolidation Last Friday, August 8, the price failed to progress above the April top as it closed underneath. Hence, there are two possible scenarios from here:
The price could have just completed the first wave up in a larger wave 5, and we may see a retracement. This setup remains valid as long as the price stays above the last wave E of the Triangle at $3,300.
The large sideways consolidation (WXY) might take shape, potentially retesting the bottom of wave A at $3,123. In this case, the target could drop lower, with potential support in the pink box area between $3,700 and $4,100.
Which one do you think plays out?
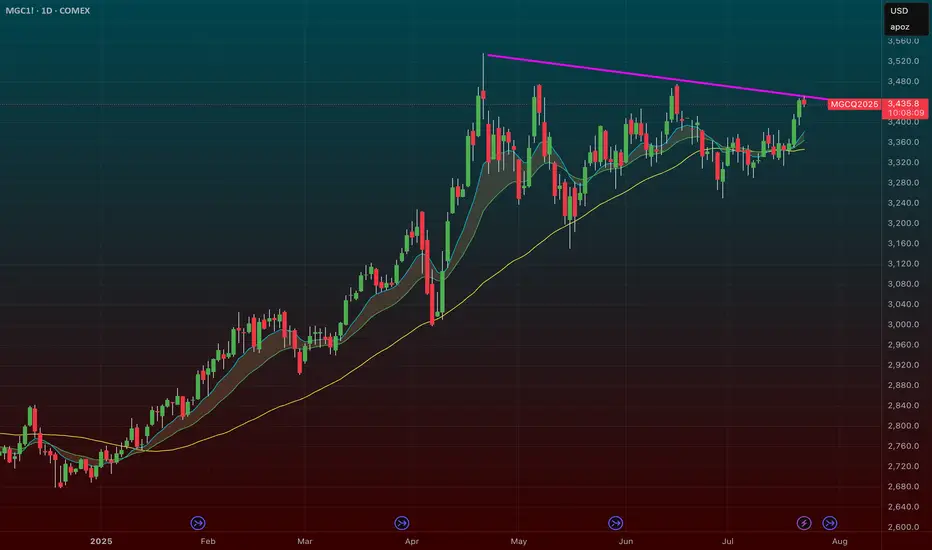
Gold Update 06AUG2025: Price Tests ResistanceThe Triangle pattern in gold futures remains highly reliable.
Wave E held above the low of Wave C, maintaining the structure.
Price is now testing the Triangle’s upper resistance.
A breakout above this level would confirm the bullish setup.
The target zone remains unchanged: $3,900–$4,300.

GLD – Why Gold Is a Clear Short to MePrice moved from the Lower Median Line (L-MLH) up to the Centerline, fulfilling the 80% rule.
Then we had two Hagopians, which sent price right back to the Centerline.
After the breakout above the Centerline, the next target was the Upper Median Line Parallel (U-MLH), which was reached rather quickly.
Finally, price broke above the U-MLH and was pulled up toward the Warning Line (WL).
Is this the end of the happy story?
I think so—because Gold has now reached its 2nd standard deviation, and there’s probably no more gas left in the tank.
The Trade:
- A logical target is the U-MLH.
- A secondary target is the Centerline.
At the very least, if you're long, this might be a good time to take some profits—because no tree grows to the moon.
For further details, I will follow-up with a Video explanation - See my Signature.
$GLD short term top in $260-148 target on the downsideAMEX:GLD looks a bit extended here. I could see the possibility of GLD falling back to the $260 support at a minimum and maximum all the way down to $148
The $209 support would be the 50% retracement of the recent run. I like that as a level for a bounce.
Let's see where we end up.

BEAR TREND COMMING FOR GOLD trader in 28.july . 2025
XAUUSD : in my expectation and analysis i tend to see gold to make bear run for short to med term ,, target 2850 USD
good luck

Gold Update 28 JULY 2025: On The EdgeGold is accurately following the path shown in my earlier post.
Wave D respects the triangle rules, staying below the top of wave B.
Wave E appears nearly complete, even piercing the A–C support line.
This is acceptable as long as wave E stays above the wave C low at $3,251.
Keep a close eye on this invalidation point.
The target range remains unchanged: $3,900–$4,300.

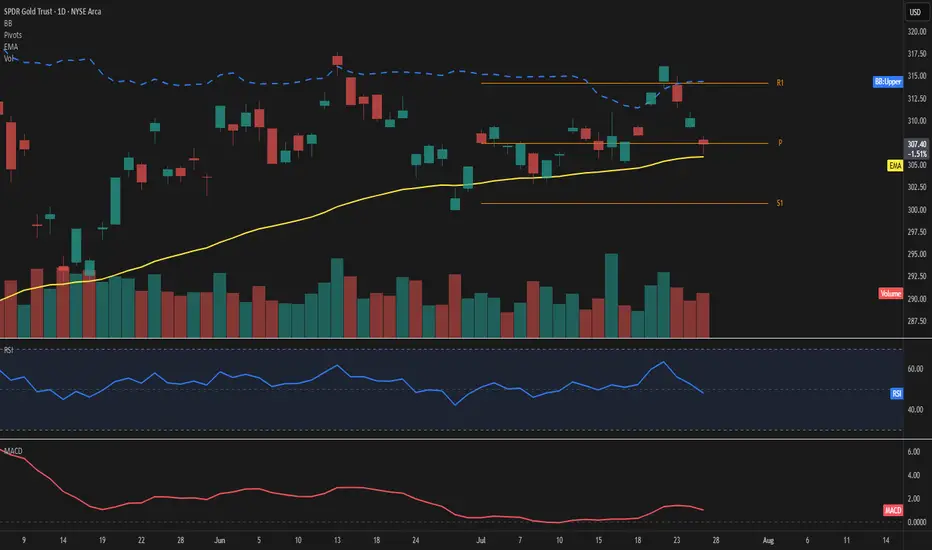
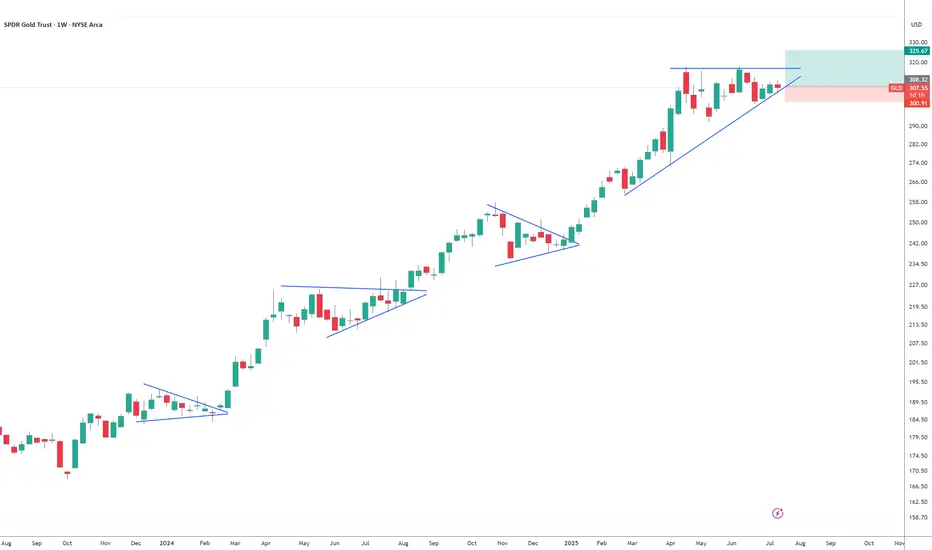
GLD – Price consolidates at highsPrice is hovering just above the 50-day EMA at 307, showing signs of short-term hesitation near the Fibonacci pivot. The upper Bollinger Band sits at 314, leaving moderate room for expansion if momentum picks up.
The RSI reads 48, reflecting a balanced setup without clear directional bias. MACD remains slightly positive, suggesting a still-constructive but soft momentum.
Key levels to watch include the pivot at 307 and the support at 301. On the upside, the 314 area aligns with both R1 and the upper band, acting as the next challenge.
Volume is up sharply (+22%) despite a mild -0.9% price pullback, indicating possible accumulation beneath the surface.
As long as price holds above the 50-day EMA, the structure remains intact.
A move away from the pivot zone will likely define the next directional wave.
$GLD / $GC – Gold Poised for Breakout as Hard Assets FlexAMEX:GLD / SET:GC – Gold Poised for Breakout as Hard Assets Flex
Gold is setting up for a major breakout, and the broader market is finally catching on to the hard asset trade. Whether it’s inflation ticking up or the never-ending government deficit spending, the market is starting to signal something big.
🔹 Macro Tailwinds:
Inflation pressures + record deficit = a perfect storm for gold.
The dollar is under pressure — metals ( AMEX:GLD , AMEX:SLV , SET:GC ) are responding.
This theme isn’t going away anytime soon.
🔹 Technical Setup:
AMEX:GLD and SET:GC (Gold Futures) are coiled tightly just under breakout levels.
Volume is steady, and momentum is building under the surface.
A move through current resistance could send this entire trade into overdrive.
🔹 My Positioning:
1️⃣ Options: Long AMEX:GLD calls with 1-month expiration — slow mover, but clean structure.
2️⃣ Futures: Trading SET:GC contracts on the breakout side.
3️⃣ Silver Exposure: Still holding partials in AMEX:SLV — it’s following gold’s lead but with more juice.
Why I’m Focused Here:
This is not a one-day theme — hard assets are becoming a rotation trade.
If this confirms, we could see multi-week upside in precious metals.
It’s rare to get clean technicals that align this well with macro.
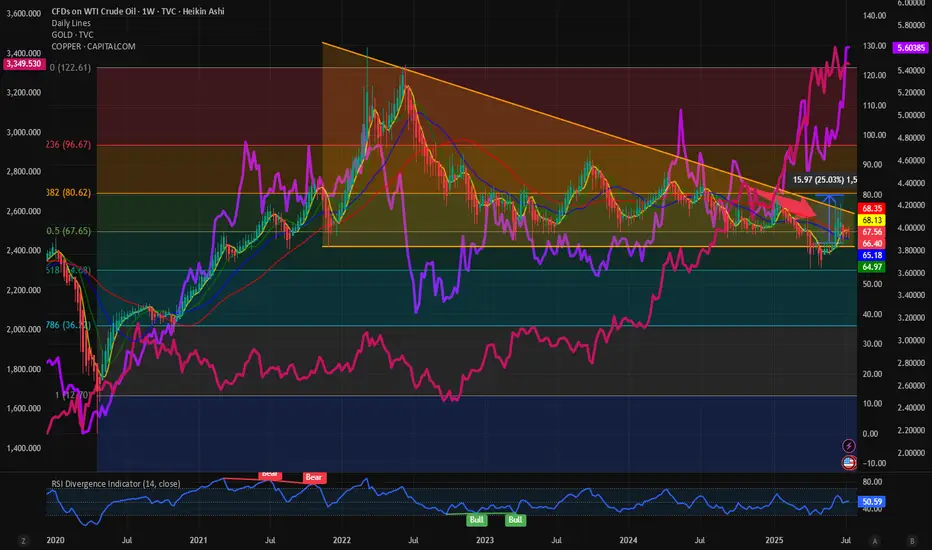
$USOIL: Will we see breakout or breakdown from this wedge? I have been watching the Commodity markets recently keenly to get direction or for market indications. AMEX:GLD , Copper and TVC:USOIL are the big 3 which determines the direction of commodity markets and hence the inflation. Inflation dictates direction of TVC:US10Y , TVC:DXY and hence the Equity markets. So, what are commodity markets telling us? With AMEX:GLD and OANDA:XCUUSD at ATH what does this mean for TVC:USOIL : TVC:USOIL Is in a bearish pattern and no sign of concrete bullish reversal on the commodity. Recently it has shown some signs of strength but still below its 0.5 Fib retracement level which is at 68 and we have time and again said that 0.318 Fib level at 80 $ might prove to be an upper resistance which will be difficult to breakout.
In the recent months whenever TVC:USOIL tries to break out of the 60 RSI sellers came back and pushed the prices down. Currently with RSI at 50 we might have some room for upside. Oil bulls can have a 20% upside in the RSI taking it to 60 which has historically proved to be a resistance. And a 20% upside in price is also possible with price hitting our 0.318 resistance level of 80%. Above that there is limited upside for $USOIL. The downward slopping wedge shown below indicates a breakout might be imminent which might take TVC:USOIL to 80 $ which is our highest target in this range bound market.
In contrast the bull run in other important commodities like AMEX:GLD and COPPER might have some legs as they are showing strength by breaking above the previous ATH. It is always a good idea to buy strength and ATH.
Verdict: TVC:USOIL remains range bound with 55 $ on lower bound and 80 on the upper bound. Commodity bulls can look at AMEX:GLD and OANDA:XCUUSD for better returns.
Gold!!!!!Looks like GLD is setting up for a big move to the upside. It likes to consolidate for a few weeks before a massive breakout. I have some GLD calls strike 310 for September 19. My SL triggers if a weekly candle closes under trendline. TP 325 ish.
$DXY: New lows begets new lows. $USM2: Why is it increasing? Here we are again with one more TVC:DXY chart analysis. I think the US Dollar does not fail to surprise us week after week. Making new lows every week is giving a boost to the Equity markets. The SP:SPX and NASDAQ:QQQ are at ATH. In my articles on April 18 and June 16
Perfect trade setup: AMEX:GLD to 325; DXY to 95 for AMEX:GLD by RabishankarBiswal
TVC:DXY weakness and EM markets: NSE:NIFTY more upside? for NSE:NIFTY by RabishankarBiswal — TradingView
We have time and again said that in the near term TVC:DXY chart looks weak and could touch 95 by end of July. I think it might be achieved earlier. We have looked at the consequences of 95 handle on TVC:DXY on various asset classes like AMEX:GLD , NSE:NIFTY and EMs. These asset classes are reaching ATH every single week. But we have seldom investigated the reason behind the weakness in $DXY. Looking through my macro charts I found an amazing chart which might explain most of this weakness.
The ECONOMICS:USM2 is almost at 22 T $ surpassing its previous high on March 2022. M2 is basically the total amount of money in circulation in the economy on top of the nominal M1. Higher M2 indicates higher amount of liquidity which is then channelized into riskier assets like CRYPTOCAP:BTC , AMEX:GLD , SP:SPX , NASDAQ:QQQ and EMS like $NIFTY. And with such high ECONOMICS:USM2 in circulation, it is very clear why TVC:DXY is making new lows each week. This can also explain why US Fed is hesitant to reduce rates. With M2 so high US Fed should not hurry.
Verdict: TVC:DXY to 95 by 31 July, Cycle low of 90 by year end. ECONOMICS:USM2 keeps increasing. US Fed stays put.

Gold Update: Possible Triangular Consolidation Before New RallyIt looks like corrective wave 4 is in the making within a large Triangle
3 waves A, B and C already emerged in 3-waves structure
which confirms triangle
Wave D should stay under the top of wave B
Wave E could either touch or break down the support line
It should keep above the valley of wave C
Target area changed higher as this consolidation tends to narrowing within a
contracting triangle.
Lowest target now $3,900
Optimistic target is at $4,300
Breakdown below $3,123 would invalidate the pattern

GOLD GOES 'PREPARING FOR SCORCHING-HOT JULY'. UPSHOT OF 1H 2025Gold market shines bright in first half of 2025, with nearly 25 percent year-to-date gain, which becomes one of the best start of the year in history ever following 1H 2016 (became a launching pad for Gold to more than Triple in price over next decade) and 1H 1973 (where Gold bugs sharply skyrocketed to infinity and beyond, printed more than 10x over next decade).
The gold spot market in July 2025 is shaped by both fundamental and technical factors supporting a cautiously bullish outlook.
Fundamental perspectives
Were you ready or not, Gold prices have surged significantly in 2025, driven by persistent global uncertainties including geopolitical conflicts (e.g., Middle East tensions), trade disputes, and inflation concerns.
Central banks, notably the Federal Reserve, are expected to cut interest rates later in 2025, reducing the opportunity cost of holding gold, a non-yielding asset. This monetary easing alongside continued inflation worries and safe-haven demand underpins strong gold fundamentals.
Major financial institutions like J.P. Morgan and UBS forecast gold prices averaging around $3,500–$3,675 per ounce in late 2025, with potential to reach $4,000/oz by mid-2026.
Central bank gold purchases and diversification away from US dollar assets also support demand.
Technical perspectives
Technically, gold has experienced volatile but mostly sideways trading in a roughly $300 range around $3,200–$3,500 since mid-2025, reflecting consolidation after a strong rally earlier in the year.
Key support lies near $3,000 and $3,200 levels (125-Day, or 6-Month SMA), with resistance around $3,500 to $3,800. Indicators such as moving averages and RSI suggest an upward trend with possible short-term corrections.
A breakout above $3,500 could trigger further gains toward $3,800, while a drop below $3,200 may lead to testing $3,000 support.
Overall, July is expected to see continued range-bound trading amid new external uncertainties, with bullish momentum intact.
In summary, gold’s fundamentals remain robust due to macroeconomic and geopolitical drivers, while technicals point to consolidation with potential for renewed upward moves in the July 2025 spot market.
--
Best #GODL wishes,
@PandorraResearch Team 😎

GLD Weekly Trade Setup — June 16, 2025🪙 GLD Weekly Trade Setup — June 16, 2025
🎯 Instrument: GLD (SPDR Gold Shares)
📉 Strategy: Short Bias via Puts
📅 Entry Timing: Market Open
📈 Confidence Level: 65%
🧠 Technical & Sentiment Snapshot
Current Price: $311.78
5-Min Chart: Below EMAs (10/50/200); RSI ≈ 34 → short-term oversold
Daily Chart: Above 10EMA ($309.94), RSI ≈ 56 → neutral-to-bullish
Bollinger Bands: Near lower band on M5 → volatility likely
Support/Resistance:
• Support: $311.68 / $307.28
• Resistance: $312.20 / $313.00
🗞️ Market Sentiment Overview
VIX: Elevated at 20.82 → high risk premium environment
Options Flow: Heavily put-weighted near $305–$310 strikes
Max Pain: $285 → bearish options bias into expiration
News: Geopolitical tensions increase flight-to-safety temporarily, but fading momentum fuels retrace setups
🔽 Recommended Trade: GLD PUT
Parameter Value
🎯 Strike $307.00
💵 Entry Price $0.84
🎯 Profit Target $1.25–$1.70
🛑 Stop Loss $0.50
📅 Expiry June 20, 2025
📏 Size 1 contract
⚖️ Confidence 65%
🧷 Trade Plan
📥 Entry: At market open
📈 PT Zone: $1.25 to $1.70 premium, based on drop to $306–307
🛑 Stop: If premium drops to $0.50 OR GLD breaks above $313
💰 Risk Mgmt: Keep exposure <2% of total account equity
⚠️ Key Considerations
Upside Risk: Sudden bullish shift or risk-off headlines can drive reversal
Time Decay: Premium erosion risk is higher if GLD consolidates
Volatility Drag: VIX dropping could suppress put premiums quickly
🧾 TRADE_DETAILS (JSON)
json
Copy
Edit
{
"instrument": "GLD",
"direction": "put",
"strike": 307.0,
"expiry": "2025-06-20",
"confidence": 0.65,
"profit_target": 1.25,
"stop_loss": 0.50,
"size": 1,
"entry_price": 0.84,
"entry_timing": "open",
"signal_publish_time": "2025-06-16 16:15:17 UTC-04:00"
}
💡 If GLD struggles to reclaim $312.20 at the open, the put setup becomes attractive. Breakout above $313? Exit quickly.

GOLD poised for breakout GLD & /gcAfter going on a huge run to 317 we have spent a significant time now basing out and consolidating we’ve come down into that 300 range and tested and built up quite a bit of support
With the Iranian intentions we could kickstart the next move in gold 317 is the breakout. I am looking to play this breakout on an intra day pull back with some calls one month out for a swing Trey looking at the 320 or 325 strike price

Silver & Gold Surge: SLV Inflows & GLD TargetsThe precious metals market is currently experiencing a significant surge, with both silver and gold capturing the attention of investors worldwide. This rally is underpinned by a confluence of factors, ranging from robust investment inflows into exchange-traded funds (ETFs) to evolving macroeconomic landscapes and persistent geopolitical uncertainties. The iShares Silver Trust (SLV) ETF has witnessed an unprecedented influx of capital, signaling a strong bullish sentiment for the white metal, while gold, represented by the GLD, is poised for a potential rebound, with analysts eyeing key price levels. Understanding the intricate dynamics driving these movements is crucial for anyone looking to navigate the contemporary financial markets.
SLV ETF Inflows Surge: Silver's Accelerated Rally
The iShares Silver Trust (SLV), the world's largest silver-backed exchange-traded fund, has recently recorded its most substantial inflows in years, marking a pivotal moment for the silver market. Last week alone, the SLV ETF saw weekly inflows surge by $451 million, a dramatic increase from previous weeks, pushing its year-to-date inflows to over $458 million and its total assets under management to more than $17 billion. This remarkable accumulation of capital into SLV signifies a profound shift in investor sentiment, reflecting a strong conviction that silver prices are set for continued appreciation. When investors pour money into an ETF like SLV, it directly translates into the fund acquiring more physical silver, thereby tightening supply and exerting upward pressure on prices. This massive inflow is not merely speculative; it indicates a broad-based belief among both institutional and retail investors in silver's potential.
Several key factors are fueling this accelerated rally in silver prices. One significant driver is the record-breaking surge in gold prices. Historically, silver has often been referred to as "poor man's gold" due to its similar safe-haven properties but lower price point. When gold experiences a substantial rally, silver often follows suit, as investors look for a more affordable alternative within the precious metals complex. Gold's recent ascent to nearly $3,500 per ounce has undoubtedly created a halo effect for silver, drawing in capital from those seeking exposure to precious metals without the higher entry cost of gold.
Another compelling reason for silver's outperformance is its perceived undervaluation relative to gold. The gold/silver ratio, which measures how many ounces of silver are needed to buy one ounce of gold, had peaked at around 106 when gold was surging. However, this ratio has since dropped significantly to around 92, indicating that silver has begun to catch up, suggesting it was previously undervalued. This rebalancing of the ratio has encouraged investors to shift their focus towards silver, anticipating further narrowing of the gap.
Beyond its role as a monetary metal and safe haven, industrial demand plays a uniquely critical role in silver's price dynamics, distinguishing it from gold. Silver is an indispensable component in numerous high-tech and green energy applications due to its exceptional electrical conductivity, thermal properties, and reflectivity. The renewable energy sector, particularly photovoltaic (PV) solar panels, consumes substantial amounts of silver, with each panel containing approximately 20 grams of the metal. The global push towards decarbonization and the increasing adoption of solar energy are creating an insatiable demand for silver. Additionally, its use in electric vehicles (EVs), electronics manufacturing, 5G technology, and medical devices further bolsters its industrial consumption. Reports indicate that global silver demand reached 1.2 billion ounces in 2024, driven by these industrial applications, with a significant supply deficit projected to continue. This robust and growing industrial demand provides a strong fundamental floor for silver prices, making it less susceptible to purely speculative swings.
Geopolitical tensions and economic uncertainties also contribute to silver's appeal as a safe-haven asset. In times of global instability, investors tend to flock to tangible assets like precious metals to preserve wealth. While gold typically garners more attention in such scenarios, silver also benefits from this flight to safety. The ongoing geopolitical developments and concerns about inflation continue to reinforce the attractiveness of both gold and silver as hedges against economic volatility and currency depreciation.
From a technical analysis perspective, silver's rally appears robust. The iShares Silver Trust (SLV) has broken above significant resistance levels, such as $31.75, which had previously acted as a ceiling. The ETF is trading well above its 50-day and 100-day Exponential Moving Averages (EMA), indicating a strong bullish trend. While the Relative Strength Index (RSI) has moved closer to overbought levels, the overall trend remains bullish, and the MACD indicator continues to signal upward momentum. Analysts suggest that if these technical indicators hold, silver could target the $40 mark in the near future. The breadth of participation from both institutional and retail investors, coupled with increasing trading volumes, suggests that this rally has stronger foundations than typical short-term spikes.
Furthermore, expectations of potential interest rate cuts by the US Federal Reserve are also providing tailwinds for precious metals. Lower interest rates reduce the opportunity cost of holding non-yielding assets like silver and gold, making them more attractive to investors. The anticipation of such policy shifts often prompts investors to front-run these decisions, leading to increased demand for precious metals.
GLD ETF Weekly Forecast: Gold's Rebound Potential
While silver commands attention with its recent surge, gold, represented by the GLD remains the cornerstone of the precious metals market. Gold recently hit record highs, touching nearly $3,500 per ounce, before experiencing a slight retreat due to profit-taking and some strengthening of the US Dollar. However, analysts are now forecasting a potential rebound, with a target of $3430 on the cards for the current week, indicating that the bullish sentiment for gold remains largely intact.
GLD is influenced by a diverse array of factors, making its price movements complex yet predictable to those who understand its drivers. One of the primary factors is gold's status as a safe-haven asset. During periods of economic uncertainty, political instability, or market volatility, investors traditionally turn to gold to preserve capital. Recent geopolitical tensions, such as the ongoing conflict in Eastern Europe, have consistently driven inflows into gold, as it acts as a hedge against global crises.
The strength or weakness of the US Dollar plays a crucial role in gold's price. Gold is primarily priced in US Dollars, meaning that a weaker dollar makes gold comparatively cheaper for buyers holding other currencies, thereby increasing demand and pushing prices up. Conversely, a stronger dollar can make gold more expensive, potentially dampening demand. While there has been some recent dollar strength, the overall sentiment regarding the dollar's long-term trajectory and its inverse relationship with gold remains a key determinant.
Interest rates and monetary policy, particularly from the US Federal Reserve, significantly impact gold prices. As a non-yielding asset, gold becomes less attractive when interest rates are high, as investors can earn better returns from interest-bearing assets. Conversely, lower interest rates reduce the opportunity cost of holding gold, making it more appealing. The anticipation of future rate cuts by central banks often provides a strong impetus for gold rallies.
Inflation and deflationary pressures also influence gold's appeal. Gold is widely regarded as a hedge against inflation. When the purchasing power of fiat currencies erodes due to rising inflation, investors often turn to gold to protect their wealth. Conversely, in deflationary environments, gold's appeal as a store of value can also increase. Recent inflation data, such as the Consumer Price Index (CPI) and Producer Price Index (PPI), are closely watched for their potential impact on gold's trajectory.
Central bank reserves and their purchasing trends are another significant, albeit often overlooked, factor. Central banks globally hold gold as a reserve asset to diversify their portfolios and safeguard against financial turmoil. Increased gold purchases by central banks signal a broader institutional confidence in gold and can significantly impact its demand and price.
Supply and demand dynamics in the physical gold market, including mining production, recycling, and demand from jewelry and industrial sectors, also play a role. While new supply from mining is relatively small compared to the total existing stock, changes in production levels can still influence prices. Investment demand through ETFs and other financial products further contributes to the overall demand picture.
From a technical standpoint, gold's recent retreat from its $3,500 peak has led to some profit-taking. However, key support levels are being tested, and analysts are looking for a rebound. The immediate resistance levels are around $3340-$3345, with a more significant hurdle at $3400. A decisive break above these levels, particularly $3400, could pave the way for a retest of the $3430 mark and potentially higher, towards $3500 and even $3600. The current bias for gold remains bullish, with buying opportunities identified at key pivot levels. The market is closely watching economic reports, such as the upcoming CPI data, as well as geopolitical developments, which could act as catalysts for gold's next major move.
The Interplay Between Gold and Silver
The intertwined fortunes of gold and silver are a recurring theme in the precious metals market. While both are considered safe-haven assets, their individual characteristics lead to nuanced differences in their price drivers. Gold is predominantly viewed as a monetary asset and a store of value, making it highly sensitive to macroeconomic indicators, interest rates, and geopolitical stability. Silver, while sharing these attributes, also benefits significantly from its extensive industrial applications. This dual nature often makes silver more volatile than gold, as it reacts to both investment demand and industrial cycles.
The recent outperformance of silver, as evidenced by the massive SLV ETF inflows, suggests a market correction where silver is catching up to gold's earlier gains. The narrowing gold-silver ratio indicates that investors believe silver was undervalued and is now reasserting its true worth. This dynamic creates a powerful feedback loop: as gold rallies, it draws attention to the precious metals sector, prompting investors to look for relative value, which often leads them to silver. As silver then accelerates, it further validates the strength of the broader precious metals market.
The current environment, characterized by persistent inflation concerns, ongoing geopolitical tensions, and the global push towards green energy technologies, provides a fertile ground for both gold and silver. Gold offers a traditional hedge against uncertainty, while silver provides exposure to both safe-haven demand and the booming industrial sector. The significant institutional inflows into SLV underscore a growing recognition of silver's unique position at the intersection of finance and industry.
In conclusion, the precious metals market is currently in a robust uptrend, driven by a powerful combination of investment demand, safe-haven appeal, and fundamental industrial growth. The unprecedented inflows into the SLV ETF signal a strong bullish outlook for silver, fueled by its undervaluation relative to gold and its critical role in emerging green technologies. Concurrently, gold, despite recent fluctuations, maintains a strong bullish bias, with analysts forecasting a rebound to key price levels, supported by its enduring safe-haven status and macroeconomic tailwinds. For investors, understanding these intertwined dynamics and monitoring key economic and geopolitical developments will be paramount in capitalizing on the ongoing rally in both gold and silver. The message is clear: the precious metals are shining bright, and their current momentum suggests further upside potential.