Global Banking & Financial Stability1. Introduction to Global Banking
Global banking refers to financial institutions that operate across multiple countries and offer a wide range of services—including commercial banking, investment banking, wealth management, and cross-border payment systems. These banks connect global markets by facilitating international trade finance, foreign exchange operations, capital flows, and investment activities.
The world’s large banks—such as JPMorgan Chase, HSBC, BNP Paribas, Mitsubishi UFJ, and Citigroup—are systemically important. They hold trillions in assets and operate in dozens of countries. Their global integration enhances economic connectivity, but it also means that shocks can spread quickly across jurisdictions.
2. Importance of Global Banking in the World Economy
Global banking plays a vital role in:
a) Capital Allocation
Banks direct funds to productive sectors by offering loans, underwriting securities, and supporting business expansions. Efficient allocation helps economies grow.
b) Payment and Settlement Systems
Banking infrastructure enables fast and secure cross-border payments. Systems like SWIFT, CHIPS, Fedwire, and TARGET2 ensure the smooth functioning of global financial markets.
c) Risk Diversification
Banks diversify risk by operating across multiple geographies and asset classes. This lowers the impact of localized economic downturns.
d) Foreign Exchange & Global Trade
Banks facilitate forex trading, hedging, and trade finance instruments (LCs, guarantees). Without them, global trade would slow dramatically.
e) Financial Inclusion and Technology
Through digital banking, fintech collaborations, and mobile payments, global banks accelerate financial inclusion.
3. What Is Financial Stability?
Financial stability means the financial system—banks, markets, institutions, and infrastructure—functions smoothly without widespread disruptions. A stable financial environment:
protects savings and investments
maintains confidence in banking systems
supports credit availability
prevents economic recessions caused by financial crises
When financial stability weakens, it manifest in:
bank failures
liquidity shortages
credit crunch
currency crises
stock market crashes
sovereign debt problems
Ensuring stability is therefore a top priority for central banks and regulators around the world.
4. Key Pillars of Global Financial Stability
a) Strong Banking Regulation
Regulatory frameworks such as Basel I, II, and III set global standards for capital adequacy, risk management, leverage ratios, and liquidity.
Basel III introduced:
Higher capital buffers (CET1 requirements)
Liquidity Coverage Ratio (LCR)
Net Stable Funding Ratio (NSFR)
Countercyclical capital buffers
These measures were strengthened after the 2008 financial crisis to protect banks from insolvency.
b) Effective Central Banking
Central banks maintain financial stability through:
monetary policy (interest rate decisions)
lender-of-last-resort facilities
regulation and supervision
market interventions (bond purchases, liquidity infusion)
Institutions like the Federal Reserve, ECB, Bank of England, and Bank of Japan play critical roles in global stability.
c) Deposit Insurance & Resolution Frameworks
Deposit insurance protects small depositors and prevents bank runs. Resolution frameworks allow failing banks to be wound down without taxpayer bailouts.
d) Global Cooperation
Bodies such as:
IMF
World Bank
Financial Stability Board (FSB)
BIS
Coordinate policies, share information, and manage crisis responses.
5. Major Threats to Global Financial Stability
1. Interest Rate Volatility
Rapid changes in interest rates can affect:
bond markets
bank balance sheets
borrowing costs
debt sustainability
Sharp rate hikes, like those in 2022–2024, exposed vulnerabilities in banks holding long-dated government securities.
2. High Global Debt
Global debt—household, corporate, and sovereign—has reached unprecedented levels. Excessive debt reduces economic resilience and raises default risks.
3. Bank Runs and Liquidity Crises
Digital banking has made withdrawals instantaneous. The collapse of Silicon Valley Bank (SVB) in 2023 showed how quickly liquidity crises can unfold in the modern era.
4. Geopolitical Risks
Events like:
US–China tensions
Russia–Ukraine war
Middle East conflicts
lead to currency volatility, commodity price shocks, sanctions, and capital flight.
5. Cybersecurity Threats
Banks face risks from cyberattacks, ransomware, and data breaches. As banking becomes more digital, systemic cyber risks increase.
6. Shadow Banking System
Non-bank financial institutions (NBFCs), hedge funds, P2P lenders, and money market funds can create risks outside traditional banking regulation.
7. Climate and ESG-Related Risks
Physical climate risks, energy transitions, and carbon pricing affect asset valuations, insurance exposures, and lending portfolios.
6. Lessons from Past Financial Crises
a) 2008 Global Financial Crisis
Triggered by:
excessive leverage
subprime mortgage lending
securitization
lack of oversight
It caused the collapse of major institutions (Lehman Brothers), global recession, and massive bailouts. Stronger regulations were introduced afterward.
b) Eurozone Debt Crisis (2010–2012)
Greece, Portugal, Spain, and Italy faced sovereign debt issues. It highlighted the vulnerability of economies tied by a common currency but not by unified fiscal policy.
c) COVID-19 Crisis (2020)
A global economic shutdown triggered liquidity shortages, but coordinated policy actions (rate cuts, QE, stimulus) helped stabilize markets.
d) US Regional Bank Crisis (2023)
Banks with concentrated deposit bases and interest-rate mismatches faced collapse. It reaffirmed the importance of asset-liability management.
7. Strengthening Financial Stability in the Future
1. Advanced Risk Management
Banks are deploying AI, big data, and machine learning to improve credit scoring, fraud detection, and asset quality monitoring.
2. Technology Regulation
Regulating fintechs, digital banks, crypto exchanges, and stablecoins is essential to prevent new systemic risks.
3. Climate-resilient Banking
Stress testing for climate risk and sustainable finance strategies will be vital.
4. Cross-Border Supervisory Cooperation
As banks operate globally, regulators must share real-time data and jointly manage crises.
5. Modernized Payment Infrastructure
Central bank digital currencies (CBDCs) and faster cross-border payments may improve stability by reducing settlement risks.
Conclusion
Global banking is the lifeline of the world economy, facilitating trade, capital flows, and economic development. Financial stability, on the other hand, ensures that the system can absorb shocks, support growth, and maintain public confidence.
While global banking has become more resilient since the 2008 crisis, new challenges—cyber risks, geopolitical tensions, climate risks, leveraged debt, and technological disruptions—continue to test its strength. Ensuring financial stability requires coordinated global regulation, robust central bank policies, technological safeguards, and disciplined risk management.
In an interconnected world, the stability of one nation’s financial system directly affects others. Therefore, maintaining global banking stability is not just an economic necessity—it is essential for global peace, growth, and long-term prosperity.
Globalliquidity

Derivatives & Options Trading Trends1. Rising Retail Participation and Democratization of Derivatives
One of the most significant trends is the rapid increase in retail participation, especially in markets like India, the U.S., and parts of Asia. Platforms such as Robinhood, Zerodha, Upstox, and Interactive Brokers have made derivatives trading more accessible by offering low-cost or zero-brokerage models, simplified interfaces, and educational tools.
In India, index options volumes on NSE have surged to record highs, driven by weekly and even daily options expiries. Retail traders now actively participate in directional and non-directional strategies including spreads, straddles, strangles, and intraday scalping. Because of lower margin requirements and high leverage, derivatives have become an attractive entry point for younger traders.
This democratization comes with both opportunities and risks. While broader participation enhances market depth and liquidity, it also increases systemic concerns around over-leverage, herd behaviour, and inadequate understanding of derivatives mechanics.
2. Explosive Growth of Weekly and Short-Dated Options
Short-tenor options—weekly, daily, and even zero-day options (0DTE)—have become a global phenomenon. The U.S. S&P 500 Index (SPX) now sees major volumes in 0DTE options, favoured by traders for intraday speculation, gamma exposure, and event-driven strategies.
Similarly, in India, weekly Bank Nifty and Nifty expiries have turned into some of the most traded options worldwide. Traders prefer these contracts for:
Lower premiums
Quick payoff realization
High volatility leading to strong intraday movements
Flexibility to align with macro events (Fed decisions, CPI data, RBI policy, earnings, etc.)
Short-dated options have reshaped intraday volatility patterns, with large swings near expiry due to gamma effects and dealer hedging flows.
3. The Era of Algorithmic and Quantitative Trading in Derivatives
Quantitative models and algorithmic trading systems now dominate global derivatives markets. Hedge funds, proprietary desks, and even retail quants increasingly use:
Market-neutral strategies
Volatility arbitrage
High-frequency scalping
Options-based hedging
Gamma and vega-weighted portfolios
Machine-learning-driven directional trades
In India, algo penetration in derivatives has increased dramatically after regulatory approvals for API-based trading. Low-latency systems allow quants to execute thousands of trades per second, exploiting micro-imbalances, liquidity pockets, and implied-volatility mispricings.
Algo trading is particularly influential in options markets, where pricing inefficiencies emerge frequently due to time decay and volatility shifts.
4. Surge in Volatility Trading and Volatility Derivatives
A major global trend is the rise of volatility as an asset class. Traders now actively trade volatility, not just price direction, through:
VIX futures and options
Implied volatility strategies (IV crush, IV expansion)
Calendar spreads
Vega-neutral portfolios
Volatility arbitrage between indices and individual stocks
During major macro events—geopolitical shocks, central bank decisions, inflation releases—volatility spikes create large opportunities for professional traders.
The global appetite for volatility exposure reflects increasing macro uncertainty in markets shaped by inflation cycles, geopolitical risks, and policy unpredictability.
5. Growing Popularity of Exotic Options and Structured Derivatives
Beyond standard call and put options, demand is rising for exotic derivatives, especially among institutions. These include:
Barrier options
Asian options
Binary options
Lookback options
Range accrual derivatives
Digital payoff structures
Structured product desks in banks use these derivatives to offer tailored risk-return solutions to corporate treasuries, high-net-worth individuals, and offshore investors.
In equity derivatives, structured notes like autocallables are gaining traction globally, especially in European and East Asian markets.
6. Commodities and Currency Derivatives: A Renewed Focus
Commodity and currency derivatives have seen renewed interest due to global supply chain disruptions, geopolitical instability, and inflation pressures.
Key Drivers:
Oil price volatility due to Middle East conflicts
Agricultural supply shocks
Currency fluctuations driven by monetary policy divergence
Rising importance of hedging for import- and export-dependent industries
In India, the launch of new currency derivatives and increased retail interest in crude oil and natural gas options have broadened the market.
7. Interest Rate Derivatives and the Post-Rate-Hike World
As central banks oscillate between tightening and easing cycles, interest rate derivatives (IRDs) such as swaps, futures, and swaptions have gained remarkable importance.
Key themes include:
Hedging long-term debt exposure
Speculation on rate paths
Positioning around government bond yield movements
Managing duration risk for institutional investors
The pricing of interest rate options is now heavily influenced by inflation expectations, forward guidance, and global economic conditions.
8. Regulation, Risk Control & Margining Reforms
Global regulators have tightened rules around derivative trading to ensure transparency and reduce systemic risk. Major reforms include:
Mandatory margining for futures and options
Upfront collection of SPAN + Exposure margin
Position limits for retail participants
Greater disclosures for brokers and exchanges
Risk-based levies on high-frequency trading
Banning of certain high-risk derivatives for retail in some regions
In India, peak margin rules and tightened risk controls have significantly changed intraday derivatives strategies, reducing excessive leverage.
9. Rise of Data-Driven Decision Making
Modern derivatives traders rely heavily on:
Real-time order book analytics
Option Greeks monitoring systems
Volatility surface modelling
Big-data sentiment indicators
AI-driven predictive models
Access to sophisticated analytics platforms—Sensibull, Opstra, TradingView, Bloomberg, Reuters, and broker-provided tools—helps even retail traders adopt institution-grade analysis.
10. Shift Toward Multi-Asset Derivative Strategies
Markets are becoming increasingly interconnected. Traders now prefer multi-asset strategies that combine:
Equity + Currency
Equity + Commodity
Interest Rate + Currency
Options + Futures
Cross-country derivatives
These hybrid strategies help hedge correlated risks and exploit arbitrage opportunities across markets.
Conclusion
Derivatives and options trading are undergoing a profound transformation driven by retail participation, technological advancement, algorithmic dominance, volatility-focused strategies, and regulatory shifts. Markets are faster, more interconnected, and more complex than ever before. Whether used for hedging, speculation, arbitrage, or portfolio diversification, derivatives remain a cornerstone of modern financial markets.
As the global environment becomes more uncertain, derivatives will continue to play a crucial role in risk management and trading innovation—shaping the next era of financial markets.
Bond Yield Movements (US 10-Year, German Bunds)1. What Bond Yields Represent
A bond’s yield is essentially the return an investor earns for holding that bond. Yields move inversely to prices:
Bond prices rise → yields fall
Bond prices fall → yields rise
This inverse relationship reflects investor demand. When investors seek safety, they buy more bonds, pushing prices up and yields down. When they expect strong growth or higher interest rates, they sell bonds, pushing yields up.
Why the US 10-Year and German Bunds matter
The US 10-year Treasury yield is the world’s primary risk-free benchmark. It influences global bond markets, the US mortgage market, corporate borrowing costs, and equity valuations.
The German 10-year Bund yield is the benchmark for the Eurozone, influencing borrowing costs across Europe, including in countries like France, Italy, and Spain.
These yields act as barometers of economic health and market expectations.
2. Key Drivers of Yield Movements
a. Inflation Expectations
Inflation erodes the real return on bonds. Thus:
Higher expected inflation → higher yields, due to anticipated central bank tightening.
Lower expected inflation → lower yields, reflecting stable prices and easier policy.
Recent years have seen yields swing significantly due to rapid changes in inflation, especially after global supply-chain disruptions and energy shocks.
b. Central Bank Policies
The US Federal Reserve and the European Central Bank (ECB) play a central role.
When central banks raise interest rates, bond yields tend to rise as investors demand higher returns.
When they cut rates or conduct quantitative easing (QE)—buying bonds to inject liquidity—yields decline.
Forward guidance is equally important; even statements about future policy can move yields dramatically.
c. Economic Growth Indicators
Stronger economic data—GDP growth, employment figures, retail sales—pushes yields higher because markets expect tighter monetary policy ahead. Weak data tends to pull yields down due to expectations of lower growth and potential rate cuts.
d. Risk Sentiment and Safe-Haven Flows
During geopolitical tensions, financial instability, or market panics, investors flee to safe assets:
US Treasuries and German Bunds are premium safe-haven assets.
In risk-off environments, demand for these bonds rises → yields fall.
In risk-on environments, capital shifts to equities and risk assets → yields rise.
e. Fiscal Policy and Supply of Bonds
Large government deficits require increased bond issuance, sometimes pushing yields higher if supply outpaces demand. Conversely, fiscal consolidation reduces supply pressure.
3. US 10-Year Treasury Yield: Global Leader
The US 10-year yield is the world’s most influential interest rate. Its movements ripple across global markets.
a. Impact on Global Finance
Dollar strength: Higher yields attract capital into USD assets.
Emerging markets: Rising US yields often pressure EM currencies and stocks.
Equity valuations: Growth stocks, especially tech, are sensitive to yield changes as long-term cash flows are discounted at higher rates.
b. What Drives the US 10-Year Most
Federal Reserve policy
Rate hikes push yields up; dovish policies pull yields down.
Inflation trends
CPI, PCE inflation data strongly influence expectations.
Labor market strength
Strong job numbers raise expectations of Fed tightening.
Fiscal deficits and debt issuance
US Treasury supply can push yields higher if demand weakens.
Global demand
Foreign investors—Japan, China, and global funds—play a huge role in buying Treasuries.
c. Role in US Economy
Mortgage rates closely follow the 10-year.
Rising yields → higher borrowing costs → slowdown in housing.
Corporate debt becomes costlier as yields rise.
Treasury yields serve as a baseline for risk premiums across asset classes.
Thus, the US 10-year yield shapes both domestic and global liquidity conditions.
4. German 10-Year Bund: Europe’s Anchor
The German Bund serves a similar role for the Eurozone.
a. Why Bunds Matter Globally
Seen as the ultimate safe-haven within Europe.
Forms the basis for pricing all European government bonds.
ECB policy heavily influences Bund yields, often more directly than Fed policies affect Treasuries.
b. Drivers of Bund Yields
ECB policy stance
Tightening pushes yields higher; easing pushes them lower.
Eurozone inflation dynamics
Energy prices have historically been key drivers.
Growth divergence within Europe
Bund yields often fall when southern European debt markets show stress.
Global risk sentiment
Bunds act as safe assets during global or European crises.
c. Spread Analysis: The Bund vs. Other European Bonds
A critical aspect of European markets is the spread between the German Bund and other sovereign bonds, such as:
Italian BTPs
Spanish Bonos
French OATs
Wider spreads indicate market stress; narrower spreads imply confidence in the Eurozone’s stability.
5. Correlation Between US and German Yields
While each region has unique fundamentals, the two yields exhibit strong co-movement due to global capital mobility.
a. When US Yields Drive Bund Yields
Often seen when:
US inflation surprises the market.
The Fed adopts an aggressively hawkish stance.
Global investors move capital into or out of bonds collectively.
Because of arbitrage opportunities, global bond yields cannot diverge too much for too long.
b. When Bunds Diverge from Treasuries
This happens when:
European economic weakness contrasts with strong US growth.
ECB policy lags behind the Fed.
Eurozone debt concerns create local safe-haven demand.
Thus, co-movement is strong but not absolute.
6. Macro Implications of Yield Movements
a. For Currency Markets
Rising US yields → stronger USD.
Rising Bund yields → stronger EUR, if driven by growth rather than crisis.
b. For Equities
Higher yields pressure high-valuation sectors.
Lower yields support risk assets, especially tech and growth stocks.
c. For Commodities
Higher yields often coincide with weaker commodity demand, unless inflation is the driver.
Gold tends to fall when yields rise, as bonds offer higher real returns.
d. For Corporate and Government Borrowing
All debt becomes more expensive as benchmark yields rise.
Governments with higher debt burdens face fiscal pressure.
7. Conclusion
Movements in the US 10-year Treasury and German 10-year Bund yields hold immense significance for global markets. They encapsulate expectations about inflation, growth, central bank policy, and risk appetite. As benchmarks for global financing conditions, shifts in these yields determine everything from currency valuations and equity performance to housing markets and government budgets. Understanding their dynamics allows investors, policymakers, and traders to interpret the broader economic landscape and anticipate market trends.

Central Bank Impact on the Global Market1. Monetary Policy and Global Liquidity
The most direct way central banks impact the global economy is through monetary policy, which includes interest rate changes and balance sheet operations.
a. Interest Rate Decisions
When a major central bank changes its policy interest rate, it alters the global cost of capital. For example:
If the Federal Reserve raises interest rates, borrowing becomes expensive not only in the United States but across global markets that depend on dollar funding.
Higher rates cause international investors to pull money from emerging markets and invest in U.S. assets for better yields, leading to:
Capital outflows from emerging markets,
Currency depreciation in developing countries,
Rising borrowing costs globally.
Conversely, when central banks cut rates, global liquidity expands, and risk assets such as stocks and commodities usually rally.
b. Quantitative Easing (QE) and Balance Sheet Expansion
During crises, major central banks purchase government bonds, corporate bonds, or other assets to inject liquidity. This boosts global risk appetite because:
Investors search for higher returns,
Global asset prices rise,
Borrowing becomes cheaper worldwide.
For instance, QE by the Fed after the 2008 financial crisis and during the COVID-19 pandemic lowered global interest rates and caused a surge in liquidity across world markets.
2. Exchange Rate Movements and Currency Policy
Central banks significantly influence exchange rates, which directly affect global trade and capital flows.
a. Currency Appreciation/Depreciation
When a central bank tightens policy (raising rates), its currency usually strengthens. A strong currency has global implications:
It makes imports cheaper but exports more expensive,
It can create competitive pressures for trading partners,
It may cause global commodity prices (priced in that currency) to fluctuate.
For example, a strong U.S. dollar typically:
Pushes global commodity prices downward,
Makes emerging market debt harder to repay,
Reduces global trade volumes due to expensive financing.
On the other hand, loose monetary policy causes currency depreciation, supporting export competitiveness and global trade flows.
b. Currency Interventions
Some central banks actively intervene in currency markets. For example:
The Bank of Japan intervenes to curb excessive appreciation of the yen.
The People’s Bank of China regulates the yuan to maintain stability for its export-driven economy.
Such interventions influence global currency markets, cross-border investments, and international trade competitiveness.
3. Impact on Global Financial Markets
Central bank decisions directly affect global stock markets, bond markets, commodities, and derivatives.
a. Stock Markets
Lower interest rates generally boost global stock indexes by:
Reducing discount rates used in valuation,
Increasing corporate borrowing capacity,
Encouraging investment in risk assets.
Conversely, rate hikes lead to global stock market corrections, especially in sectors sensitive to financing such as technology, real estate, and banking.
b. Bond Markets
Central banks influence:
Government bond yields,
Corporate bond spreads,
Global fixed-income returns.
When central banks signal future rate hikes, global bond yields rise, causing bond prices to fall.
c. Commodity Markets
Since many commodities are priced in dollars, the Federal Reserve’s monetary policy strongly affects global commodity cycles. A stronger dollar generally leads to weaker demand for commodities like oil, gold, and metals.
4. Inflation Control and Global Price Stability
Inflation dynamics in one major economy can spill over into global markets due to interconnected supply chains and energy markets.
a. Inflation Targeting
Most central banks aim to keep inflation around a target (usually 2%). When inflation rises, central banks:
Tighten monetary policy,
Reduce liquidity,
Increase borrowing costs globally.
This can slow global trade and investment.
b. Import and Export Inflation
A country’s inflation can be influenced by foreign price levels. For example:
Rising global oil prices cause inflation in energy-importing countries.
High U.S. inflation increases import costs for other countries.
Central bank responses to inflation therefore have global implications.
5. Financial Stability and Crisis Management
Central banks act as lenders of last resort during financial crises, helping prevent global contagion.
a. Liquidity Backstops
During crises, central banks inject emergency liquidity to stabilize markets. For example:
The Fed provides dollar swap lines to global central banks to prevent shortages of dollar liquidity.
The ECB creates special financing programs during European debt crises.
This helps avoid widespread defaults and maintains confidence in global finance.
b. Regulation and Macroprudential Policy
Central banks oversee:
Bank capital requirements,
Stress testing,
Systemic risk monitoring.
Stronger regulations in major economies (like Basel III norms) influence global banking practices.
6. Influence Through Forward Guidance
Modern central banks use communication as a policy tool.
a. Market Expectations
Central bank speeches, press releases, and meeting minutes shape expectations around future policy. Global financial markets react instantly to:
Hawkish statements (more tightening),
Dovish statements (more easing).
For example, a single speech by the Federal Reserve Chair can move stock markets, bond yields, and currencies worldwide.
b. Transparency and Credibility
Consistent communication enhances global confidence and reduces volatility. Uncertain or contradictory statements can cause major market swings.
7. Coordination Between Central Banks
Sometimes central banks coordinate policy actions to stabilize the global market.
a. Joint Rate Cuts
During the 2008 crisis, multiple central banks cut rates simultaneously to restore confidence.
b. Swap Lines
Currency swap lines ensure smooth functioning of global payment systems.
c. Global Regulatory Standards
Central banks collaborate through bodies like the Bank for International Settlements (BIS) to maintain financial stability.
8. Impact on Emerging Markets
Emerging markets are often the most affected by major central bank decisions.
a. Capital Flows
Tighter policy in the U.S. causes:
Outflows from emerging markets,
Weakening currencies,
Rising inflation and borrowing costs.
b. External Debt Burden
Many emerging markets have dollar-denominated debt. A stronger dollar increases repayment burdens.
c. Trade Impact
Fluctuations in exchange rates influence export competitiveness and trade balances.
Conclusion
Central banks play a decisive role in shaping the global economic and financial environment. Through interest rate decisions, liquidity management, currency policy, and crisis interventions, they influence everything from global stock markets and capital flows to trade balances and inflation levels. In an interconnected world, the decisions of major central banks have far-reaching implications not just domestically but across the entire global market. As the global economy becomes more integrated, the influence of central banks will continue to grow, making their policies a key factor for investors, businesses, and governments worldwide.
Global Financial Market and Its Structure1. What Is the Global Financial Market?
A financial market is any platform—physical or digital—where buyers and sellers come together to trade financial instruments such as stocks, bonds, currencies, commodities, and derivatives. When these platforms operate across borders and connect economies worldwide, they form the global financial market.
This global market works on two core principles:
A. Free Flow of Capital
Money can move from one country to another seeking higher returns, lower risk, or better opportunities.
B. Integration of Economies
Events in one market can quickly impact others. For example, a rate hike by the US Federal Reserve affects currencies, stock markets, bond yields, and commodity prices around the world.
2. Why Does the Global Financial Market Exist?
The global market exists to serve four essential purposes:
1. Capital Allocation
Countries and companies need money to build infrastructure, expand business, and fund innovation. Investors need profitable places to put their money. The global market connects them.
2. Liquidity
It provides a place to buy and sell assets easily, ensuring that investors can enter or exit trades without major delays.
3. Risk Management
Through derivatives, hedging tools, and diversified global portfolios, investors can protect themselves from currency risk, interest rate risk, and geopolitical risk.
4. Price Discovery
It helps decide fair value of assets—such as currency rates, gold prices, or stock valuations—based on demand and supply.
3. Structure of the Global Financial Market
The global financial market can be divided into five major segments:
Capital Markets
Money Markets
Foreign Exchange (Forex) Markets
Commodity Markets
Derivatives Markets
Together, they form the complete structure.
A. Capital Markets (Stocks and Bonds)
Capital markets are where businesses and governments raise long-term funds. They are divided into:
1. Equity Markets (Stock Markets)
Companies issue shares to raise money. Investors buy these shares to earn returns through price appreciation and dividends.
Examples:
New York Stock Exchange (NYSE), NASDAQ, London Stock Exchange, Bombay Stock Exchange (BSE), National Stock Exchange (NSE).
Role in global finance:
Helps companies scale globally
Attracts foreign portfolio investors (FPI/FII)
Indicates economic health of a country
2. Debt Markets (Bond Markets)
Governments and corporations borrow money by issuing bonds. Investors earn interest in return.
Types of bonds:
Government bonds (US Treasuries, Indian G-Secs)
Corporate bonds
Municipal bonds
The bond market is actually bigger than the global equity market and heavily influences global interest rates and currency values.
B. Money Markets
Money markets deal with short-term borrowing and lending, typically less than one year. These markets support daily liquidity needs of financial institutions.
Instruments include:
Treasury bills
Commercial paper
Certificates of deposit
Interbank lending
Role:
Money markets ensure stability in the banking system. They act like the “blood circulation system” of global finance, maintaining smooth functioning of cash flows.
C. Foreign Exchange Market (Forex)
The forex market is the world’s largest financial market with over $7 trillion traded per day. It is a fully decentralized, 24-hour market connecting banks, institutions, governments, and traders.
Why Forex is Important:
Determines exchange rates
Supports global trade
Hedges currency risk
Enables cross-border investments
Currencies move due to:
Interest rate changes
Political events
Economic data (GDP, unemployment)
Speculation
Central bank interventions
Forex influences everything—from import/export prices to foreign travel, to inflation in a country.
D. Commodity Markets
Commodity markets allow trading of raw materials such as:
Energy: crude oil, natural gas
Metals: gold, silver, copper
Agriculture: wheat, coffee, sugar
These markets function in two formats:
1. Spot Markets
Immediate delivery of commodities.
2. Futures Markets
Contracts based on future delivery, widely used for hedging.
Commodity markets are heavily influenced by:
Geopolitics
Supply chain disruptions
OPEC policies
Weather conditions
Global demand cycles
Gold and oil are the two most influential commodities globally.
E. Derivatives Market
Derivatives are financial contracts whose value comes from underlying assets such as stocks, currencies, bonds, or commodities.
Common derivatives:
Futures
Options
Swaps
Forward contracts
Why derivatives matter:
Hedge risks (currency risk, interest rate risk)
Enable leverage
Increase liquidity
Allow complex trading strategies
Global derivative markets are massive, running into hundreds of trillions in notional value.
4. Key Participants in the Global Financial Market
The global market functions because of several major players:
1. Central Banks
Federal Reserve (USA), ECB, Bank of Japan, RBI etc.
They control interest rates, regulate liquidity, and manage currency stability.
2. Banks and Financial Institutions
Provide loans, trading services, market-making, and clearing operations.
3. Institutional Investors
Pension funds
Hedge funds
Mutual funds
Sovereign wealth funds
They move large volumes of capital globally.
4. Corporations
Raise funds, hedge forex exposures, and engage in cross-border trade.
5. Retail Traders/Investors
Participate in stocks, forex, crypto, and commodities.
6. Governments
Issue debt, regulate markets, and manage economic policies.
5. How Global Financial Markets Are Connected
An event in one part of the world can have global ripple effects.
Examples:
A US interest rate hike strengthens the dollar and weakens emerging market currencies.
Oil supply cuts by OPEC raise global inflation.
A banking crisis in Europe can shock global equity markets.
This interconnectedness increases efficiency but also increases vulnerabilities.
6. Technology and Global Markets
Technology has completely transformed global markets:
High-frequency trading
Algorithmic trading
Digital payment systems
Blockchain and cryptocurrencies
Online brokerage and investment apps
Today, markets operate round-the-clock, and information travels instantly.
7. Risks in the Global Financial Market
While global markets create opportunities, they also carry risks:
Liquidity risk
Interest rate risk
Currency volatility
Political instability
Systemic banking failures
Market bubbles and crashes
Proper regulation and risk management are essential to maintain stability.
Conclusion
The global financial market is a powerful and complex system that drives economic growth, trade, and investment across nations. It is structured into several interconnected segments—capital markets, money markets, forex markets, commodity markets, and derivatives markets. Each plays a unique role in ensuring smooth movement of money, efficient price discovery, risk management, and global economic coordination.
In an increasingly interconnected world, understanding the structure of global financial markets is essential for traders, investors, policymakers, and anyone seeking to make informed financial decisions.
US Federal Reserve Policies and Interest Rates1. What Is the Federal Reserve and Why It Matters
The Federal Reserve is the central bank of the United States. Its primary job is to keep the economy stable by managing:
Inflation
Employment levels
Financial system stability
Smooth flow of money and credit
The Fed does not directly control the stock market, but its decisions influence borrowing costs, business investment, consumer spending, and asset valuations—which indirectly affect everything from Nifty and Sensex to global commodities and currencies.
2. The Fed’s Dual Mandate
Unlike some central banks that target only inflation, the Fed follows a dual mandate:
(1) Price Stability
Keeping inflation around 2% over time.
Low, predictable inflation ensures households and businesses can plan confidently.
(2) Maximum Employment
Ensuring strong job creation without overheating the economy.
A healthy labor market keeps consumers spending, which drives growth.
Balancing these two goals is the core challenge of policymaking.
3. The Federal Funds Rate — The Heartbeat of US Monetary Policy
The most important tool the Fed uses is the federal funds rate, often referred to simply as the interest rate.
This rate is:
The cost at which banks lend money to each other overnight.
The base rate that affects all borrowing costs, from home loans to corporate credit.
A benchmark for global financial markets.
When the Fed raises rates, borrowing becomes expensive.
When the Fed cuts rates, borrowing becomes cheap.
This simple mechanism drives major economic cycles.
4. How Raising or Cutting Interest Rates Affects the Economy
When the Fed Raises Rates
The objective is to slow down inflation, which usually occurs when the economy is overheating.
Effects:
Loan EMIs increase (US households borrow heavily).
Business investment becomes costlier.
Stock markets typically correct due to higher discount rates.
Bond yields rise.
US dollar strengthens (higher yields attract foreign capital).
Imports become cheaper, exports weaker.
This tightening reduces excess demand, cooling inflation gradually.
When the Fed Cuts Rates
The objective is to boost growth during slowdown or recession.
Effects:
Loans become cheaper—consumer spending rises.
Businesses invest more.
Stock markets rally as liquidity flows increase.
Bond yields fall.
US dollar weakens (capital flows to emerging markets).
Lower rates stimulate demand and revive economic activity.
5. Tools the Federal Reserve Uses Beyond Interest Rates
Interest rates are the primary tool, but not the only one. The Fed also uses:
1. Open Market Operations (OMO)
Buying or selling US Treasury securities in the market.
Fed buys bonds → injects liquidity → rates fall.
Fed sells bonds → withdraws liquidity → rates rise.
OMO is used daily to maintain the federal funds rate.
2. Quantitative Easing (QE)
Large-scale bond buying in financial crises.
QE is like adding steroids to liquidity—used during 2008 and COVID-19.
Effects:
Floods markets with money.
Pushes interest rates toward zero.
Boosts stock and bond markets.
Weakens the US dollar.
Supports economic recovery.
3. Quantitative Tightening (QT)
Opposite of QE.
Fed reduces its balance sheet by selling bonds or letting them mature.
Effects:
Liquidity drains from markets.
Bond yields rise.
Risk assets often correct.
QT is like removing support wheels from the economy.
4. Forward Guidance
Fed communicates its future policy direction to shape expectations.
Clear communication reduces market volatility.
6. Why Inflation Drives Fed Policy Decisions
Inflation is the Fed’s biggest enemy.
If inflation is too high:
Purchasing power falls.
Savings lose value.
Wage demands rise.
Economy overheats.
Markets turn unstable.
If inflation is too low:
Deflation risks emerge.
Businesses delay investment.
Consumers delay purchases.
Economic stagnation starts.
Thus, the 2% inflation goal balances price stability and growth.
7. How the Fed Studies the Economy Before Making Decisions
Before each rate decision, the Fed analyzes:
CPI inflation data
Core PCE inflation (Fed’s preferred measure)
Unemployment rate
Wage growth
GDP growth
Consumer spending
Manufacturing numbers
Global risks (oil prices, wars, trade tensions)
The Fed also uses the Dot Plot—internal projections of future interest rates by each FOMC member.
8. How Fed Rate Decisions Impact Global Markets
The Federal Reserve is the central bank of the world because the US dollar is the global reserve currency and US Treasury bonds are the safest asset.
When the Fed Hikes Rates
Foreign investors move money to the US.
Emerging markets (India, Brazil, Indonesia) face currency pressure.
FIIs reduce equity allocations in EMs.
Crude oil often becomes volatile.
Gold prices fall (because bonds become more attractive).
Global stock markets weaken.
When the Fed Cuts Rates
Money flows out of the US into emerging markets.
Nifty and Sensex often rally.
Dollar weakens; emerging currencies strengthen.
Commodity markets, especially gold, energy, and metals, rise.
Bond markets rally globally.
Thus, every Fed statement becomes a market-moving event.
9. Why the Fed Moves Slowly and Carefully
The Fed knows that aggressive rate moves can trigger:
Recession
Financial instability
Bank failures (like in 2023 regional bank crisis)
Market crashes
Global contagion
So it moves gradually, using communication to guide markets.
10. Understanding the FOMC — The Fed’s Decision-Making Body
The Federal Open Market Committee (FOMC) meets 8 times a year.
Members include:
7 Federal Reserve Board Governors
5 regional Fed Bank presidents
They vote on:
Interest rate changes
Liquidity policies
Economic outlook
After each meeting, they release the:
Rate decision
Economic projections
Statement
Press conference (by the Fed Chair)
This communication dramatically impacts global sentiment.
11. Key Indicators Traders Watch During Fed Events
Professional traders monitor:
Dot Plot
CME FedWatch Tool (rate probability)
Bond yield curve shape
Real yield movements
US Dollar Index (DXY)
Gold and crude reactions
S&P 500 volatility
These indicators help predict the market’s interpretation of Fed policy.
12. The Role of the Fed Chair
The Fed Chair is the most influential economic voice worldwide.
He/she’s responsible for:
Guiding monetary policy
Communicating to the public
Managing crises
Ensuring market confidence
Market reactions often depend not only on the rate decision but also on how the Chair explains it.
13. Why Interest Rates Will Always Matter
Interest rates define the cost of money.
They guide everything from:
Mortgage payments
Consumer loans
Corporate borrowing
Stock valuations
Government debt servicing
Startup funding
Currency flows
Commodity pricing
A single 0.25% Fed rate move can create billions in capital shifts globally.
Conclusion
The Federal Reserve’s policies and interest-rate decisions form the backbone of global macroeconomics. Understanding them helps traders anticipate liquidity cycles, market trends, and risk appetite across asset classes.
When the Fed tightens, markets feel the pressure.
When the Fed eases, liquidity flows and risk assets thrive.
For any trader or investor, mastering Fed policy is like mastering the steering wheel of the global economy.
Green Energy Trading🔋 1. What is Green Energy Trading?
Green energy trading involves a system where renewable electricity is produced, tracked, valued, and sold. Unlike traditional energy trading, green energy trading requires verifying that the electricity comes from renewable sources. This is done through certificates, audits, and digital tracking systems.
In simple terms:
A solar or wind plant generates electricity.
That electricity is sent into the grid.
A certificate is issued verifying that this electricity came from renewable resources.
Traders, companies, or utilities buy this certificate or the actual power to meet sustainability goals or sell further in the market.
This creates a transparent pipeline where clean power can be monetized and traded like any commodity.
🔄 2. Key Components of Green Energy Trading
(A) Renewable Energy Certificates (RECs)
One of the most important trading instruments.
A REC represents proof that 1 megawatt-hour (MWh) of electricity was produced from a renewable source.
There are two main types of RECs:
Solar RECs (S-RECs) – generated from solar projects
Non-Solar RECs (N-SRECs) – generated from wind, hydro, biomass, etc.
Corporates and institutions buy RECs to meet renewable purchase obligations (RPOs) or sustainability targets.
(B) Green Power Exchanges
Countries now have dedicated trading markets for renewable energy. For example:
India operates green energy segments on IEX and PXIL.
Europe trades green power on EPEX, Nord Pool, and others.
At these exchanges, renewable energy is bought and sold through:
Day-ahead markets
Term-ahead markets
Real-time markets
Green day-ahead markets (GDAM)
Green term-ahead markets (GTAM)
This ensures transparent price discovery and fair competition.
(C) Power Purchase Agreements (PPAs)
A PPA is a long-term contract between a green power generator and a buyer.
Large companies like Google, Amazon, Meta, Reliance, and Tata Steel use PPAs to directly procure renewable energy at fixed prices for many years.
This helps companies reduce electricity cost volatility and carbon footprint.
(D) Carbon Credits & Emission Trading
Although not the same as green energy trading, carbon credit trading supports the green energy ecosystem.
Every ton of CO₂ emission reduced can be converted into a credit and sold to polluting industries.
This system incentivizes renewable projects financially.
⚙️ 3. How Green Energy Trading Works (Step-by-Step)
Step 1: Generation
A renewable energy plant (solar park, wind farm, hydro station) produces electricity and injects it into the power grid.
Step 2: Certification
An agency verifies the energy source and issues RECs or other green certificates.
Step 3: Listing on Exchanges
Producers list their green power or certificates on:
Indian Energy Exchange (IEX)
Power Exchange India Limited (PXIL)
European or American energy markets
Step 4: Bidding & Trading
Buyers such as:
Utility companies
Industries
Corporates
Traders
Distribution companies (DISCOMs)
place bids to purchase renewable energy or certificates.
Step 5: Settlement
Traded units are delivered based on contract type — real-time, day-ahead, or long-term.
🧩 4. Why Green Energy Trading Is Growing
(A) Climate Change Awareness
Countries have committed to reducing carbon emissions under the Paris Agreement.
Green energy trading supports clean energy targets.
(B) Corporate Sustainability (ESG Goals)
Companies now have strict Environmental, Social, and Governance reporting mandates.
Purchasing green energy helps them meet ESG scores.
(C) Falling Renewable Energy Costs
Solar and wind generation costs have dropped drastically in the past decade.
This makes green energy competitive with fossil-based electricity.
(D) Government Regulations
Governments worldwide mandate renewable purchase obligations (RPOs).
Industries must buy a certain percentage of energy from renewable sources.
📉 5. Price Dynamics in Green Energy Trading
Green energy prices depend on:
Seasonal variations (wind peaks in monsoon, solar peaks in summer)
Grid congestion
Demand–supply imbalances
Policy changes
REC market demand
Fuel costs for backup systems
In markets like India, green prices sometimes fall below conventional electricity prices due to oversupply during peak renewable generation hours.
📈 6. Opportunities for Traders
Green energy markets offer multiple trading opportunities:
(A) Volatility-Based Trading
Prices fluctuate across day-ahead, real-time, and intraday markets.
(B) Arbitrage Opportunities
Traders capitalize on:
Time-based price difference
Region-based differences
Certificate value fluctuations
(C) PPA Trading
Some economies allow secondary trading of PPAs.
(D) REC Speculation
RECs can be bought low and sold high as demand increases.
🏭 7. Opportunities for Businesses
Industries Benefit Through:
Lower energy costs
Reduced carbon footprint
Compliance with RPO
Long-term price stability via PPAs
Improved corporate sustainability ratings
Many companies adopt green energy to reduce electricity bills by 20–40%.
🌍 8. Global Growth of Green Energy Trading
Countries leading the growth are:
India
Germany
USA
China
UK
Nordic countries
India’s green day-ahead market (GDAM) and green term-ahead market (GTAM) are among the fastest-growing segments in the energy space.
🤖 9. Digital Transformation in Green Energy Trading
Modern green energy trading uses:
AI-based forecasting
Blockchain for energy certificates
IoT-based smart meters
Cloud-based energy management systems
Virtual power plants (VPPs)
Blockchain ensures transparency, preventing fraud in RECs and PPAs.
🔮 10. Future of Green Energy Trading
(A) Green Hydrogen Trading
Hydrogen produced using renewable energy will form a major trading market.
(B) Battery Energy Storage (BESS) Integration
Stored renewable energy will be traded during peak demand.
(C) Peer-to-Peer Energy Trading
Consumers will directly buy and sell energy through digital platforms.
(D) Carbon-Free 24/7 Markets
Companies will match energy consumption with renewable generation every hour.
🧠 Conclusion
Green energy trading is transforming the global energy landscape. It enables renewable energy producers to monetize their power, provides companies a way to meet sustainability goals, and offers traders new opportunities through certificates, markets, and contracts. As renewable energy grows, green energy trading will continue to expand, becoming one of the most important components of the future energy economy.

Global Bonds Trading1. What Are Global Bonds?
A bond is essentially a loan given by an investor to a borrower (the issuer). In return, the issuer promises to pay:
a fixed or variable interest rate (coupon)
the principal amount (face value) at maturity
Global bonds are simply bonds issued or traded across international markets. They include:
Sovereign bonds: Issued by national governments
Corporate bonds: Issued by private or public companies
Supranational bonds: Issued by global institutions like the World Bank
Municipal bonds: Issued by regional and local governments
Emerging market bonds: Issued by developing economies
These instruments are traded globally, often denominated in major currencies such as USD, EUR, GBP, or JPY.
2. Importance of the Global Bond Market
The global bond market is enormous—much larger than the global stock market. It is central to:
Funding Economies
Governments finance fiscal deficits, infrastructure, and social programs using bonds. Corporations issue bonds to expand operations, conduct mergers, or refinance debt.
Maintaining Financial Stability
Bond yields act as barometers of economic health. Rising yields indicate tightening financial conditions, while falling yields suggest risk aversion or economic slowdown.
Asset Allocation and Portfolio Diversification
Investors use bonds for steady income, reduced volatility, and hedging against equity risks.
Determining Interest Rates
Government bond yields influence:
mortgage rates
corporate borrowing costs
bank lending rates
currency valuations
Thus, global bond trading has direct macroeconomic consequences.
3. Major Players in Global Bond Trading
The global bond market operates through a diverse set of participants:
1. Central Banks
They are among the largest buyers and sellers of bonds. Through bond market operations, central banks control liquidity and interest rates.
Quantitative easing (QE) programs—massive bond purchases—have drastically shaped global yields in recent decades.
2. Institutional Investors
These include:
pension funds
insurance companies
mutual funds
sovereign wealth funds
hedge funds
They trade bonds in large volumes to meet financial obligations or generate yield.
3. Governments
They issue sovereign bonds and are deeply involved in primary auctions and debt management.
4. Investment Banks and Brokers
They facilitate trading through:
market-making
underwriting
providing liquidity
offering research and analytics
5. Retail Investors
Although smaller in volume, they access bond markets through ETFs, mutual funds, or direct purchases.
4. Types of Bonds in Global Markets
1. Government Bonds
Examples include:
U.S. Treasuries
UK Gilts
German Bunds
Japanese Government Bonds (JGBs)
These are considered low-risk and are benchmarks for global interest rates.
2. Corporate Bonds
Issued by companies—categorized as:
Investment-grade bonds (stable companies, lower risk)
High-yield or junk bonds (riskier companies, higher return)
3. Emerging Market Bonds
Issued by developing nations or their corporations. They offer high yields but come with political and currency risks.
4. Municipal Bonds
Issued by states or municipalities, often with tax advantages.
5. Supranational Bonds
Issued by global institutions like IMF, ADB, or EBRD to fund development programs.
5. How Global Bond Trading Works
Global bonds trade primarily in two markets:
1. Primary Market (Issuance Stage)
Bonds are sold directly by the issuer to investors through:
auctions
private placements
syndicate underwritings
In this stage, the interest rate (coupon) and issue price are determined.
2. Secondary Market (Trading Stage)
This is where existing bonds are bought and sold. It is mostly over-the-counter (OTC), meaning trades occur through dealers rather than centralized exchanges.
Secondary markets allow investors to:
adjust portfolios
manage risk
respond to interest rate changes
speculate on price movements
6. What Drives Bond Prices in Global Markets
Bond prices fluctuate based on several key factors:
1. Interest Rates
Bond prices move inversely to interest rates.
If rates rise → existing bond prices fall.
If rates fall → bond prices rise.
2. Inflation
High inflation erodes fixed-income value, pushing yields higher.
3. Credit Risk
For corporate or emerging market bonds, credit rating changes strongly affect prices.
4. Economic Data
Indicators such as GDP growth, employment, and manufacturing output drive rate expectations.
5. Geopolitical Events
War, elections, and trade tensions can influence bond yields, especially for emerging markets.
6. Currency Movements
Investors in global bonds must consider exchange rate risks. For example, a U.S. investor buying bonds in Europe could gain from bond appreciation but lose due to euro depreciation.
7. Trading Strategies in Global Bond Markets
1. Yield Curve Trading
Investors position portfolios along the yield curve depending on interest rate expectations—short-term, medium-term, or long-term maturities.
2. Carry Trade
Borrowing in a low-yielding currency (like JPY) to buy high-yield bonds in other markets.
3. Relative Value Trading
Taking advantage of mispricing between similar bonds.
4. Duration Management
Adjusting sensitivity to interest rate changes by shortening or lengthening bond maturity exposure.
5. Credit Spread Trading
Speculating on the widening or narrowing of yield spreads between high-risk and low-risk bonds.
8. Risks in Global Bond Trading
While bonds are often considered safer than equities, global bond trading carries significant risks:
1. Interest Rate Risk
A rise in interest rates reduces bond prices.
2. Currency Risk
Global bonds denominated in foreign currency may lose value due to exchange fluctuations.
3. Credit Risk
Default by corporate or sovereign issuers.
4. Liquidity Risk
Some bonds, especially emerging market or high-yield bonds, may not have active buyers.
5. Political and Geopolitical Risk
Government instability or regulatory changes can sharply impact yields.
6. Inflation Risk
High inflation reduces real return on fixed coupons.
9. The Future of Global Bond Markets
Several trends are shaping the future:
1. Rise of Green and Sustainable Bonds
Climate-focused financing is driving record issuance in green, social, and sustainability-linked bonds.
2. Technological Transformation
Electronic bond trading platforms and AI-driven analytics are enhancing liquidity and transparency.
3. Shifting Monetary Policies
With inflation cycles frequently changing, bond markets face increased volatility.
4. Growing Role of Emerging Markets
Countries like India, Brazil, South Africa, and Indonesia are deepening their bond markets, attracting global investors.
Conclusion
Global bond trading is a cornerstone of modern finance, influencing economic activity, capital allocation, and financial stability. As the world becomes more interconnected, the bond market continues evolving with new instruments, digital platforms, sustainable financing trends, and shifting macroeconomic conditions. Understanding how global bonds function—along with their risks, pricing dynamics, and trading strategies—offers valuable insight into the heartbeat of the global financial system.

High-Frequency Trading (HFT) in Exploiting Time Zone GapsIntroduction
High-Frequency Trading (HFT) has transformed global financial markets by introducing ultra-fast algorithmic strategies that execute thousands of trades in microseconds. With advancements in technology, fiber optics, and low-latency infrastructure, HFT firms continuously search for even the smallest market inefficiencies. One of the lesser-known but increasingly significant strategies in HFT is the exploitation of time zone gaps—leveraging differences in trading hours across global markets to gain arbitrage opportunities.
As global financial systems operate around the clock, markets in Asia, Europe, and North America function in different time zones. This asynchronous operation creates brief windows—known as time zone gaps—where information, price movements, or sentiment from one region can be exploited before it fully reflects in another. HFT algorithms capitalize on these moments to generate profit, often within fractions of a second.
Understanding Time Zone Gaps
Time zone gaps arise because not all markets operate simultaneously. For example:
Asian markets (like Tokyo, Hong Kong, or Singapore) open first.
European markets (like London or Frankfurt) open after Asia closes.
North American markets (like New York or Toronto) open last.
Between these openings and closings, there exist periods of overlap (such as the London-New York overlap) and non-overlap windows, when one region’s market reacts to information while another remains closed. These non-overlap periods create price differentials—temporary inefficiencies in related assets, currencies, or commodities.
For instance, if U.S. stocks close higher due to strong tech earnings, Asian futures or ETFs linked to the same companies might open higher the next morning. HFT systems exploit these predictable movements during the microseconds after Asian markets open, before manual traders can respond.
Mechanism of Exploitation
HFT firms deploy advanced cross-market arbitrage algorithms to identify and act on price discrepancies caused by time zone differences. The process generally follows these steps:
Global Data Synchronization
HFT systems continuously monitor data feeds from exchanges worldwide. They record closing prices, index movements, commodity futures, and currency pairs.
Predictive Modeling
Algorithms use machine learning and statistical models to predict how an asset in one market should move when another related market opens. For example, if the S&P 500 rises by 2% overnight, the Nikkei 225 futures might be expected to rise proportionally.
Latency Arbitrage Execution
The key lies in speed. HFT systems execute trades the instant a market opens—often milliseconds before conventional traders—taking positions in stocks, ETFs, or derivatives that are likely to adjust based on global cues.
Market Neutral Positions
These trades are often market neutral, meaning they do not depend on overall market direction. Instead, they rely on capturing the small, temporary mispricing between two correlated assets across time zones.
Exit Strategy
Once the market adjusts (usually within seconds or minutes), HFT systems exit positions, locking in profits from the price convergence.
Examples of Time Zone Arbitrage
Equity Index Futures
Consider futures contracts on the Nikkei 225 and S&P 500. When the U.S. market closes with a strong rally, HFT systems anticipate that Japanese futures will open higher. They buy Nikkei futures moments before the Tokyo Stock Exchange opens, profiting from the predictable uptick.
Currency Pairs (FX Market)
Although the forex market operates 24/5, liquidity fluctuates with regional business hours. HFTs exploit cross-currency correlations—for example, between USD/JPY and EUR/USD—when one region’s liquidity dries up, creating a slight pricing lag before another market compensates.
Commodity Markets
Oil or gold futures traded in New York often influence Asian commodity prices the next morning. HFT algorithms scan U.S. closing data and place instant orders on Asian commodity exchanges at open, capitalizing on the delayed reaction.
ETF vs. Underlying Asset Arbitrage
Exchange-Traded Funds (ETFs) that track international markets (like “iShares MSCI Japan ETF” listed in New York) can diverge from their underlying asset prices when the foreign market is closed. HFT systems arbitrage these gaps as soon as the foreign market reopens.
Technological Infrastructure Behind HFT
To exploit time zone gaps effectively, HFT firms invest heavily in technology, as speed and precision are critical. Key components include:
Low-Latency Networks: Fiber-optic or microwave communication links that transmit data across continents in milliseconds.
Co-Location Services: Placing servers physically close to exchange data centers to reduce transmission delay.
Predictive Algorithms: AI and machine learning models trained on years of cross-market data to forecast short-term movements.
Real-Time Analytics: Systems capable of processing terabytes of financial data per second for instant decision-making.
Smart Order Routing (SOR): Algorithms that determine the optimal exchange and timing for order execution across markets.
Advantages of Exploiting Time Zone Gaps
Arbitrage Efficiency – Profiting from predictable market reactions without directional risk.
Liquidity Provision – HFT often adds liquidity to markets during low-volume periods.
Price Discovery – By quickly integrating global information, HFT helps align asset prices across time zones.
Diversification of Opportunities – Allows firms to operate continuously, taking advantage of 24-hour trading across the globe.
Challenges and Risks
While profitable, exploiting time zone gaps comes with significant risks and operational hurdles:
Technological Costs
The infrastructure required for global, low-latency trading is extremely expensive. Only large institutions can afford these systems.
Regulatory Scrutiny
Different regions have different trading regulations. Ensuring compliance across jurisdictions (e.g., the U.S. SEC vs. Japan’s FSA) is complex and risky.
Market Fragmentation
Data synchronization across multiple time zones can lead to inaccuracies due to latency or bandwidth issues, resulting in potential trading losses.
Competition
As more HFTs target the same inefficiencies, profit margins shrink rapidly. The competition becomes a “race to zero” in terms of latency.
Flash Crashes and Instability
Rapid algorithmic trading across interconnected markets can amplify volatility. A shock in one market can instantly ripple across others, causing flash crashes.
Regulatory and Ethical Considerations
Global regulators have expressed concern that exploiting time zone gaps might create unfair advantages for technologically advanced firms. Critics argue that HFTs manipulate speed rather than true economic value. To address this, some exchanges have introduced speed bumps or randomized order delays to reduce the impact of latency-based strategies.
Moreover, cross-border coordination is limited. Without harmonized regulation, firms can operate in regulatory “gray zones,” exploiting markets with weaker oversight. This has led to ongoing debates about transparency, fairness, and market stability.
The Future of HFT in Global Time Zone Trading
The evolution of global markets suggests that HFT will continue to refine time zone gap strategies. Key future trends include:
AI-Powered Prediction Models: Advanced neural networks will better anticipate inter-market reactions, making time zone exploitation even more precise.
Quantum Computing: Future breakthroughs in computational speed could make latency arbitrage almost instantaneous.
24/7 Trading Models: As more markets (like cryptocurrencies) adopt round-the-clock trading, traditional time zone gaps may shrink, pushing HFTs to adapt.
Regulatory Convergence: International cooperation could create unified frameworks, balancing innovation with market integrity.
Conclusion
High-Frequency Trading’s ability to exploit time zone gaps showcases how technology, data, and speed converge in modern finance. By leveraging global time differences, HFT firms transform tiny inefficiencies into consistent profits. While such strategies enhance liquidity and price discovery, they also raise concerns about market fairness, systemic risk, and unequal access to technology.
In essence, exploiting time zone gaps represents both the brilliance and the fragility of today’s interconnected markets—a reflection of how milliseconds can define success in a 24-hour global trading ecosystem.
BTC M2 LAG📊 Overview
This chart visualizes the Lapse Legacy Fund System, a composite model integrating global liquidity metrics, macro-technical conditions, and the Hedge Fund Statistical Aggregate Index.
Each component quantifies institutional bias, volatility compression, and rate-of-change dynamics to form an adaptive probabilistic signal engine.
The system currently shows a synchronized SELL/SHORT bias across all analytical layers but we see M2 in an uptrend:
Technical Layer: -1.00 → Structural weakness within intermediate trend fractals.
Higher-TF Technical: 0.00 → Neutral higher timeframe bias, suggesting consolidation rather than acceleration.
Macro-Economic: -1.00 → Liquidity contraction and cyclical drawdown in aggregate liquidity flows.
Overall Signal: -0.67 → Weighted net bearish tilt in global risk appetite.
🧩 Interpretation
Price Structure:
Bitcoin’s price remains elevated within a mid-term distribution range following a strong parabolic advance. While the broader structure has not yet broken down, the series of lower highs on the Statistical Aggregate Index indicates declining momentum efficiency.
Global Liquidity Correlation:
The cyan and green overlays represent global liquidity curves. Historically, these lead Bitcoin by several weeks. The recent flattening in liquidity expansion hints at a potential stall phase or short-term correction window before further trending action.
System Dashboard Readout:
The composite system dashboard below the chart registers synchronized red zones across technical and macroeconomic components. Such multi-layer agreement historically precedes retracement events or trend rotations of varying magnitude.
Equity Curve (Strategy Performance):
Despite short-term volatility, the system’s equity line remains positive with a Profit Factor of 5.47 and Omega Ratio of 1.57, supporting the reliability of the signal environment.
📈 Scenario-Based Outlook
Bearish Scenario (Primary Probability):
If the macro-statistical score remains negative and liquidity stagnates, BTC may revisit support around the $89K–$94K zone before re-establishing directional clarity. This would align with prior cyclical liquidity drawdowns.
Bullish Reversal Scenario:
A decisive re-expansion in liquidity (green curve continuation) combined with an Aggregate Index rebound above zero would signal renewed institutional inflows, potentially re-targeting the $120K–$130K region.
Neutral Range Case:
If the system signals stay near zero, expect sideways mean reversion between $95K–$110K, acting as a volatility compression stage before the next macro-impulse.
🧭 Strategic Insight
This model doesn’t forecast price directly—it quantifies systemic conditions driving capital flows. When the Aggregate Index, Technical, and Macro-Economic layers align, it often precedes sustained moves.
The next directional pivot will likely be defined by liquidity regime changes rather than short-term sentiment.
🧩 Summary
“The Hedge Fund Statistical Aggregate Index currently signals systemic tightening and weakening trend persistence.
A temporary liquidity stall could prompt corrective action before macro liquidity expansion resumes.”

$BTC / Global Liquidity Acceleration with Business Cycle Today’s PA confirmed an interesting theory I’ve had where liquidity reaches risk assets faster as the business cycle picks up.
I wrote about this in depth in my “Twin Peaks” cycle top thesis (pinned tweet).
We were charting Total Global Liquidity with a 12-week lead against CRYPTOCAP:BTC before the rate cut in September, and then we got a 1-point higher reading in the ISM PMI, which I believe accelerated the liquidity cycle by a couple weeks.
I think for every 25 bps rate cut, we will see TGL accelerate by 2-weeks.
The next rate cut is expected at the October 29th FOMC.
It will be interesting to track liquidity flows and the ISM PMI after the next rate cut to see how they adapt to markets.
The GOLD / BTC chart confirms this acceleration, as GOLD typically has a near 1:1 ratio with TGL.
I was one of the first analysts to point out this signal earlier in year before all your favorite large accounts ran with it (go figure).
This acceleration in TGL would mark our local bottom near perfectly.
If this theory is correct and liquidity does accelerate by another 2 weeks, based on TGL, we would have the cycle’s first top somewhere around November 11th.
Currently it’s the 25th with a 10-week lead.
That would coincide with my OG ₿itcoin cycle analysis that I put out over 1.5 years ago, where I said the cycle top would be between OCTOBER 6th, which was already a local top, and NOVEMBER 9th.
However, there is a discrepancy with the GOLD / BTC chart. The local top would be around December 3rd. It’s currently the 17th with a 10-week lead.
I think GOLD has overshot TGL simply based on bull market mechanics creating a parabola.
To sum it up, stay vigilant over these next few months, and take nothing for granted.
The first peak will for sure come sooner than you think.
Going to be fascinating to follow these liquidity flows, at the very least.

$BTC Double Top - Business Cycle & Global Liquidity Analysis TWIN PEAKS 🎄🌲
How the Business Cycle Supercharges Liquidity (and Crushes Cycles
Many of you may remember my BTC cycle thesis I wrote ~1.5 years ago. It was based solely on technical analysis covering previous cycles and did not take into account macro conditions such as global liquidity and the business cycle.
While that has been a guiding light to get me to this point, after further macro analysis, my views have changed a bit.
Based on my technical analysis, a price target north of $200k remains for CRYPTOCAP:BTC , but I now believe we will see some sort of a DOUBLE TOP like we did in 2021; this time in mid-December 2025 and late-March / early April 2026.
The December 2025 top will fulfill the “4-Year Cycle prophecy” which has been fueled by the current boom in global liquidity.
Whereas the March / April 2026 top will come from a booming business cycle (measured by the ISM PMI); something we have yet to see.
As you can see in the 2017 and 2021 cycles, the business cycle cues Alt Season.
I don’t think we see a real one without it.
That’s where people spend the money they made through safer assets such as Gold > Stonks > ₿itcoin etc.
We saw Altcoins, NFTs, Sports Cards, Sneakers, Watches, Collectibles etc go parabolic during this time in 2021. And it just so happened that the market for a lot of these high-risk assets topped around that time.
Here's a link to a Michael Jordan rookie card in PSA 9 condition that peaked around February 2021 right before the business cycle topped.
www.psacard.com
I think Altcoins went on for a bit longer after the business cycle topped because they were native on-chain and had less friction to transact (crime season anyone?).
NFTs saw sustained speculation because of the novelty and innovation they were bringing to the space. NFTs should act more like traditional risk assets this time around, and top slightly after the business cycle.
THE FURTHER WE ARE IN THE BUSINESS CYCLE, THE FASTER LIQUIDITY REACHES RISK ASSETS.
Think about it… everyone and their mother are making a ton of money from a booming business cycle ie hairdressers, uber drivers, personal trainers etc and dumb money finds high-risk assets near instantly. We see this with an uptick in google searches, youtube views etc.
This is why global liquidity with a 10-12 week lead overshoots cycle tops in the past.
An immense amount of Global QE in 2021 created an outlier for a continued pump in liquidity, even after the business cycle topped.
Then in the bear market, liquidity deviates from risk assets again as money moves back to safe havens first such as GOLD, which is a near 1:1 injection, and we see ₿itcoin lag by 10-12 weeks.
We should continue to see large caps do well for the remainder of the year as money slowly rotates out of BTC into ETH, SOL, BNB etc, but small caps don’t start to outperform until the business cycle starts convincingly rising well above 50.
Alternative investments such as sports cards are starting to see a similar rotation. Michael Jordan is the ₿itcoin of sports cards, and many of his cards are well above 2021 all-time highs. Other high-end cards from GOATs such as Tom Brady, Mickey Mantle, Wayne Gretzky etc continue to shatter prior records.
NFTs are also starting to see a resurgence with high-end collections such as Crypto Punks, X-Copy etc.
I’m not completely sure if the first or second top will be higher for CRYPTOCAP:BTC yet, but I’m leaning towards the first one in December.
The aforementioned riskier assets should get the lion’s share of business cycle capital in March / April.
At this nexus we will see the Treasury General Account refill suck liquidity out of markets due to tax season. TGA refills have marked previous tops in 2017 and 2021, so I see no reason for this time to be different.
Yes, this will be a much shorter business cycle, which is caused by a historic amount of money printing during the pandemic. The outcome left the US economy in a high-inflation / high-interest rate environment.
The business cycle represents Main Street, and it is clear that the aftermath of the pandemic has crushed middle and lower income households.
~FIN~
JK
POST REFERENCES:
-The 4-Year Boom and Bust Cycle is by design
-Synchronized Bear Market Bottoms
-If you want to dive deeper into the current macro landscape, you should definitely read the playbook I wrote ~10 months ago. It’s been playing out near-perfectly.

Risk On/Off: How Global Correlations Tell You Money Flow🔵 Risk On / Risk Off: How Global Correlations Tell You Where Money Is Flowing
Difficulty: 🐳🐳🐳🐋🐋 (Intermediate+)
This article is for traders who want to understand how global capital flow affects market behavior — from equities and crypto to gold and bonds. Learning to read “Risk On” and “Risk Off” regimes helps you anticipate big shifts before they hit your chart.
🔵 INTRODUCTION
Markets are not independent islands — they are connected by one universal force: liquidity flow .
When investors feel confident, they move capital into riskier assets like stocks and crypto — this is called Risk On .
When fear dominates, capital flows back into safety — bonds, gold, and the U.S. dollar — known as Risk Off .
Recognizing this rotation allows traders to align their bias with the flow of global capital rather than fighting it.
🔵 WHAT IS “RISK ON”
Risk On is a market environment where investors seek higher returns, volatility is subdued, and capital flows into assets with greater reward potential.
Typical Risk-On behavior:
S&P 500, Nasdaq, and other equities trend higher
Bitcoin and crypto assets outperform traditional markets
U.S. Dollar Index (DXY) weakens as money moves abroad
Bond yields rise moderately as investors leave safe assets
Gold often consolidates or declines
In simple terms: Money chases opportunity.
🔵 WHAT IS “RISK OFF”
Risk Off describes defensive conditions — fear rises, volatility expands, and liquidity seeks safety.
Typical Risk-Off behavior:
S&P 500 and risk assets decline
Bitcoin and altcoins drop sharply
DXY strengthens as investors move into USD
Bond yields fall as money enters treasuries
Gold rallies as a safe-haven hedge
In simple terms: Money runs to safety.
🔵 HOW TO DETECT RISK SHIFTS
Market regimes don’t flip instantly — they rotate through correlated behavior.
To identify the shift between Risk On and Risk Off, monitor key macro instruments together:
DXY (Dollar Index): Rising DXY = Risk Off sentiment, Falling DXY = Risk On.
SPX / NASDAQ: Strong uptrends = Risk On, persistent weakness = Risk Off.
BTC vs DXY: Inverse correlation; BTC strength with DXY weakness = liquidity expansion.
Bond Yields (US10Y): Rising = optimism, Falling = risk aversion.
VIX Index: Below 15 = complacent Risk On, Above 25 = fearful Risk Off.
🔵 THE GLOBAL LIQUIDITY CYCLE
Liquidity always moves in phases — expansion, acceleration, contraction, and reset.
Phase 1 – Liquidity Expansion: Central banks inject liquidity → Risk On begins.
Phase 2 – Overextension: Assets rally strongly, leverage increases, volatility stays low.
Phase 3 – Liquidity Contraction: Monetary tightening or policy shocks trigger Risk Off.
Phase 4 – Repricing & Reset: Markets bottom as new liquidity returns.
Understanding this rhythm helps traders avoid confusion when markets seem “irrational” — because they’re not, they’re simply rotating through the liquidity cycle.
🔵 USING RISK ON/OFF IN TRADING
Even technical traders benefit from recognizing global risk regimes.
By aligning with the dominant liquidity direction, setups gain higher probability.
Crypto traders: Use SPX, DXY, and VIX correlations to confirm momentum.
Stock traders: Track gold and yields to gauge investor confidence.
Forex traders: Trade USD pairs according to global sentiment.
Swing traders: Filter trade bias by checking the current global regime.
Tip: When correlations align (e.g., DXY up, SPX down, BTC down), expect trend continuation.
When they diverge, volatility or reversals are likely.
🔵 ADVANCED TOOLS TO WATCH
Global Liquidity Index: Track combined balance sheets of the Fed, ECB, BOJ, and PBC.
Stablecoin Supply (Crypto): Expanding supply = liquidity entering market.
Yield Curve (10Y–2Y spread): Falling = caution, Rising = recovery.
Funding Rates: Confirm risk sentiment via leverage buildup.
🔵 CONCLUSION
All markets are connected through liquidity.
Risk On and Risk Off regimes describe how that liquidity rotates between return and safety. By tracking global correlations — equities, bonds, gold, DXY, and crypto — traders gain a powerful macro filter to stay on the right side of momentum.
Liquidity creates direction. Correlation confirms conviction.
If you learn to read the global flow, your technical analysis will finally make sense in the bigger picture.
Do you track global correlations in your analysis? What’s your favorite Risk-On or Risk-Off indicator?
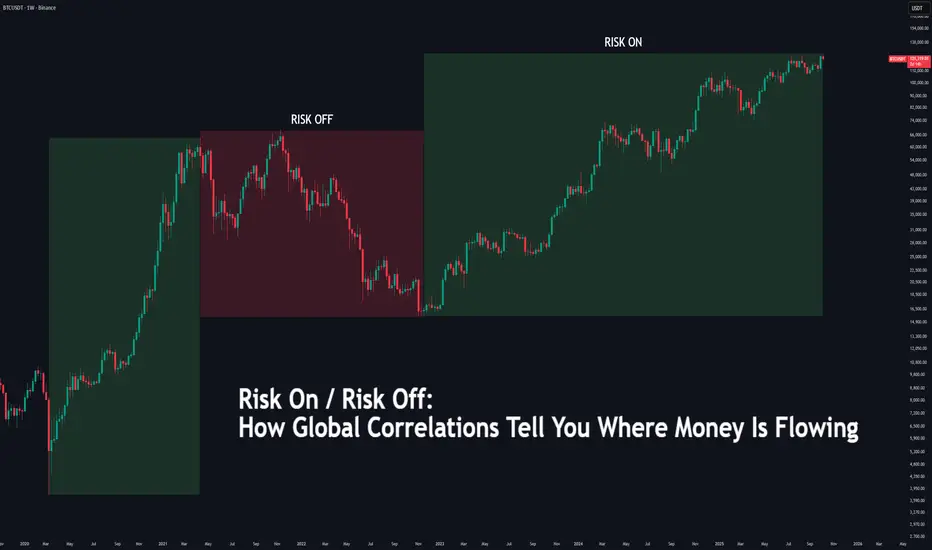
Macro Alert: The Stealth Flight 2 Alts (Tariffs, Gold & Privacy)🚨 MACRO ALERT: The Silent Surge — Altcoins Accumulating Undetected Since April
Chart: CRYPTOCAP:OTHERS.D
━━━━━━━━━━━━━━━━━━━━━━━━━━━━━━━━━━━━━━━━
📊 The Setup
While the mainstream remains fixated on Bitcoin's swings, a quiet but significant capital rotation into altcoins is underway. This move, largely undetected by the broader market, is being fueled by shifting global macroeconomic tides and a growing institutional hunt for wealth preservation and financial privacy .
━━━━━━━━━━━━━━━━━━━━━━━━━━━━━━━━━━━━━━━━
🔴 THE CRISIS: Multiple System Failures Converging
🏦 BIS Warning: Global Liquidity Crisis
↓
🇯🇵 Japan: Unsustainable debt from fiscal stimulus
🇫🇷 France: 0.6% growth in 2025, economic stagnation
↓
💸 Coordinated failure of fiat monetary policy
⛓️ Government Attacks on Safe Havens
↓
🇺🇸 U.S. Gold Tariffs: 39% on major imports
Physical metals face capital controls & taxation attacks
Traditional assets no longer safe from state control
🔒 Even Crypto Has Centralization Issues
↓
📜 GENIUS Act: Stablecoins expand M2 money supply (monetizing debt via blockchain)
🏢 XRP: Concentrated token control raises manipulation concerns
━━━━━━━━━━━━━━━━━━━━━━━━━━━━━━━━━━━━━━━━
🟢 THE SOLUTION: Where Capital Is Flowing
Smart money is seeking assets with:
• TRUE decentralization
• Privacy features
• Fixed supply
• Institutional-grade infrastructure
The Data Confirms It:
🔐 Privacy Coins (XMR, ZEC): +71.6% in 2025
📊 CRYPTOCAP:BTC: +27.1%
📊 CRYPTOCAP:ETH: +33.4%
📈 OTHERS.D: Rising quietly
This is sophisticated money moving in, not retail FOMO.
━━━━━━━━━━━━━━━━━━━━━━━━━━━━━━━━━━━━━━━━
💥 The Macro Catalyst: Why This Is Happening Now
⚡ Gold Under Attack: The recent 39% U.S. tariff on major gold imports has rattled the traditional safe-haven market, creating artificial scarcity and signaling a broader trend of government control over monetary assets . When even physical metals face intervention, capital seeks alternatives outside increasingly controlled systems.
🚨 The BIS Warning Nobody Is Discussing:
The Bank for International Settlements is quietly sounding alarms on global liquidity risks:
• 🇯🇵 Japan's fiscal stimulus → unsustainable debt levels
• 🇫🇷 France → 0.6% growth (stagnation)
• 💸 Result: Coordinated fiat monetary policy failure
🪤 The Stablecoin Trap:
The U.S. GENIUS Act is expanding M2 money supply through the back door via stablecoins:
→ Legitimizing stablecoin issuance backed by Treasury bonds
→ Monetizing debt while calling it "innovation"
→ This isn't decentralization—it's the Fed with a blockchain wrapper
━━━━━━━━━━━━━━━━━━━━━━━━━━━━━━━━━━━━━━━━
🎯 Macro Pressure → Altcoin Opportunities
😰 Worried About: Wealth Confiscation/Control
💡 Consider: Financial Sovereignty & Privacy
🔍 Examples: CRYPTOCAP:XMR , CRYPTOCAP:ZEC
📈 Catalyst: Zcash surged 150%+ on institutional demand (Grayscale Trust)
😰 Worried About: Currency Devaluation & Inflation
💡 Consider: Scarce, Decentralized Stores of Value
🔍 Examples: Altcoins with fixed supplies + robust decentralized governance
🔑 Key: Assets that can't be inflated or controlled by single entities
😰 Worried About: Traditional Finance Instability
💡 Consider: Institutional-Grade Blockchain Infrastructure
🔍 Examples: HBAR (corporate governance) & XRP (cross-border payments)
⚠️ Note: Focus on real-world utility beyond speculation
━━━━━━━━━━━━━━━━━━━━━━━━━━━━━━━━━━━━━━━━
What to Watch For
✅ Confirmation: Strong, high-volume breakout above recent range high on CRYPTOCAP:OTHERS.D
🔍 The Privacy Pulse: Continued strength in privacy coins ( CRYPTOCAP:XMR , CRYPTOCAP:ZEC , XVG.D) is a key leading indicator. Note: Privacy coins face regulatory challenges and have been delisted from some major exchanges.
❌ Invalidation: Break and close below key support zone (April low structure) would suggest macro fears haven't overcome broader market uncertainty.
━━━━━━━━━━━━━━━━━━━━━━━━━━━━━━━━━━━━━━━━
🎯 The Bottom Line
The gold tariff is a symptom of a larger disease: eroding trust in neutral, non-government monetary assets . This is forcing a "regime change" in capital allocation.
As this realization dawns on more investors, the quiet accumulation in altcoins—particularly those offering privacy, sovereignty, and real-world utility —could explode into the next major market narrative.
💭 Smart money is moving early. The question is: will you recognize this shift before it becomes obvious?
━━━━━━━━━━━━━━━━━━━━━━━━━━━━━━━━━━━━━━━━
⚠️ Disclaimer: This is macroeconomic observational analysis and is not financial advice. Always conduct your own research (DYOR) and manage risk appropriately.
Cheers!
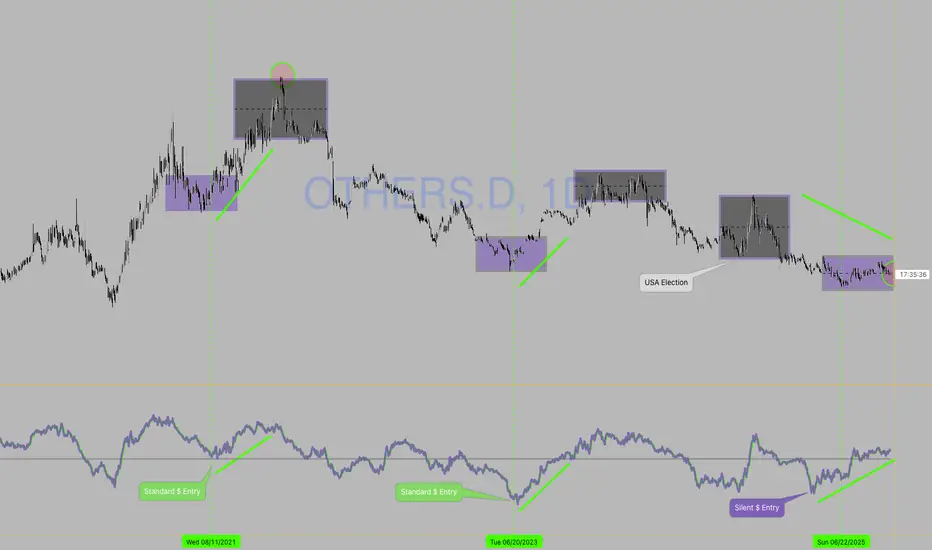
$BTC / Total Global Liquidity / Treasury General Account How hilarious is this - ₿itcoin ended up reaching a new ATH just 5 days after I expected. I was 2 days off on my last call if you remember. And the several before I nailed to the day.
Remember all the grave-dancers last week who were showing you the decorrelation between CRYPTOCAP:BTC & Global Liquidity??
🐤 chirp chirp 😂
It was clear the Treasury General Account was the cause for this deviation, therefore I added it on this chart alongside Total Global Liquidity to monitor more closely.
Note - the TGA is already included in the TGL index, but it appears to hold much more weight so it’s best to look at it alongside.
I also took out the inverted DXY since it’s been tracking near 1 to 1 and was used simply to show confluence.
Now that Fiscal Year Q1 2026 has started, the TGA refill is complete, which will finance the ~$325 Billion outlined in the One Big Beautiful Bill for defense, border security etc. This will also be financed in the form of short-term T-Bill issuance (what I've written about before).
Then we see the trickle down effect as money makes it’s way through the economy and the business cycle booms which is tracked through the ISM PMI.
The latest print on Sept. 30th showed a 1-point uptick now at 49.1, which is a point higher than last month’s reading. I’m confident the next several months will show readings above 50 which show continued growth in the business cycle and health of the overall economy.
To all the haterz - FU HIGHER 🚀

Treasury General Account MAJOR Impact on $BTC PriceI’ll be the first to admit I failed to closely follow and analyze the impact of the Treasury General Account (TGA).
We all know it’s a liquidity suck on ₿itcoin and cryptocurrencies, which are the most highly sensitive assets to liquidity, but have you ever dove into the data to see just how impactful it is?
I went through all the refills and calculated how much it drew down the CRYPTOCAP:BTC price.
Note how TGA refills also marked cycle tops in 2017 and 2021.
This really is something to closely monitor going forward alongside Total Global Liquidity (TGL).
What I have found is when TGA refills are occurring, they have more impact on the price of BTC than TGL.
We can see this in the current state of market, where TGL is at an ATH and the TGA is currently being refilled.
GOOD NEWS: The TGA refill is just about complete 🏁
Moon on brave soldiers 🌛

THE 4-YEAR CYCLE WILL NEVER ENDTHE 4-YEAR CYCLE WILL NEVER END.
As I’ve said many times before, I now think this cycle will push into late January / February 2026, similar to 2017.
As I’ve written extensively about, the macro setup is nearly identical to 2017.
Read that here.
The funny thing is, when we do push into early Q1 ‘26, all your favorite “influencers” will proclaim “this time is different”, because most weren’t here during the 2017 cycle or before.
There is ZERO EVIDENCE that the 4-year cycle is dead.
Since the GFC in 2008, the Fed was redesigned for these boom and bust cycles to counter inflation and unemployment.
At this point, unless the US completely dismantles the Fed, the 4-year cycle will live on in perpetuity. We see the effect of this on TradFi as well.
See the comparison here.
The Fed is set to cut interest rates for the first time in a year at tomorrow’s FOMC. This is a liquidity positive catalyst for markets.
The next ISM PMI print on October 1st should be ~50, which will be the start of the business cycle.
That would give us ~5 months of a surging business cycle, which will pump risk assets to VALHALLA.

$BTC ATH Sept 23 - 30th - Global Liquidity UpdateThis total global liquidity indicator alongside DXY (inverted) has pretty much nailed BTC tops and bottoms to the day this cycle.
Pretty wild how accurate this is.
Notice the inverted head & shoulders pattern and neckline break for confirmation.

$BTC CME Gap + Bad Bart = Easiest Short EverCME Gap + Bad Bart is like taking candy from a baby 👨🏻🍼
Look at that textbook bounce off the .382 Fib 🤓
Pain ain’t over folks.
RSI still shows room on the downside 📉
Global Liquidity drain on the 4th.
Looking like the 50% Gann Level is next ~$111k
Get those bids in 😎
And never forget the BullTards who were telling you about the “Bollinger Band Squeeze” and UpOnly season 🫠
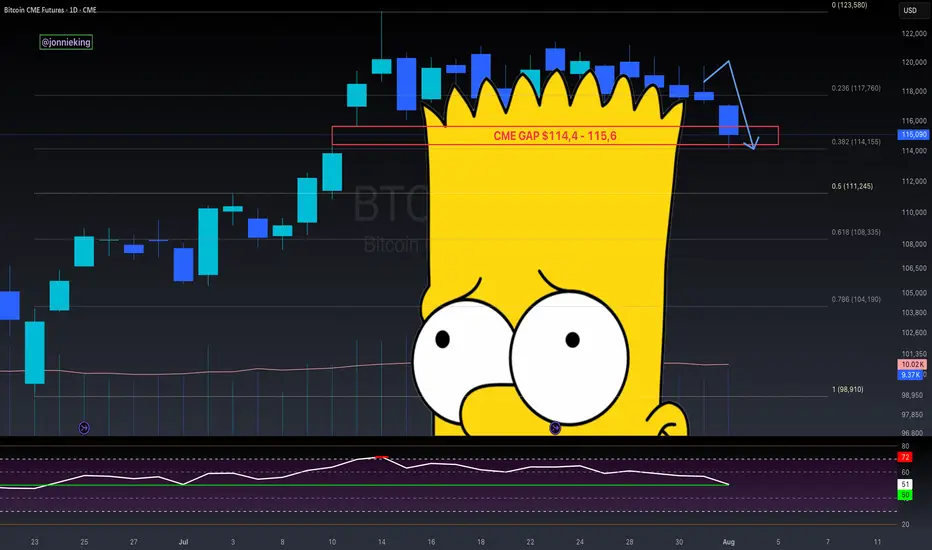
$BTC Leading Macro Indicator Chart Predicted the Nuke to The DayYet again this chart predicted the nuke to the day 💣
I know I shouldn't be surprised at this point, but I'm still fascinated by how accurate technical analysis can be 🤓

$BTC 12-Week Lead Correlation w/ Global Liquidity, M2, GOLD, DXYHere’s a look at Bitcoin's price action against Global Liquidity, Global M2, GOLD and DXY - all with a 12-Week Lead.
Notice GOLD has a bit more of a deviation from the BTC price than the others.
This is because GOLD is used as a store of value asset, whereas the others are predicated on Central Banks expanding and contracting their money supply and balance sheets.
The key here is to smooth out the signal and ignore the noise.
Notice the convergence between these metrics the past couple months.

$DXY Up, M2 Money Supply DownWhen the DXY goes UP,
M2 Money Supply goes DOWN.
Remember the 12-Week Lead correlation with CRYPTOCAP:BTC

Global M2 MONEY SUPPLY VS GLOBAL LIQUIDITYWhich is the best to track ₿itcoin price action?
Lots of macro gurus have been arguing over the two.
For comparison, I have indexes for both metrics on a 12-Week Lead, tracking the 4 largest central banks:
The Federal Reserve (including TGA & RRP), People’s Bank of China, European Central Bank and Bank of Japan.
Let’s start by defining each.
Global M2 Money Supply covers physical cash in circulation and cash equivalents such as checking and savings deposits, as well as money market securities.
Global Liquidity covers a broader measure of liquid assets driven by central bank balance sheets, private sector financial activity (e.g., lending, corporate cash), and cross-border capital flows.
Historically, both move closely in lock-step and act as a great leading indicator for ₿itcoin, however we can see that Global Liquidity can have more drastic fluctuations.
We saw a large divergence in CRYPTOCAP:BTC PA with both metrics when the Blackrock iShares ₿itcoin ETF appeared on the DTCC list, a procedural step signaling progress toward potential approval.
When you look at the charts of all three, you can see there are points where either metric might follow CRYPTOCAP:BTC PA a bit closer, so in the end I would say it’s best to track both to find confluence in the signal.
