Gold (XAUUSD): possible buy setup LTFGold (XAUUSD): possible buy setup LTF. Break, confirm, buy, tp.
Cheers
Gold


Gold (XAUUSD): Possible buy setupGold (XAUUSD): Possible buy setup. All clear. Wait for a break, confirm, keep, tp.
Cheers

Gold (XAUUSD): Possible buy setup, refinedGold (XAUUSD): Possible buy setup, refined. Price took some more liquidity before going up.
Cheers

Gold (XAUUSD): Possible sell setupGold (XAUUSD): Possible sell setup. Wait for a clear breakout, with additional confirmation.
Cheers

Gold (XAUUSD): High probability setupGold (XAUUSD): High probability setup. If price breaks and holds it is a good high probability setup.
Cheers

Support and trend line coincide, pullback to buy.#XAUUSD OANDA:XAUUSD TVC:GOLD
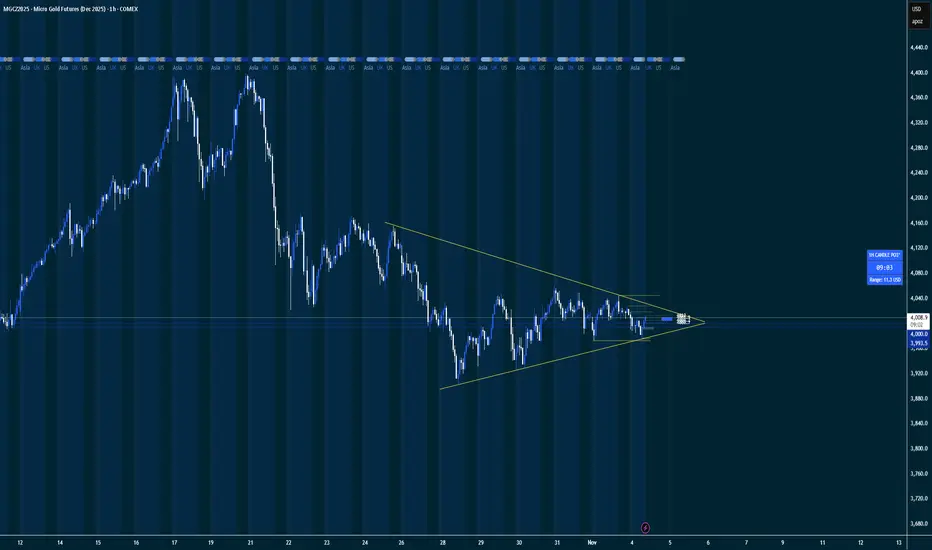
So far, gold has failed to break out of the converging triangle boundary to choose a clear trading direction, but as time goes on, the price is gradually approaching the end of the triangle, and the battle between bulls and bears may come to a critical decision during the NY session. Looking at the hourly chart, multiple attempts to break through the 4000 resistance level have failed, confirming the pressure above, and gold prices may see further pullback in the short term. The support zone below coincides with the upward trend line, which may be the key area for gold to test during a pullback. Therefore, continue to pay attention to the support level of 3970-3960. If the price retraces to the support level during the NY session and does not break down, you can try to go long on gold with a small position.

GBP/USD (British Pound vs US Dollar)..GBP/USD (British Pound vs US Dollar) chart on the 1-day timeframe, here’s a detailed target analysis based on my Ichimoku setup and support zones:
---
🔍 Chart Overview
Current price: around 1.3044
Price has broken below the Ichimoku cloud, confirming bearish momentum.
The chart shows two downside target zones labeled “Target Point”.
The market is retesting a broken support area near 1.3050–1.3100, which now acts as resistance.
---
🎯 Target Levels
First Target (Short-Term)
Zone: 1.2700 – 1.2750
This aligns with your first marked “Target Point”.
Represents the next key support zone and the measured move from the recent breakdown.
Expect the price to react here — possibly a temporary bounce or consolidation.
Second Target (Medium-Term)
Zone: 1.2350 – 1.2400
This is my lower “Target Point”, and a major support area from earlier this year (March–April zone).
If bearish pressure continues, price could extend to this level over coming weeks.
---
📊 Trading Plan Summary
Direction Entry Zone Target 1 Target 2 Stop Loss
Sell (Short) 1.3050 – 1.3100 (after pullback) 1.2700 – 1.2750 1.2350 – 1.2400 Above 1.3200
---
⚠ Notes
If GBP/USD reclaims 1.3200+ and closes back inside the Ichimoku cloud, bearish momentum weakens — switch to neutral or bullish outlook.
As long as price stays below the cloud and under 1.3100, downtrend continuation remains likely.

XAUUSD ONE MORE LEG DOWNSIDE🟡 Technical Overview: Gold (XAU/USD) 1-Hour Chart
This 1-Hour chart for Gold (XAU/USD) exhibits a clear shift from a short-term upward trend into a strong bearish impulse, followed by a minor corrective bounce.
The price action was characterized by an ascending channel/uptrend (marked by the blue parallel lines) which defined the market's structure. Crucially, the chart shows a decisive breakdown from the lower trendline of this channel, which occurred around the $3,980 level.
Following the breakdown, the price experienced an aggressive sell-off, dropping to a swing low around the $3,920 zone. This area, marked by a Horizontal Support Level (HS), successfully halted the immediate decline and initiated a modest corrective bounce.
📉 Analysis and Projection
The overall bias has shifted to bearish in the short term, due to the confirmed break of the prior uptrend structure. The current price action is interpreted as a bearish flag or consolidation phase following the sharp impulse move down.
Resistance (Key Bearish Zone): The most significant resistance is the prior uptrend's lower trendline, now acting as a ceiling for the price. This line intersects near the $3,980 - $3,990 area. A strong rejection from this zone would confirm the breakdown and the continuation of the downtrend. The $4,000 psychological level also sits just above this zone, providing further strong overhead resistance.
Support (Key Bullish Zone): The immediate support is the $3,920 Horizontal Support (HS). This level successfully stemmed the aggressive selling and is the critical line that buyers must defend.
Projection: The path of least resistance is to the downside. The high-probability scenario projects a move down from the current consolidation, breaking the $3,920 support. The next significant downside target would be the lower horizontal line marked on the chart, around $3,880 - $3,900, which would fill the most recent move's potential extension.
Alternative Scenario: A confirmed move and hourly close above the $4,000 psychological and former trendline resistance would invalidate the short-term bearish bias, suggesting a potential re-test of the recent swing high.
The technical indications strongly favor a continuation of the bearish move, with the $3,980 - $4,000 zone serving as the critical pivot for the next move.

Downward Pressure on Gold ContinuesThe downward pressure is very apperant in gold. Yesterday, I expected a move toward 4060 to short but it never came. There are some liquidity problems in the money and bond market and this is causing a selloff in many things while dollar is rising slowly. This will likely to continue until the end of shutdown. For detail, you can check the tweets of @SantManukyan , one of my favorite economist but you will need to use AI for translation.
Anyway, I plan to go short from 3997-4010 zone with targets 3923 and 3870 and stop if the yellow trendline and yesterday's top breached.

Gold 30Min Engaged ( Bearish after break out entry Detected )Status: Active Reversal Protocol
Symbol: Gold
Session: London–New York Overlap (Smart Exit Window)
Bearish After Break 3980
Bearish After Break 3950
Bias: Bullish & bearish Reversal
☄️ Volume Surge Confirmed — Sellers dominate exhausted highs
☄️ Session Aligned — Smart money exit window open
☄️ Cluster Shield Active — Supply imbalance verified
☄️ Delta Shift Negative — Buyers trapped above
☄️ POC Retest Completed — Liquidity absorbed at resistance
☄️ Structure Break Pending — Bearish bias confirmed

Gold Weakening Inside Triangle – Bears Eye $3,950 SupportGold is currently consolidating inside a symmetrical triangle formation between 3972 support and 4025 resistance showing reduced volatility and awaiting breakout confirmation. The structure suggests indecision but with a slight bearish bias due to repeated lower highs.
Sell Zone: 3995-4020 (near upper triangle resistance and 0.382-0.5 fib region)
Stop Loss: Above 4046
TP1: 3950 TP2: 3915 TP 3: 3885
⚠️ Current bias: Neutral to bearish unless gold breaks and holds above 4025-4046 zone. Weak low near 3886 may attract liquidity if bearish pressure continues.
Note
Please risk management in trading is a Key so use your money accordingly. If you like the idea then please like and boost. Thank you and Good Luck!

XRP will Rise!XRP at a SUPPORT zone. Got some confirmation for it bouncing back. Waiting for Trend Reversal confirmations. Before the end of the year there could be a great spike for the major cryptocurrencies.

DeGRAM | GOLD held the lower boundary of the channel📊 Technical Analysis
● XAU/USD is testing the support line of the rising channel, which is a potential entry point for buyers. A break above the resistance line near $4,046 could lead to further upside momentum toward the next resistance zone.
● Price has recently shown strong reactions at key support levels and is maintaining a higher-low structure, indicating possible bullish continuation.
💡 Fundamental Analysis
● Gold is gaining support due to uncertainty in global equities and rising inflation concerns, which favor safe-haven assets.
✨ Summary
● Look for a breakout above $4,046, targeting higher levels. The market is poised for a short-term upward move. Support at $3,960 should hold for a bullish bias.
-------------------
Share your opinion in the comments and support the idea with a like. Thanks for your support!

How to keep up with the rhythm of triangle pattern consolidation#XAUUSD OANDA:XAUUSD TVC:GOLD
Gold prices stalled at higher levels yesterday, mainly due to Federal Reserve officials' cautious stance on a December rate cut, which boosted the dollar and dampened enthusiasm for gold's rise. Judging from the current trend, the market is in a converging triangle pattern. The daily MA5 is around 3987, and the MA10 is around 4021. It can be seen that the range between these two points is very small, indicating that the market is also preparing to break out and choose a major direction. Once the gold price breaks out of the triangle pattern and chooses a direction, the daily chart's trendline will widen. Therefore, the key resistance level to watch is 4020-4030, while the key support level is 3970-3960. The European session is expected to trade within a range in the short term. Before a successful breakout, pay attention to the resistance level of the middle band on the hourly and 4-hour charts at 3995-4000. If the price touches the resistance level on the first attempt and fails to break through, a small short position can be considered.
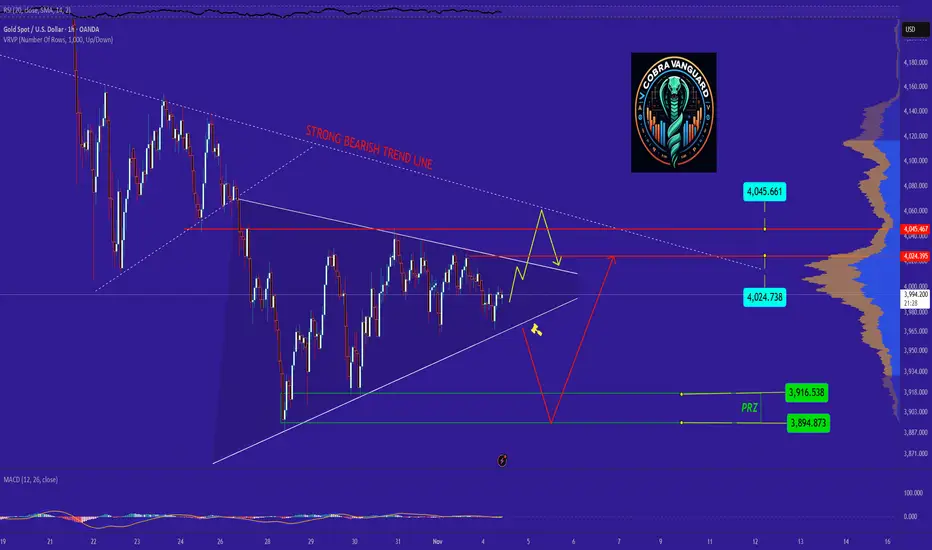
GOLD at the Brink Breakdown or Breakout?GOLD at the BrinkBreakdown or Breakout? —if the triangle breaks downward, it could fall toward the bearish PRZ zone. But if new positive news or rising Middle East tensions emerge, there's hope for a bullish move. For now, the news remains neutral.
What do you think—will GOLD fall or rise?
XAUUSD: Market Analysis and Strategy for November 4thGold Technical Analysis:
Daily resistance: 4080, support: 3890.
4-hour resistance: 4035, support: 3960.
1-hour resistance: 4025, support: 3970.
Structurally, gold is currently oscillating between 4040 and 3900. Having failed to break higher for two consecutive days, the probability of a downward move is increasing.
Today, the key focus is on whether the support at 3965 can be broken. If so, the next target will be 3930 or even 3900.
Of course, if it breaks above 4040 today, then a buy-on-trend strategy is warranted.
Trading Strategy:
BUY: 4040near
BUY: 3965near
SELL: 4025near

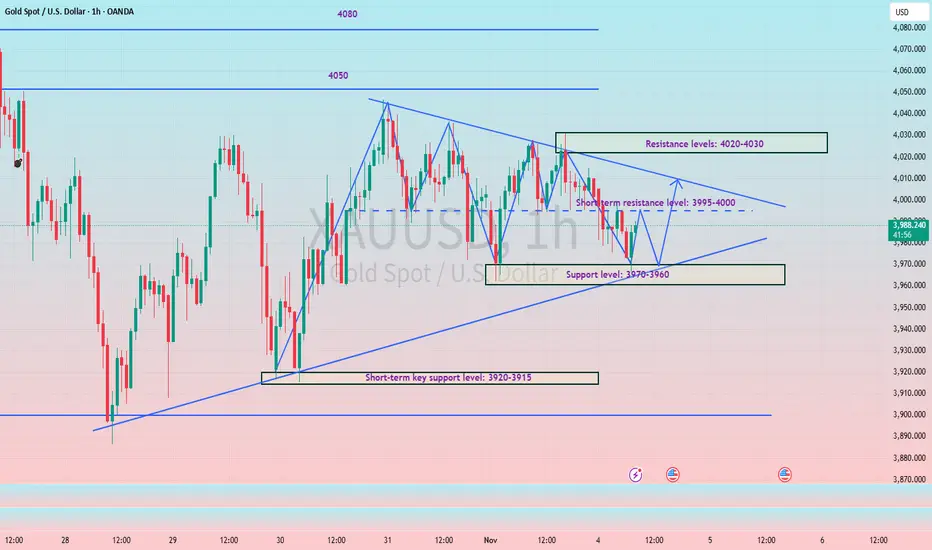
XAU/USD – Range Trading Within Key Supply and Demand ZonesGold (XAU/USD) is currently consolidating in a tight horizontal range between $3,920 – $4,060, showing a clear balance between buyers and sellers on the 1-hour chart. After several failed attempts to break above resistance, momentum appears to be losing strength, hinting at a potential short-term pullback.
The current setup shows price trading near the upper boundary of the range, aligning with a visible supply zone. This offers a risk-reward opportunity for short-term traders anticipating a rejection from resistance.
Key levels to watch:
Resistance zone: $4,050 – $4,060 (range high / supply area)
Support zone: $3,920 – $3,940 (range low / demand area)
Mid-level: $3,990 (balance line)
Trading plan:
If price remains capped below $4,060 and forms a bearish rejection candle, short positions could target $3,940, with stops above $4,065.
However, a confirmed breakout and close above $4,065 may invalidate the short setup, opening the door for a bullish extension toward $4,100 – $4,120.
Technical summary:
Structure: Sideways consolidation within major range
Bias: Bearish while below $4,060
Tools used: Support & resistance, supply-demand zones, price action
Gold continues to trade indecisively within its range — a breakout from either boundary will define the next major move. Traders should stay patient and wait for confirmation before engaging.
Follow for more professional gold analysis and refined intraday trade setups every day.

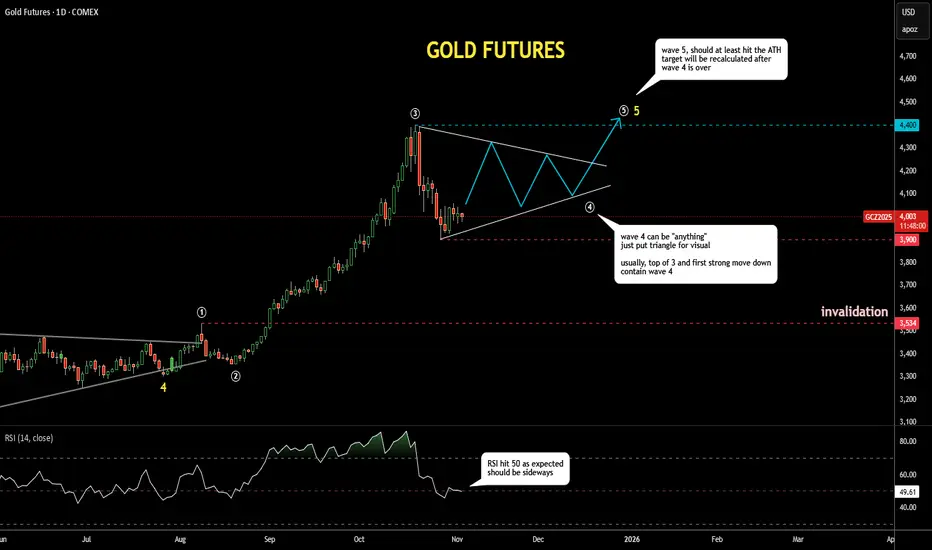
Gold Update 04NOV2025: Wave 4 Dropped Into Target AreaGold futures dropped into the pink-box target area based on the Fibonacci retracement between $3,750 and $4,000.
As expected, the RSI has reached the 50 “waterline”, where it could find some support and start moving around that level.
Many traders lose money in fourth waves, as they can be “anything” and often last longer than one’s pocket. I’ve outlined a triangle shape in wave 4 just for visual context.
The range built through the peak of wave 3 around $4,400 and the bottom of recent panic selling near $3,900 will likely contain most of the volatility in wave 4.
It can take time… testing one’s patience.
Big Moves Ahead? DXY, EUR/USD & Gold at Crucial LevelsLadies and gentlemen, there was a time when forex was full of trading opportunities... to the point where most people struggled with overtrading. But these days, you need a solid watchlist to even find positions, and that's where Skeptic Lab comes in—it's a great spot for spotting good opportunities. So without further ado, let's dive into the analysis of DXY , or the dollar index.
💲 In the daily timeframe , after the drop it had, it's entered a consolidation box, and it looks like we're nearing the end of that box. The main long trigger is a break of 100.262 from a technical standpoint, but personally, after the break of 99.850, I'm already positioned on one of the USD symbols. In lower timeframes, plus the fact that breaking the ceiling of consolidations is usually not straightforward and comes with a lot of volatility, so it's better to have a pre-breakout position.
💶Let's head over to EURX in the 4H timeframe —we've had a good reaction at the 1085.9 support. Breaking it would be a great trigger if you want a EURUSD position.
Speaking of EURUSD , it's already entered a secondary bearish trend after breaking its daily trend line. If the DXY consolidation box breaks, EURUSD will officially change its HWC trend to bearish. The position I mentioned at the start of the analysis—I opened it with the break of that same daily EURUSD trend line. The key level for profit-taking will be 1.14640. I'll wait to see what reaction DXY gives—if it fakes the box break, I'll close the position; if not, I'll leave it open for now.
🪙But let's move on to gold —the commodity I'm eyeing today for opening a position. From a technical perspective, it's at a spot that gives both short and long triggers... let me explain.
In the daily timeframe, we had a strong uptrend rally that, after reaching 4377.67 , entered its secondary corrective trend. In the 4H timeframe, what's interesting is the formation of these range boxes we're seeing. So our long and short triggers are clear: break of the box ceiling = long / break of the box floor = short.
But the thing is, the targets are the same... see, opening a short here basically means going along with the secondary trend, so? Your expectations should be relative to this leg, not the weekly one... so it's better to take your targets quicker, like 3896.31 (the 0.38 fib intersection), which could be a good target. Plus, each bearish leg is weaker than the previous one, so the point I mentioned makes sense for the target.
For longs, though, you can proceed with partial profits and not close too early. Alright, that's it. Now get outta here.

GOLD → Consolidation is narrowing... Price is weakening FX:XAUUSD is trading near $4,000, consolidating after the Fed's statements and awaiting new macro data. The trading range has narrowed to $3,886–4,046, forming a symmetrical triangle (unpredictability)
Fed caution: Powell ruled out guarantees of a rate cut in December, which supported the dollar and limited gold's growth.
US shutdown: Could become the longest in history, causing economic concerns, but is expected to end this week.
Weak data: ISM Manufacturing PMI (48.7) pointed to contraction in the sector, which is holding back the dollar's strengthening.
This week, attention is focused on ADP and ISM Services — assessing the impact on Fed rates.
NFP (if published) — a key benchmark for the labor market.
Accordingly, gold is in wait-and-see mode. Clear signals from the data or the Fed will be needed to break out of the range. The $4000 level remains a psychological equilibrium point.
Resistance levels: 4000, 4030, 4050
Support levels: 3956, 3915, 3900
At the moment, the price is far from the key consolidation boundaries, and the market is uncertain. In this case, we are considering trading within the channel. I expect to see a retest of the flat resistance or the triangle boundary and a rebound.
Best regards, R. Linda!


Bearish Scenario (primary)Bearish Scenario (primary)
Bias: Still bearish until price can reclaim 4020+ on 4H.
Setup idea:
Entry: 4008–4012 (retest of imbalance / EMA cluster).
Stop-loss: 4022–4025 (above 4H minor swing and trendline).
Targets:
TP1 → 3980 (1H structure low / EMA200 zone)
TP2 → 3960 (liquidity sweep below wedge support)
TP3 → 3920 (major 4H demand zone)
Confirmation: Wait for 15m rejection wick or lower-timeframe MSS/CHOCH within that zone.
Bullish Alternative (reversal breakout)
If price closes a 4H candle above 4020 with strength:
Entry: Retest of 4010–4012 as support.
Stop-loss: Below 3995.
Targets:
TP1 → 4040 (previous supply zone).
TP2 → 4080 (liquidity above equal highs).
Summary
Structure compression signals potential breakout soon.
Since momentum is still bearish and price is failing to reclaim 4H EMAs, short from resistance is higher-probability.
Watch reaction to 3980 — if it holds firmly with bullish divergence, the wedge breakout north could begin.