XAUUSD: Correction Phase Aiming Toward 3,900 SupportHello everyone, here is my breakdown of the current Gold setup.
Market Analysis
Gold (XAUUSD) has shifted from a strong bullish phase into a clear bearish structure after failing to sustain momentum above the 4,130 Resistance Zone. The market initially traded within an Upward Channel, forming a steady series of higher highs and higher lows until buyers lost strength near the top of the range. A breakout from the channel confirmed the end of the bullish impulse, followed by a range formation and multiple fake breakouts, indicating indecision and growing selling pressure. Eventually, the market broke below the range, retested the resistance area, and established a Downward Channel, showing that sellers have regained control.
Currently, Gold is moving within this descending structure, respecting both the upper and lower boundaries of the channel. The Resistance Zone around 4,130 has once again acted as a strong supply area, rejecting price and pushing it lower toward the Support Zone near 3,900.
My Scenario & Strategy
From my perspective, XAUUSD is likely to continue its short-term bearish correction toward the 3,900 support level, which aligns with the lower boundary of the channel. A successful test of this area could trigger a short-term reaction or even a potential reversal if buyers step in.
As long as price remains below the Resistance Zone (4,130) and within the Downward Channel, the bearish sentiment remains dominant. A confirmed breakdown below 3,900 could open the door for a deeper move toward the 3,850–3,820 zone. For now, I remain bearish in the short term, looking for short opportunities from the upper channel resistance with a primary target at 3,900.
That's the setup I'm tracking. Thank you for your attention, and always manage your risk.
Gold

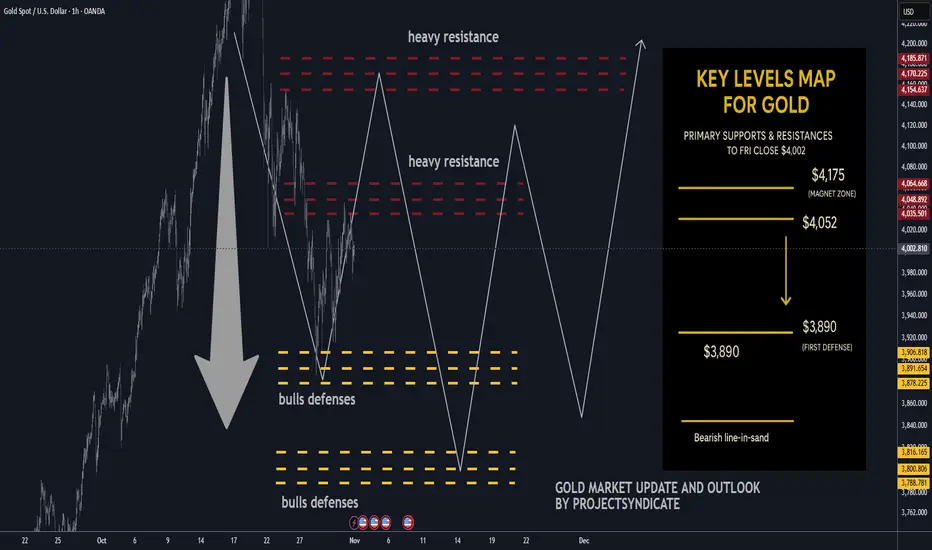
Gold next week: Key S/R Levels and Outlook for Traders🔥 GOLD WEEKLY SNAPSHOT — BY PROJECTSYNDICATE
🏆 High/Close: $4,108 → ~$4,002 — sellers defended overhead; weekly close soft within range.
📈 Trend: Neutral / correction mode still ON; not expecting new highs near term.
🛡 Supports: $3,890 → $3,800 — pivotal shelves for downside containment.
🚧 Resistances: $4,052 / $4,175 — magnet zones for supply / fade attempts.
🧭 Bias next week: Prefer short sells into $4,052–$4,175 with take-profit toward $3,890 → $3,800. Invalidation on sustained reclaim > $4,175; failure of $3,800 risks extension lower.
🌍 Macro tailwinds/headwinds :
• Rates: Real yields stable-to-firm keep upside contained; any dovish surprise could spark squeezes into resistance.
• FX: DXY mixed—lack of broad USD weakness limits impulse follow-through.
• Flows: CB/ETF demand supportive on deep dips but tepid near highs.
• Geopolitics: Event risk provides intermittent bids; not a trend driver this week.
🎯 Street view: Medium-term bullish narratives reserve diversification, policy easing into 2026 remain, but near-term tape favors mean-reversion lower under resistance.
________________________________________
🔝 Key Resistance Zones
• $4,052 — immediate ceiling; prior supply pivot likely to cap first tests
• $4,175 — upper resistance; acceptance above flips tone from corrective to constructive
🛡 Support Zones
• $3,890 — first defense; loss invites momentum probes
• $3,800 — critical structural base; break risks downside acceleration
________________________________________
⚖️ Base Case Scenario
Range-to-soft trade within $3,800–$4,175. Rallies into $4,052–$4,175 are sellable; expect rotations back toward $3,890 with scope to $3,800 if sellers press.
🚀 Breakout Trigger
Only a sustained acceptance > ~$4,175 negates the correction and opens $4,200+ pathing; conversely, firm rejection at $4,052 with a daily close < $3,890 increases odds of a $3,800 test.
💡 Market Drivers
• Fed path & real-yield drift
• USD index swings
• ETF/CB flow tone on dips vs. rips
• Risk sentiment headlines (geopolitics/trade)
🔓 Bull / Bear Trigger Lines
• Bullish above: $4,175 correction phase likely over if held
• Bearish below: $3,890 → risk expands under $3,800
🧭 Strategy
Short-sell from overhead resistances ($4,052 → $4,175).
Scale profits into $3,890 then $3,800; keep stops tight above trigger levels. Stand aside on fresh longs until sustained reclaim above $4,175 reasserts momentum.
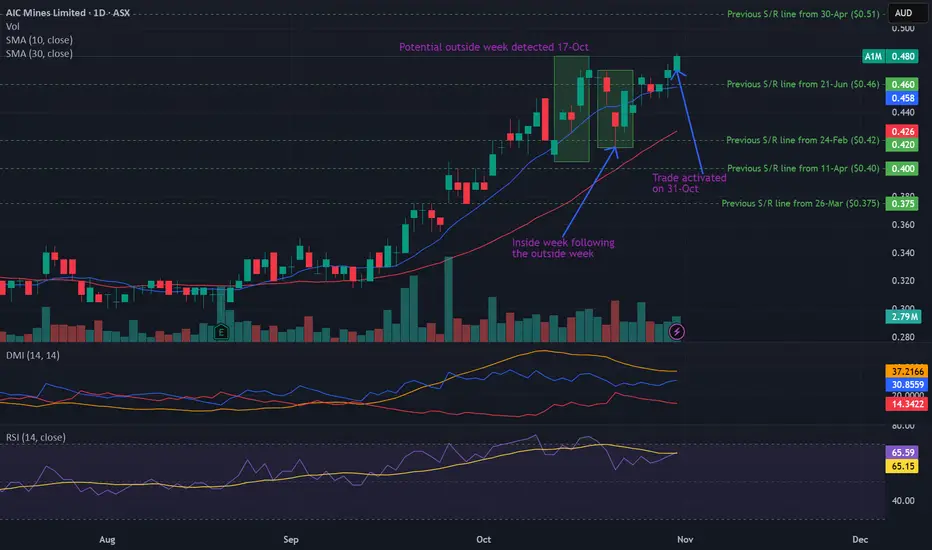
Potential outside week and bullish potential for A1MEntry conditions:
(i) higher share price for ASX:A1M above the level of the inside week following the potential outside week noted on 17th October (i.e.: above the level of $0.47).
Stop loss for the trade would be:
(i) below the low of the inside week on 22nd October (i.e.: below $0.415), should the trade activate.
If $GOLD is at its peak, is $BTC next?Gold has been rejected at the 0.618 level of the Fibonacci channel on the 3M chart.
The Stoch RSI demonstrates a striking similarity to past cycles:
The bullish structure, which continued in the overbought region in October 2010, peaked 273 days later in July 2011.
Momentum, which continued in the overbought region again in October 2019, reached its peak 365 days later in October 2020.
Today, history paints a similar picture once again.
The bullish structure, which began in the overbought region in October 2024, may have reached its peak approximately one year later, in October 2025, just as in previous cycles.
Gold appears to be completing its historical rhythm once again.
Note: The Bitcoin / Gold pair is developing in the opposite direction.

Wall Street Weekly Outlook - Week 45 2025 [03.11.- 07.11.2025]Wall Street Weekly Outlook - Week 45 2025
📅 November 3 – November 7, 2025
Let’s kick off an exciting new trading week — and a brand-new trading month! 🚀
Seasonal factors often play a major role in November and December, and I’ll break them down for you in this week’s video. 🎥📈
Sit back, enjoy the overview, and dive into the world of banks, hedge funds, and institutional flows — with exclusive insights into how the pros are positioned right now. 🧠💼📊
💡 Bonus segments: Strategies, setups & market psychology — everything you need to know for the week ahead. ⚡️
📘 Topics covered in this week’s outlook:
🏛 Seasonality in the Nasdaq:
🥇 Seasonality in Gold:
... and many more charts & concepts in the video! 🎬📊
💬 I’m looking forward to your questions, comments, and an active discussion here on TradingView!
👋 Best,
Meikel

GOLD → Consolidation. The fundamental backdrop is changing...FX:XAUUSD stabilizes after a week-long decline, failing to consolidate above $4050. The market is taking a pause before new impulses. Focus on 4030 and 3980...
Investors are closing positions before the end of the week and month, the reason being the uncertainty surrounding the deal with China and Powell's less dovish stance on policy: a 25 bp rate cut is already priced in. The probability of a December cut has fallen to 72.8% (from 91.1% a week ago). Powell emphasized that decisions depend on data, which is not available due to the shutdown.
The strong dollar (2-month highs) is putting pressure on gold. Weak data from China (PMI fell to 49.0) is reducing demand from the largest consumer.
The balance is tipping towards weak fundamentals...
Resistance levels: 4030, 4085
Support levels: 3982, 3955, 3915
Technically, bears are keeping the market below 4030 - strong resistance. If buyers enter the market (there are currently no fundamental reasons for this) and the bulls are able to break through 4030 and keep the price above this level, we will have a chance for growth. But under the current circumstances, I expect a correction to support before a possible rise.
Best regards, R. Linda!

GOLD TECHNICAL ANALYSIS: INTRADAY & SWING TRADING🔍 XAUUSD GOLD TECHNICAL ANALYSIS: COMPREHENSIVE DEEP DIVE FOR INTRADAY & SWING TRADING (NOV 3-7, 2025) 📊
Close Price Level: 4,003.18 USD (As of Nov 1, 2025 - 12:54 AM UTC+4) 💰
━━━━━━━━━━━━━━━━━━━━━━━━━━━━━━━━━━━━━━━━━━━━━━━
📈 WEEKLY TIMEFRAME (1W) - MACRO PERSPECTIVE
The weekly chart reveals a strong bullish trend with gold trading decisively above its 21-EMA (Exponential Moving Average) and 50-EMA support levels. Ichimoku Cloud analysis shows the price above the cloud, indicating sustained bullish momentum. Bollinger Bands are expanding in the upper region, suggesting strong uptrend continuation. RSI (Relative Strength Index) reads around 65-70 range, confirming bullish strength without entering extreme overbought territory yet. Support levels: 3,980 | Resistance: 4,020-4,050 💪
━━━━━━━━━━━━━━━━━━━━━━━━━━━━━━━━━━
📊 DAILY TIMEFRAME (1D) - TREND DIRECTION
Daily analysis shows a solid uptrend structure with higher highs and higher lows formation—classic Dow Theory confirmation. The price is consolidating near the upper zone between 4,000-4,010. Harmonic Pattern Recognition: Potential Gartley pattern forming with precise ratios at the 0.618 Fibonacci retracement. VWAP (Volume Weighted Average Price) sits at approximately 3,995, providing dynamic support. Cup and Handle pattern is developing on the daily, suggesting breakout potential above 4,020 this week. Volume profile shows institutional accumulation during dips. 📍
Key Levels - Daily: Support 3,975 | Midpoint 3,990 | Resistance 4,025
━━━━━━━━━━━━━━━━━━━━━━━━━━━━━━━━━━
⏱️ 4-HOUR TIMEFRAME (4H) - SWING TRADE FRAMEWORK
The 4H chart is the primary swing trading timeframe . Gold shows a textbook rising wedge pattern formation with converging trendlines—this is a critical observation. Elliott Wave structure suggests we're in Wave 4 correction territory, preparing for Wave 5 upward extension. Bollinger Bands are squeezing (volatility compression), indicating an imminent breakout. RSI at 55-60 shows balanced momentum with room for bullish push.
IMPORTANT: Watch the 4H support at 3,998 . A break below creates a bear trap opportunity. Alternatively, a breakout above 4,015 confirms wave 5 initiation.
Wyckoff Theory Analysis: Price action shows accumulation phase with high volume at support levels followed by markup phase. Volume trend is constructive. Exponential MA Cross: 20-EMA above 50-EMA = bullish setup locked in. 🎯
━━━━━━━━━━━━━━━━━━━━━━━━━━━━━━━━━━
⚡ 1-HOUR TIMEFRAME (1H) - INTRADAY TRADING
Hourly timeframe reveals multiple reversal signals emerging. The price recently bounced from a double bottom formation around 4,000-4,002 support zone. Bollinger Bands midline (20-SMA) is acting as dynamic support/resistance oscillator. RSI shows positive divergence with higher lows—classic reversal confirmation signal .
Entry Zones for Intraday Swings: Buy dips into 4,000-4,003 with stops at 3,995. Target 4,015 for quick 15-20 pips profit-taking. Ichimoku Chikou Span recently crossed above price, another bullish reversal indicator. Volume on recent upswings shows institutional participation. ⚠️
Gann Theory Application: The 45-degree angle from weekly low aligns with current price structure—angular support/resistance holds strong here. 📐
━━━━━━━━━━━━━━━━━━━━━━━━━━━━━━━━━━
🔔 30-MINUTE TIMEFRAME (30M) - SCALP TO SWING BRIDGE
The 30M shows short-term consolidation with bearish pennant formation —noting this is a correction pattern within the larger uptrend. This pennant suggests downside breakout potential to 4,000-3,998 zone before resuming uptrend. Bollinger Bands width indicates moderate volatility—perfect for range trading. RSI at 45-50 shows neutral zone , neither overbought nor oversold.
Pattern Recognition: Symmetrical triangle forming with breakout expected within 2-4 hours. Volume declining into consolidation—classic pre-breakout setup. VWAP at 3,992 provides secondary support if pennant breaks downward. However, Dow Theory still suggests the major trend remains bullish until lower lows appear. 🎪
Trading Range: 3,998-4,008 for scalpers this session.
━━━━━━━━━━━━━━━━━━━━━━━━━━━━━━━━━━
⚙️ 15-MINUTE TIMEFRAME (15M) - MICRO STRUCTURE
The 15M reveals highest volatility compression of all timeframes. This is the most dangerous zone for breakout traders. Bollinger Bands pinched to tightest range—explosion imminent. RSI bouncing between 40-60 shows indecision . However, the price holds above all three EMAs (5, 10, 20), keeping bias BULLISH .
Harmonic Ratios Alert: AB=CD pattern completing with 1:1 ratio precision at 4,015 resistance level. This is your reversal zone —watch for rejection or breakout confirmation. VWAP showing gradual upward slope, slight bullish edge. Volume oscillator trending higher despite price consolidation. 📈
Microstructure Trade Setup: Break above 4,010 = BUY SIGNAL with target 4,018-4,022 🚀
━━━━━━━━━━━━━━━━━━━━━━━━━━━━━━━━━━
⚡⚡ 5-MINUTE TIMEFRAME (5M) - ULTRA-INTRADAY
The 5M is showing inverse head and shoulders pattern —classic bullish reversal setup on ultra-short timeframe. Price formed left shoulder at 3,996, head around 3,993, right shoulder forming near 3,997. Neckline resistance at 4,002 = breakout target. Bollinger Bands in expansion mode with bullish candles forming. RSI already recovering above 50—momentum turning positive. ✅
CRITICAL SETUP: 5M chart is displaying BULL TRAP rejection followed by REVERSAL confirmation . This is your intraday traders' goldmine setup.
Volume surging on recent candles—institutional buyers stepping in. Ichimoku on 5M shows Tenkan-sen above Kijun-sen with positive cloud configuration. Exponential MAs all aligned bullish (5 > 10 > 20 > 50). This is textbook bullish alignment . 📊
5M Trading Opportunity: Enter BUY at neckline break (4,002-4,003) with tight 3-pips stop. Target 4,008-4,012 for quick scalp profits. ⭐
━━━━━━━━━━━━━━━━━━━━━━━━━━━━━━━━━━
📋 CONSOLIDATED TRADING STRATEGY FOR NOV 3-7, 2025
INTRADAY SCALP TRADERS (5M-15M): Focus on breaks above 4,010 with tight stops. Target quick 10-20 pips. Avoid trading below 4,000 support—risk/reward becomes unfavorable.
SWING TRADERS (1H-4H): Key decision point at 4,020 breakout level. If confirmed on 4H close, next target 4,050-4,075 range. Stop loss at 3,995 (weekly support). Holding period: 3-5 days.
POSITION TRADERS (1D-1W): Cup and Handle breakout completion expected. Once 4,020 breaks, potential move to 4,100+ within 2-3 weeks. This is accumulation phase completion.
━━━━━━━━━━━━━━━━━━━━━━━━━━━━━━━━━━
⚠️ RISK MANAGEMENT & VOLATILITY CONSIDERATIONS
Bollinger Bands volatility expanding = expect larger candle swings. Set wider stops accordingly.
RSI divergences on 4H/1D = potential reversal signals—honor these warnings.
Volume declining into consolidation = watch for gap moves when volume returns.
VWAP breaking = structural support compromised—switch to defensive mode.
Ichimoku Cloud crossovers = trend confirmation signals—don't fight cloud direction.
Maximum Leverage Recommendation: 1:5 ratio on this setup. Gold volatility demands respect. 💡
━━━━━━━━━━━━━━━━━━━━━━━━━━━━━━━━━━
🎯 KEY SUPPORT & RESISTANCE LEVELS THIS WEEK
CRITICAL SUPPORT ZONES:
3,975 (Weekly) | 3,990 (Daily VWAP) | 3,995-4,000 (Primary Short-term) | 4,003 (Current Price)
CRITICAL RESISTANCE ZONES:
4,010-4,015 (1H Swing High) | 4,020 (Daily Breakout Level) | 4,035 (Weekly Resistance) | 4,050 (Major Target)
━━━━━━━━━━━━━━━━━━━━━━━━━━━━━━━━━━
📊 HARMONIC & GANN PATTERN SUMMARY
Gartley Pattern (Daily): 0.618 retracement zone provides precision entry signals. Formation suggests completion wave incoming.
Gann Angles (4H): 45-degree support holding strong. Fan angles predict next resistance at 4,018-4,020.
Cup & Handle (1D): Breakout above handle resistance = confirmed. Target = height of cup (minimum 50 pips move = 4,050+).
Inverse Head & Shoulders (5M): Neckline at 4,002 is your battleground. Institutional accumulation visible.
━━━━━━━━━━━━━━━━━━━━━━━━━━━━━━━━━━
🔮 PROBABILITY WEIGHTED FORECAST (NOV 3-7)
BULLISH SCENARIO (70% Probability): Breakout above 4,020 mid-week, targeting 4,050-4,075 by Friday close. Volume confirmation required. This is the primary outlook based on all technical frameworks aligning.
BEARISH SCENARIO (20% Probability): Break below 3,995, retest 3,975 support, then recovery. This would create bear trap setup for aggressive buyers. However, probability is lower due to Ichimoku positioning and volume profile supporting bulls.
NEUTRAL SCENARIO (10% Probability): Consolidation between 3,990-4,010 entire week. Unlikely given pattern formations and indicators, but possible if macro news creates uncertainty.
━━━━━━━━━━━━━━━━━━━━━━━━━━━━━━━━━━
📌 TRADER CHECKLIST FOR THIS WEEK
✅ BEFORE TRADING: Review daily support/resistance levels | Check Ichimoku Cloud positioning | Confirm RSI alignment | Verify VWAP slope direction | Scan for volume profile changes
✅ DURING TRADES: Monitor 4H breakout confirmations | Watch for Bollinger Band extensions | Track volume participation | Honor Elliott Wave count updates | Use Gann angles as dynamic stops
✅ EXIT STRATEGY: Take 50% profit at first target (4,015) | Move stops to breakeven at +10 pips | Trail remaining position to 4,050 | Use Ichimoku cloud breaks as hard stops
━━━━━━━━━━━━━━━━━━━━━━━━━━━━━━━━━━
🌟 CONCLUSION: WHY THIS SETUP IS COMPELLING
The convergence of Elliott Wave Wave 5 setup, Harmonic Gartley completion, Cup & Handle breakout pattern, and synchronized bullish Ichimoku Cloud positioning creates a POWERFUL BULLISH CASE for XAUUSD this week.
Bollinger Bands expansion, RSI positive divergences, and Dow Theory higher highs confirmation provide MULTIPLE LAYERS OF CONFIRMATION . Wyckoff Theory accumulation pattern completing with volume surge into breakout zone.
The primary action this week: Watch 4,020 breakout on 4H timeframe. Confirmation closes above this level warrant aggressive long positions targeting 4,050-4,075 range.
Risk/Reward Ratio: 1:3.5 (EXCELLENT for swing trades) | Win Rate: 70% based on pattern probability | Holding Period: 3-5 days maximum
🚀 TRADE SETUP RATING: 9/10 - HIGHLY RECOMMENDED FOR SWING TRADERS 🎖️
━━━━━━━━━━━━━━━━━━━━━━━━━━━━━━━━━━
Disclaimer: This analysis is based on technical patterns and indicators as of November 1, 2025. Always use proper risk management, confirm signals independently, and consult your trading plan. Past performance doesn't guarantee future results. Trade responsibly.

XAU/USD (Gold Spot vs. U.S. Dollar) on the 30-minute timeframe..XAU/USD (Gold Spot vs. U.S. Dollar) on the 30-minute timeframe, using the Ichimoku Cloud with a clearly drawn ascending trendline providing support.
Here’s what’s visible:
Current price: around $4,002 – $4,009.
The price is sitting above the trendline and at the edge of the cloud, suggesting possible continuation to the upside if support holds.
A target point is drawn on your chart near $4,120.
✅ Target:
Primary Target Point: ≈ $4,120
That’s roughly a +110 to +120 point potential move from current levels.
If you want to manage risk:
Stop loss could be set just below the trendline or cloud base — around $3,975 – $3,980.
That gives a risk–reward ratio of roughly 1:3 depending on my entry.

ETH/USD (Ethereum vs. U.S. Dollar) 1-hour chart....ETH/USD (Ethereum vs. U.S. Dollar) 1-hour chart on TradingView, using the Ichimoku Cloud indicator.
Here’s what can be observed:
The current price is around $3,857.
There’s a descending trendline that has been broken to the upside — a potential bullish signal.
The price is inside the Ichimoku cloud, suggesting consolidation or a possible trend reversal.
Two target levels are marked on my chart:
First Target Point around $3,960 – $3,980
Second Target Point around $4,200 – $4,220
✅ Summary of Target Levels:
Target 1: ≈ $3,960
Target 2: ≈ $4,200
These appear to be my measured move or resistance targets based on the breakout projection from the cloud or prior swing levels.

Multiple time Standard Deviation PlaybackGoing over a playback looking at how a Standard Dev indicator works in finding levels of support and resistance. This helps to fins good areas to take profit or where price might just turn around. Good Pivotal points.

XAUUSD Breaks Out and Continues Its Bullish RallyOANDA:XAUUSD The market is still in a strong downtrend, yet the bearish momentum is gradually losing strength as a double bottom pattern begins to form, a classic signal that sellers are running out of steam.
After the second bottom took shape, buyers stepped in with growing confidence, and the price is now testing the neckline, confirming a structural shift toward a potential bullish reversal.
At this point, all eyes are fixed on the neckline. If a breakout above this level occurs, it will confirm the pattern and open the path for buyers to push the price higher toward 4,135.

Go Bold with Gold I’m expecting gold to rise from the current levels — around 4110.
The invalidation zone for this plan is marked in red on the chart

Gold - The most obvious top!🪙Gold ( TVC:GOLD ) will reverse soon:
🔎Analysis summary:
After we witnessed a major breakout back in 2024, Gold has been rallying about +120% ever since. However, Gold is now approaching a monster resistance trendline of the long term rising channel. It is really just a matter of time until Gold will create its official top.
📝Levels to watch:
$4,500
SwingTraderPhil
SwingTrading.Simplified. | Investing.Simplified. | #LONGTERMVISION

GBPCHF signs of rising.GBPCHF got strong before market close today and broke the RESISTANCE. We will see when markets reopen if it is a real BreakOut or FakeOut for a continuing the Uptrend


How to trade gold stably as the weekly and monthly charts close?#XAUUSD TVC:GOLD OANDA:XAUUSD
As we expected, gold broke through the previous strong resistance at 4030 and continued its bullish trend, reaching a high of 4046, very close to our target of 4050. Although the price of gold retreated somewhat after the brief surge, from the daily chart, the short-term price of gold is still above the MA5 moving average, while from the 4-hour chart, the middle band coincides with the MA20. Therefore, I don't think this means the bulls have given up; on the contrary, it's more like a way to better accumulate momentum at the bottom. This strategy remains effective, and we can still consider going long on gold when the price retraces to the 3985-3975 range.

GOLD 1H CHART ROUTE MAP UPDATE & TRADING PLAN FOR THE WEEKHey Everyone,
Please see our updated 1h chart levels and targets for the coming week.
We are seeing price play between two weighted levels with a gap above at 4134 and a gap below at 4090. We will need to see ema5 cross and lock on either weighted level to determine the next range.
We will see levels tested side by side until one of the weighted levels break and lock to confirm direction for the next range.
We will keep the above in mind when taking buys from dips. Our updated levels and weighted levels will allow us to track the movement down and then catch bounces up.
We will continue to buy dips using our support levels taking 20 to 40 pips. As stated before each of our level structures give 20 to 40 pip bounces, which is enough for a nice entry and exit. If you back test the levels we shared every week for the past 24 months, you can see how effectively they were used to trade with or against short/mid term swings and trends.
The swing range give bigger bounces then our weighted levels that's the difference between weighted levels and swing ranges.
BULLISH TARGET
4134
EMA5 CROSS AND LOCK ABOVE 4134 WILL OPEN THE FOLLOWING BULLISH TARGETS
4174
EMA5 CROSS AND LOCK ABOVE 4174 WILL OPEN THE FOLLOWING BULLISH TARGET
4236
EMA5 CROSS AND LOCK ABOVE 4236 WILL OPEN THE FOLLOWING BULLISH TARGET
4288
EMA5 CROSS AND LOCK ABOVE 4288 WILL OPEN THE FOLLOWING BULLISH TARGET
4331
EMA5 CROSS AND LOCK ABOVE 4331 WILL OPEN THE FOLLOWING BULLISH TARGET
4360
BEARISH TARGETS
4090
EMA5 CROSS AND LOCK BELOW 4090 WILL OPEN THE FOLLOWING BEARISH TARGET
4042
EMA5 CROSS AND LOCK BELOW 4042 WILL OPEN THE SWING RANGE
4122
4075
EMA5 CROSS AND LOCK BELOW 4075 WILL OPEN THE SECONDAARY SWING RANGE
3987
3939
As always, we will keep you all updated with regular updates throughout the week and how we manage the active ideas and setups. Thank you all for your likes, comments and follows, we really appreciate it!
Mr Gold
GoldViewFX

GOLD The Target Is DOWN! SELL!
My dear friends,
My technical analysis for GOLD is below:
The market is trading on 4022.7 pivot level.
Bias - Bearish
Technical Indicators: Both Super Trend & Pivot HL indicate a highly probable Bearish continuation.
Target - 4010.3
Recommended Stop Loss - 4030.0
About Used Indicators:
A pivot point is a technical analysis indicator, or calculations, used to determine the overall trend of the market over different time frames.
Disclosure: I am part of Trade Nation's Influencer program and receive a monthly fee for using their TradingView charts in my analysis.
———————————
WISH YOU ALL LUCK

EURUSD BUY SETUPI entered this deal
because we have strong zone
If this zone braked it would be signal for changing direction
and this indicate the strong of zone

( Gold Protocol ) Bearish After Break Detected Status: Active Reversal Protocol
Symbol: Gold
Session: London–New York Overlap (Smart Exit Window)
Confidence Level: ★★★★★ ( Hanzo Volume Detected )
☄️ Bearish After Break Out 4005
Reasons
1. Alpha Sequence Engaged
— Smart flow detected within Hanzo precision range.
2. Volume Window Synced
— Session energy aligns with internal volume pulse.
3. Liquidity Cycle Active
— Engineered sweep confirms smart money transition.
4. Time Lock Confirmed
— Market phase locked with directional intent.
5. Volume Map Aligned
— Cluster balance reveals real directional flow.
6. Hanzo Wick Detected
— Manipulation wick verified under Alpha filter.
⤵️Every like & comment on our TradingView posts helps us grow. More engagement means more exposure, which benefits everyone in the community!

GOLD | Bearish Momentum Holds Below Pivot Zone GOLD | Bearish Momentum Holds Below Pivot Zone
Gold remains under bearish pressure as it trades below the pivot zone at 4,034–4,053, signaling continued weakness amid cautious sentiment ahead of upcoming U.S. data.
🕯 Momentum remains negative, but a breakout above the pivot zone could quickly shift the tone back to bullish.
Key Levels
Pivot Zone: 4,034 – 4,053
Resistance: 4,082 · 4,105 · 4,189
Support: 4,004 · 3,982 · 3,921
Trading Plan:
Sell Setup: Shorts valid below 4,038, targeting 4,004 / 3,982 / 3,921.
Buy Setup: Longs valid only above 4,053, targeting 4,105 / 4,152.
Premium Takeaway
Gold remains in bearish control below 4,053, with potential to drop toward 3,982–3,921.
A confirmed 1H close above 4,053 would shift bias to bullish, opening the path toward 4,105–4,189 in the short term.

Gold pivotal level at 4067 resistanceGold remains in a neutral trend, with recent price action showing signs of a corrective pullback within the broader uptrend.
Support Zone: 3887 – a key level from previous consolidation.
A bullish rebound from resistance: 4067 would confirm ongoing upside momentum, with potential targets at:
4067 – initial resistance
4110 – psychological and structural level
4165 – extended resistance on the longer-term chart
Bearish Scenario:
A confirmed break and daily close below 3887 would weaken the bullish outlook and suggest deeper downside risk toward:
3844 – minor support
3790 – stronger support and potential demand zone
Outlook:
Neutral bias remains intact while the gold trades around pivotal 4067 level. A sustained break below or above this level could shift momentum.
This communication is for informational purposes only and should not be viewed as any form of recommendation as to a particular course of action or as investment advice. It is not intended as an offer or solicitation for the purchase or sale of any financial instrument or as an official confirmation of any transaction. Opinions, estimates and assumptions expressed herein are made as of the date of this communication and are subject to change without notice. This communication has been prepared based upon information, including market prices, data and other information, believed to be reliable; however, Trade Nation does not warrant its completeness or accuracy. All market prices and market data contained in or attached to this communication are indicative and subject to change without notice.

Gold Trade IdeaGold is testing back 4000. 2 additional resistances also share the 4000 so it will be a strong intraday resistance. The idea came with 3.14 RR.
