XAU/USD : Gold Breaks $4,000 Support – Can Bulls Hold the Line?By analyzing the Gold (XAUUSD) chart on the 2-hour timeframe, we can see that after rising to $4,138 and entering the marked supply zone, gold faced strong selling pressure and continued to drop, finally breaking below the $4,000 support and reaching $3,971.
As shown on the chart, this area is a key demand zone, and we expected a reaction here.
If gold manages to hold above the current level, we could see a short-term bounce toward $4,015. This analysis will be updated soon!
Please support me with your likes and comments to motivate me to share more analysis with you and share your opinion about the possible trend of this chart with me !
Best Regards , Arman Shaban
Gold

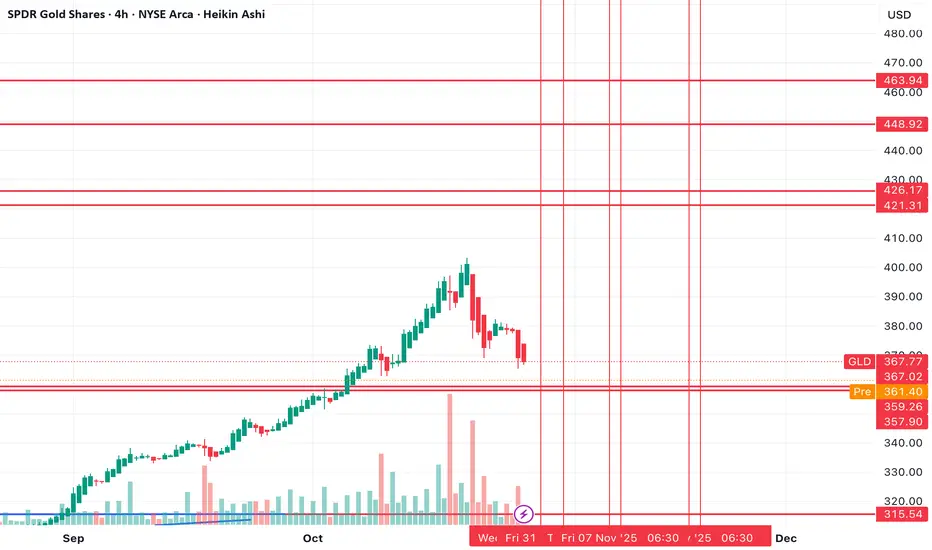
Buy the dip in GLD? Back above $400From a sentiment perspective, everyone is bearish GLD now that it's fallen so much over the last week. However, from the chart perspective, it looks like a great place to buy the dip.
If I turn on Bollinger bands, price is the furthest it's been outside of the bands to the downside from as far as I can see on the chart.
From an RSI standpoint, we're also still in extreme bullish areas on high timeframes. That makes me think that this is just a buy the dip scenario in a parabolic trend, and not the start of a larger selloff yet.
I think if we can hold these bottom support levels, the last leg higher will take us above $400. Likely to the first two resistance levels around the $420 area, but there's possibility that we can extend higher-- I've marked higher resistance levels off on the chart too. This should all play out before Nov 21st expiration.
Let's see how it plays out over the coming month or so.
XAUUSD: October 28th Market Analysis and StrategyGold Technical Analysis
Daily Resistance: 4005, Support: 3840
4-Hour Resistance: 3972, Support: 3840
1-Hour Resistance: 3950, Support: 3880
Divergence in technical indicators continues to intensify. After the weekly K-line price of spot gold falls below 4000, the next support level is near the 10-day moving average (MA10) around 3840.
The daily K-line shows a temporary peaking signal, intensifying short-term market sell-off sentiment. After breaking below the 3950 support level, the market trend has shifted. The next target is the 3800/3700 level.
Based on the 1-hour chart, gold generally conforms to yesterday's analysis. After the K-line combination broke through the trend support, the downward trend accelerated. The decline widened in the European session, with the price falling below the 3900 mark! Bulls' last hope lies in Thursday's Federal Reserve interest rate decision. Sell on rallies in the near term.
SELL: 3930-3945
BUY: 3835-3845

Gold is dead. Long live Gold.CAPITALCOM:GOLD is dead. There will be no more political turmoil. Debt is gone. Money printers have completed their benevolent work.
$3500ish seems like a nice golden level. Emphasis on the ISH.

GOLD | Bearish Bias Holds Below $3,944 Amid Trade OptimismGOLD – MARKET OVERVIEW | Trades Below $4,000 as Risk Appetite Rises
Gold continues to slide, as optimism over a potential U.S.–China trade deal and improving global outlook weakens demand for safe-haven assets.
The metal is now down nearly 10% from its all-time high of $4,377 (Oct 20), with the recent rally losing steam as traders take profits amid signs of progress in trade negotiations between the world’s two largest economies.
Technical Overview
Gold dropped nearly $150, exactly as projected in our previous outlook.
The price remains under bearish pressure while below 3,944, targeting 3,893, and a break below that could extend the decline toward 3,855 → 3,818.
However, a 1H close above 3,944 would indicate a potential reversal, opening the way for a retest of 3,970 → 4,011.
Key Technical Levels
Pivot Zone: 3,932 – 3,944
Support: 3,893 · 3,855 · 3,819
Resistance: 3,970 · 4,011 · 4,053
Outlook:
Gold stays bearish below 3,944, with downside potential toward 3,855 if trade optimism persists.
Only a confirmed 1H close above 3,944 would shift bias back to short-term bullish toward 4,011.

Gold (XAUUSD): Please wait for the correction to completeGold (XAUUSD): Please wait for the correction to complete. Market in HTF is bullish. Any sell opportunity is risky, although I missed a good one yesterday. Wait for the correction to complete. A good reaction to the highlighted area a good sign that gold will turn to bullish in MTF and LTF soon. Be patient.
Cheers

THE KOG REPORTTHE KOG REPORT:
In last week’s KOG Report we said we would be looking at two levels as potential for the long trades and target for the short trades. We ideally wanted price to push upside and complete the long target before turning and then completing the short target. During the early part of the week, we activated short and gave caution on longs only to see the aggressive decline which hit our short target and completed our bias level and red box targets for the week.
All in all, a decent week in Camelot with Excalibur guiding and the EA hitting another full house of completed targets on Gold.
So, what can we expect in the week ahead?
We're pondering on this bearish move and it’s giving us hints of a swing low so for that reason we’ve given the red box bias level at 4095 which will need to break for us to see a continuation of the move. Above there, we have immediate support at 4104 which if held can give us another bounce in the early sessions giving us a move upside into the 4140-50 regions initially.
Above that level there is a level sticking out sitting at 4173 with the extension level 4192 which if targeted is the level to keep an eye on for us. A break above there and it’s likely we will attempt to swing high from a lot higher up which we will need to navigate level to level. But a RIP there would be ideal if it happens with a clean reversal.
On the flip, we do want to see lower pricing on gold as we feel it’s not only needed, but it will give buyers better opportunities to get in for better positioning to carry trades upside into the higher target levels we have active. As we approach the end of the month, it's going to be another whipsaw and we would hope to complete the move, or, we'll most likely see some sideways accumulation leading into the next week.
KOG’s bias for the week:
Bullish above 4095 with the ideal target 4274
Bearish below 4095 with the ideal target 4025
RED BOX TARGETS:
Break above 4115 for 4123, 4125 and 4140 in extension of the move
Break below 4095 for 4080, 4065 and 4050 in extension of the move
Please do support us by hitting the like button, leaving a comment, and giving us a follow. We’ve been doing this for a long time now providing traders with in-depth free analysis on Gold, so your likes and comments are very much appreciated.
As always, trade safe.
KOG

GOLD: Long Signal with Entry/SL/TP
GOLD
- Classic bullish setup
- Our team expects bullish continuation
SUGGESTED TRADE:
Swing Trade
Long GOLD
Entry Point - 3901.6
Stop Loss - 3884.4
Take Profit - 3938.6
Our Risk - 1%
Start protection of your profits from lower levels
Disclosure: I am part of Trade Nation's Influencer program and receive a monthly fee for using their TradingView charts in my analysis.
❤️ Please, support our work with like & comment! ❤️

Gold at a Critical Crossroad: Bounce or Breakdown Ahead?Hi!
The gold price is currently trading around $4,042, sitting just above a critical support area near $3,953.80. This gray zone is a key decision point for the next major move.
Trend Structure:
The broader trend remains bullish, moving within a well-defined ascending channel.
Double Top Formation:
A short-term double top has formed near recent highs, triggering a corrective move down into the channel’s midline and the gray support area.
Critical Support Zone ($3,953.80):
This level aligns with previous structure support and the channel’s bottom, making it a high-probability reaction zone.
________________
Scenario 1: Bullish Reaction (Primary Scenario)
If gold holds above the gray critical area and bounces within the ascending channel, we could see a renewed bullish wave.
Confirmation: A strong bullish reaction or higher low around $3,953–$3,980.
Target: The green target zone around $4,619.57, corresponding to the upper channel boundary and a potential measured move from the recent correction.
Scenario 2: Bearish Breakdown
If the gray area fails to hold, it could signal deeper downside momentum.
Trigger: A clean break and 4H close below $3,953.80.
Target: The pink support zone near $3,656.01, which aligns with prior accumulation and the lower channel boundary.
________________
Disclaimer: As part of ThinkMarkets’ Influencer Program, I am sponsored to share and publish their charts in my analysis.

XAUUSD: Bullish Reversal Setup From Triangle SupportHello everyone, here is my breakdown of the current Gold setup.
Market Analysis
Gold (XAUUSD) continues to trade within a larger bullish market structure, maintaining higher lows above its key ascending Trend Line. After a strong impulsive rally that pushed the price above the 4,200 resistance, the market faced rejection near the top of the Range and entered a corrective phase. This correction evolved into a triangle pattern, with price now testing the Triangle Support Line, aligning closely with the horizontal Support area around 4,020 – 4,000 — a historically important demand zone.
Currently, the price is consolidating near the lower boundary of this structure, showing early signs of stabilization. This region also coincides with the previous breakout point, adding further confluence for potential buyer interest.
My Scenario & Strategy
I expect the price to hold above the Triangle Support Line and form a bullish reversal structure, signaling that buyers are once again defending this level. A confirmed breakout above the Triangle Resistance Line would indicate renewed bullish momentum and a potential continuation of the overall uptrend.
My primary target zone lies around 4,215, where previous resistance and the upper range boundary converge. However, if the support near 4,000 fails to hold, it could trigger a deeper correction toward 3,950, where the next demand zone is located. This setup offers a favorable risk-to-reward opportunity for traders anticipating a rebound from a major technical confluence zone.
That's the setup I'm tracking. Thank you for your attention, and always manage your risk.

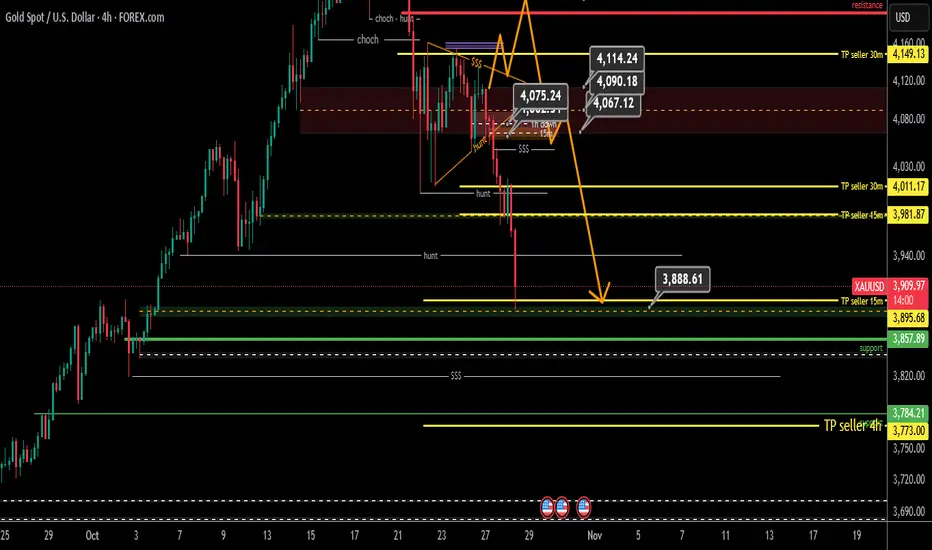
Update Two 4-Hour Gold Analysis
Hello Traders
So far, yesterday's analysis target has been touched, but the seller is still present in the market, and today the 4-hour seller entered the market, and the long-term 4-hour analysis that we had last week gained more strength, the 4-hour sellers target was defined as 3773, which was explained in the relevant post about the entry of sellers. So, every pullback will still have more sellers in the market. For the sell, all the yellow lines of the TPs settled by the candlestick failure act as current resistance and are considered the pullback zone.
Good luck.
Links to the two analyses:
Gold. Possible find temporary support. 28/Oct/25Xauusd possible at its temporary support zone at 3900 +/- while waiting for FED and Japan rate decisions meeting 30 Oct.

XAUUSD - Will Gold Continue to Fall?!Gold is trading below the EMA200 and EMA50 on the 30-minute timeframe and is trading in its descending channel. The reduction in its downward momentum in the demand range will provide us with a better risk-reward buying position. A move towards the supply range above the channel will be our next short trade!
Gold prices fell below $4,000 per ounce for the first time since October 10, following a sharp $125 decline.
According to a Reuters survey, the average gold price in 2026 is expected to reach $4,275 per ounce, while silver prices are projected to average $50 per ounce in the same year.
For 2025, the survey anticipates an average gold price of $3,400, up from $3,220 in the previous poll, while the average silver price is forecasted to rise to $38.45 from $34.52 previously.
Analysts at Nomura stated that U.S.–China relations have entered a repetitive cycle of tension, escalation, and temporary détente, likely forming a “new normal” in the long term.
Lu Ting, Nomura’s chief China economist, noted that the world’s two largest economies appear to be settling into a predictable pattern of “strain–escalation–pause”, which may define the framework of their relationship in the foreseeable future.
Recent trade talks in Kuala Lumpur hinted at a temporary easing of friction, with both sides reportedly considering limited concessions, such as extending tariff suspensions and resuming soybean imports from the U.S.
However, deep-seated disputes remain unresolved — including export restrictions on rare earth elements, compliance with trade commitments, and broader geopolitical disagreements — all of which cloud the outlook for bilateral relations.
Lu cautioned that while short-term cooperation may continue due to mutual economic dependence, long-term strategic competition between Washington and Beijing is expected to intensify.
Nomura believes this recurrent cycle of conflict and reconciliation will likely become the enduring pattern of U.S.–China relations.
Such a backdrop implies persistent volatility in global markets, particularly in commodities and technology sectors, which are highly sensitive to trade developments between the two nations.
Investors should prepare for alternating periods of optimism and renewed tension.
Meanwhile, Donald Trump’s proposed tariffs against Canada may turn into a major self-inflicted setback, as the move faces both a legal challenge before the U.S. Supreme Court and bipartisan opposition.
Next week, the Supreme Court is set to hear a case focusing on Trump’s use of the International Emergency Economic Powers Act (IEEPA) to justify these tariffs. Trump initially invoked an emergency declaration related to fentanyl to impose them — despite the fact that such powers are typically reserved for sanctions against U.S. adversaries.
The case represents not only a test of the tariffs’ legality, but also a measure of Trump’s and MAGA’s influence over the Court.
Notably, Senator Lisa Murkowski, a Republican, joined over 200 Democrats in sending a letter to the justices urging them to strike down the tariffs.
The oral arguments are scheduled for November 5, and the final ruling, which could serve as a major market mover, is expected sometime next year.
Currently, prediction markets estimate a 38% probability that the tariffs will be overturned.
At the same time, Morgan Stanley reported that U.S. dollar positioning has turned positive for the first time in several months, reflecting renewed investor confidence in the U.S. economic outlook.
This shift comes amid rising political instability in Japan and France, which has diminished the appeal of non-dollar assets and strengthened capital flows toward the greenback.
Strategists at the bank added that demand for downside protection against the dollar has declined, indicating that investors perceive a low risk of a sharp correction in the near term.
Nevertheless, Morgan Stanley warned that this uptrend might not be sustainable — if U.S. economic data, particularly employment figures, fail to show significant improvement, the dollar could again face renewed downward pressure, and rate-cut expectations from the Federal Reserve could rise.
Finally, Treasury Secretary Scott Bassent confirmed that five candidates have been shortlisted to succeed Jerome Powell as Federal Reserve Chair:
Christopher Waller, Michelle Bowman, Kevin Warsh, Kevin Hassett, and Rick Rieder.
Bassent stated that one more round of interviews will take place, and he plans to submit the final shortlist to President Trump after Thanksgiving, with a final decision expected before year-end.

GOLD - Sell off when u see a crowd entering - always workingGOLD - Sell off when u see a crowd entering - always working
New that in Argentina people buying al ot of phisical GOLD was a perfect signal of retail FOMO
$3400 isa key support

Gold Market Update: Correction Mode 3750/3500 USD possible🟡 Where We Are Right now
After ripping to fresh records, gold snapped hard — WSJ logged the steepest one-day loss in years last week and a follow-through weekly drop as longs unwound.
Analysts across Kitco and others frame this as a technical/positioning correction after a parabolic run, with a fight around the $4k handle and scope to probe $3,750 → $3,500 if selling persists.
Sentiment/flows flipped: GLD and other gold ETFs saw notable outflows into the selloff after heavy YTD inflows. That flow reversal is consistent with a near-term correction phase.
🔻 Why the Market Is Correcting Now
1️⃣ Positioning & Froth Unwinds
The rally attracted outsized speculative length; once momentum cracked, forced de-risking kicked in. WSJ called out “long unwind” dynamics; Kitco says the correction could persist for months as near-term drivers fade.
2️⃣ $4k Failed on First Retest; Technical Break Triggered Stops
Kitco flagged a “fight for $4k” with downside risk if that shelf gives. Once sub-4k prints hit, systematic sellers likely accelerated.
3️⃣ Flow Flip in ETFs
After massive 2025 inflows, GLD posted a sharp daily outflow during the drop — classic late-cycle reversal behavior for a momentum move.
4️⃣ Macro Balance Less Supportive at the Margin
Even with long-term tailwinds (deficits/geopolitics), the recent leg higher ran ahead of fundamentals. Kitco and others note easing physical tightness and cooling central-bank buying pace compared with earlier in the year, removing a key prop for spot.
⚙️ Near-Term Levels That Matter (Tactical)
$4,000 → Battle zone. Regaining and holding above turns near-term tone neutral.
$3,750 → First meaningful downside target; aligns with multiple analysts’ “healthy pullback” zone.
$3,500 → Deeper correction magnet if flows/positioning continue to bleed; widely discussed as a plausible washout level.
🔮 4–8 Week Catalyst Map (What Can Push Price)
🏛️ Macro / Policy
Treasury Quarterly Refunding (Nov 5): Mix/size guidance can sway the long-end, USD, and real yields — key for gold. A heavier bill tilt (and steady coupons) is less threatening than a surprise coupon ramp.
Fed Communication Cadence: With the Oct 28–29 FOMC just occurred, watch minutes (Nov 19) + any guidance shifts. A less-dovish tone or firmer real yields = near-term headwind; growth scares or easing bias = support.
US Data Prints: CPI/PCE, NFP, ISM — anything that re-prices the path of real rates. (Direction of real yields remains the single most important macro input.)
💰 Flows & Positioning
ETF Flows (GLD/IAU): Continued outflows would confirm distribution; a turn back to net inflows often leads price inflections.
COT Positioning: If spec length compresses materially, downside fuel diminishes — setting up a cleaner base. (Track weekly CFTC updates.)
🪙 Physical / Seasonal
India Demand (festive/wedding season) and China retail demand can stabilize spot if discounts narrow and premiums re-emerge, but Kitco notes near-term tightness has eased versus the squeeze earlier in the rally.
📈 Base Case Outlook (Next 4–8 Weeks)
Trend: We’re in a bull-market correction — momentum currently with sellers — inside a bigger, intact secular uptrend. WSJ + Kitco both frame it as a technical consolidation after a near-vertical ascent.
Range Expectation: $3,500–$4,100 with whipsaws around $4k. The market likely tests $3,750 and could overshoot to $3,500 on negative macro surprises or persistent outflows before attempting a higher-low base.
Bull Re-acceleration Triggers:
(a) USD/real-yield rollover post-Refunding/Fed minutes
(b) A visible reversal in ETF flows
(c) Stabilization in Asia physical premiums
(d) Fresh geopolitical shocks
Bear Extension Risks:
(a) Firmer real yields / stronger USD
(b) Deeper ETF outflows and CTA/systematic supply
(c) Evidence of slower central-bank demand than H1
(d) Soft physical uptake into dips
⚔️ Trade / Hedge Tactics
If Underweight/Flat:
Stagger bids $3,760 → $3,520, scale size smaller into weakness; insist on confirmation (stops above prior day’s high) before adding.
If Long From Higher:
Respect $3,750 — below it, tighten or partially hedge (short miners, long USD vs. FX beta, or buy short-dated puts) targeting $3,500 as a potential flush.
If Momentum Trader:
Let $4,000 decide regime. Sustained reclaims with rising on-balance volume/ETF creations = green light for a bounce to $4,080–$4,150; failure = fade rallies into $3,950–$3,980.
🧭 What I’m Watching Day-to-Day
1️⃣ Treasury refunding headlines (Nov 5) and term-premium reaction.
2️⃣ Fed minutes (Nov 19) and any shift in balance-of-risks language.
3️⃣ GLD/IAU flow tape (creations/redemptions).
4️⃣ Kitco/WSJ desk color on physical tightness and dealer inventories.

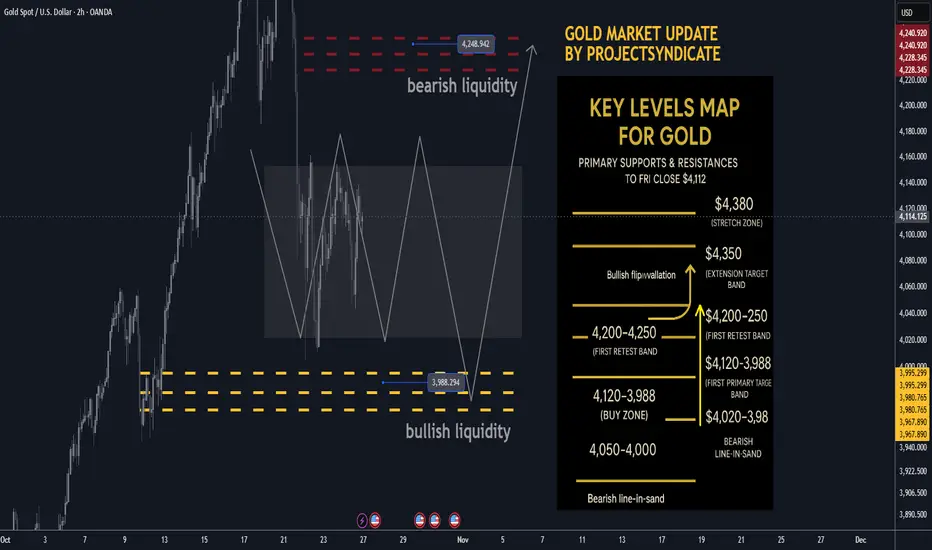
Gold next week Key S/R Levels and Outlook for Traders🔥 GOLD WEEKLY SNAPSHOT — BY PROJECTSYNDICATE
🏆 High/Close: $4,380 → ~$4,112 — lower close within range; momentum cooled but holding the $4,000 handle.
📈 Trend: Uptrend intact > $4,000; oversold into $4.1k—setup favors reflex bounce.
🛡 Supports: $4,120–$4,080 → $4,020–$3,988 (bullish liquidity) → $4,000/3,980 must hold.
🚧 Resistances: $4,200 / $4,250 (bearish liquidity) / $4,300 → stretch $4,350–$4,380.
🧭 Bias next week: Buy-the-dip $4,020–$3,988; momentum regain above $4,200 targets $4,250 → $4,300–$4,350. Invalidation < $3,980 risks a deeper flush to $3,950.
🌍 Macro tailwinds:
• Policy: Easing real yields supportive on dips.
• FX: Softer USD tone = constructive backdrop.
• Flows: Central-bank buying + tactical ETF interest underpin $4k.
• Geopolitics: Trade/tariff & regional tensions keep safety bids alive.
🎯 Street view: Select houses still float $5,000/oz by 2026 on policy easing & reserve-diversification narratives.
________________________________________
🔝 Key Resistance Zones
• $4,200–$4,230 immediate supply from the weekly close
• $4,250 bearish liquidity / primary target
• $4,300–$4,350 extension band
• $4,380 prior spike high / stretch
🛡 Support Zones
• $4,120–$4,080 first retest band below close
• $4,020–$3,988 buy zone (bullish liquidity)
• $4,000 / $3,980 must-hold shelf
________________________________________
⚖️ Base Case Scenario
Expect pullbacks into $4,120–$4,080 and $4,020–$3,988 to attract buyers, rotating price back toward $4,200 then $4,250. Acceptance above $4,250 invites a drive into $4,300–$4,350.
🚀 Breakout Trigger
A sustained push/acceptance > ~$4,250 unlocks $4,300 → $4,350, with room toward $4,380 if momentum persists.
💡 Market Drivers
• Real-yield drift lower (supportive carry backdrop)
• USD softness aiding metals
• Ongoing CB accumulation; ETF flows stabilizing on dips
• Headline risk (trade/geopolitics) sustaining safe-haven demand
🔓 Bull / Bear Trigger Lines
• Bullish above: $4,020–$4,100 (buyers defend pullbacks)
• Bearish below: $3,980 (risk expands; threatens $3,950)
🧭 Strategy
Buy low from bullish liquidity (~$3,988) with a target at $4,250; oversold conditions favor a strong bounce. Add on strength above $4,200 toward $4,300–$4,350. Keep risk tight below $3,980–$4,000 to invalidate.
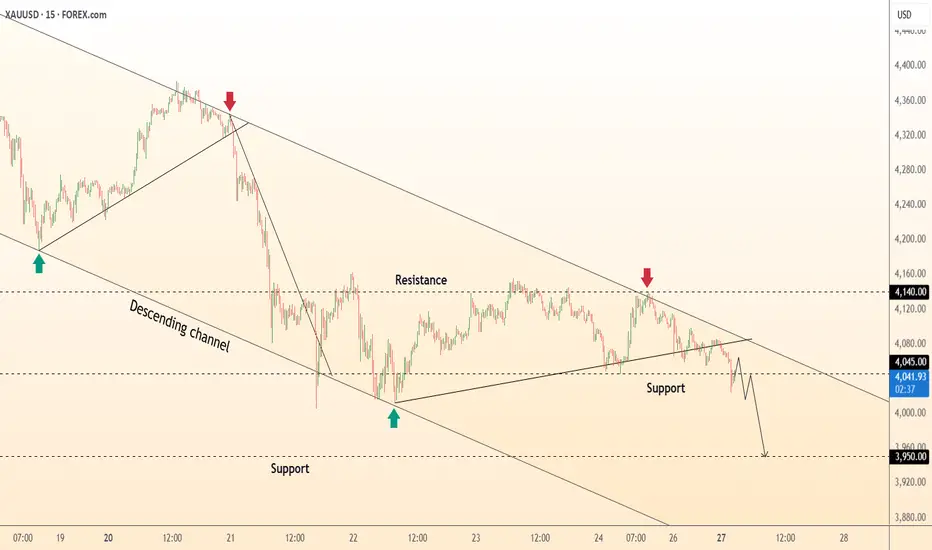
DeGRAM | GOLD is declining in the channel📊 Technical Analysis
● XAU/USD remains confined within a descending channel, forming consistent lower highs and lows, reinforcing bearish control.
● Price recently rejected the 4,140 resistance and is targeting the 3,950 support zone, confirming short-term continuation within the channel structure.
💡 Fundamental Analysis
● Gold faces pressure from a stronger USD and rising Treasury yields, as traders scale back expectations of early Fed rate cuts.
✨ Summary
● Short bias below 4,140; targets 4,000–3,950. Technical rejection and macro strength in USD sustain bearish momentum.
-------------------
Share your opinion in the comments and support the idea with a like. Thanks for your support!
Gold Preparing to Continue Its Bullish Move After ConsolidationHello traders, I want share with you my opinion about Gold. Gold has maintained a strong bullish structure over the recent period, forming a clear ascending channel that has been respected multiple times. Each correction has been followed by strong bullish impulses, confirming that buyers remain in control of the long-term direction. After reaching the 4,368 Resistance Level — which coincides with the upper boundary of the channel — the market entered a range phase, signaling consolidation after an extended rally. The current price action has formed a secondary support zone near 4,050 – 4,080, also aligned with the ascending support line of the broader channel. Currently, the price is moving inside a range structure (Buyer Zone to Seller Zone), consolidating just above the main ascending support line. In my opinion, this area represents a critical accumulation zone, where buyers are likely preparing for another upward push. I expect that after testing the Buyer Zone, the price will find strong support and initiate a new bullish wave toward the Seller Zone and the Resistance Level at 4,368. A confirmed breakout above the resistance line of the local descending structure would validate this bullish continuation scenario. Please share this idea with your friends and click Boost 🚀

Gold Price Analysis (XAU/USD) – October 28, 2025Gold continues its bearish momentum, forming a clear lower-high structure after multiple failed attempts to break the resistance area around $4,075–4,085. The market has been respecting a descending trendline, signaling sustained selling pressure from institutional traders.
At the moment, price is retesting the $3,930–3,935 zone — a key short-term support level that coincides with previous liquidity grabs. A decisive break below $3,922 could open the door toward the next demand zone near $3,830–3,805, where buyers may attempt a technical rebound.
Technical Highlights:
Trend: Bearish bias remains intact below $3,970.
Resistance levels: $3,970 / $4,025 / $4,085
Support levels: $3,922 / $3,880 / $3,830
Indicators: Price remains below EMA20 and EMA50 on H1, while RSI hovers near oversold — suggesting a potential short-term pullback before further decline.
Trading Strategy:
Traders could look for short opportunities on minor pullbacks toward the $3,950–3,960 area, maintaining a stop above $3,970 and targeting the $3,830–3,805 zone.
Conservative traders may wait for a confirmed close below $3,922 before joining the bearish leg.
Overall, the structure still favors the downside unless price breaks and sustains above $3,970.
- Stay alert to macro catalysts — especially upcoming U.S. data releases that could influence the dollar and bond yields.

Gold Elliott Wave Analysis – Potential Wave (4) Completion ZoneGold (XAU/USD) on the daily chart appears to be completing a classic Elliott Wave 5-wave impulse structure. After a strong rally into the wave (3) high, price is currently retracing toward the projected wave (4) correction zone.
The highlighted support area aligns with key Fibonacci retracement levels:
0.5 retracement: around $3,845
0.618 retracement: around $3,718
This region also coincides with the lower boundary of the ascending channel, adding confluence for potential bullish reversal.
If wave (4) finds support within this zone and maintains structure, a new impulsive rally toward wave (5) could begin — targeting the upper trendline resistance near $4,500–$4,600.

GOLD outcome.XAUUSD has been falling and now at a SUPPORT zone. Waiting for confirmation if it will rise in the London session or keep falling.

XAUUSD H4 | Potential Bearish Drop Off?Based on the H4 chart analysis, we could see the price rise to the sell entry at 4,053.43, which is an overlap resistance and could reverse from this level to the take profit.
Stop loss is at 4,149.54, which is a pullback resistance.
Take profit is at 3,690.65, which is a pullback support that is slightly below the 61.8% Fibonacci retracement.
Stratos Markets Limited (tradu.com ):
CFDs are complex instruments and come with a high risk of losing money rapidly due to leverage. 68% of retail investor accounts lose money when trading CFDs with this provider. You should consider whether you understand how CFDs work and whether you can afford to take the high risk of losing your money.
Stratos Europe Ltd (tradu.com ):
CFDs are complex instruments and come with a high risk of losing money rapidly due to leverage. 70% of retail investor accounts lose money when trading CFDs with this provider. You should consider whether you understand how CFDs work and whether you can afford to take the high risk of losing your money.

Gold Price Analysis - Gold Breakout Levels 4200 vs 4040Gold is trading inside a tightening rising channel after forming a strong higher timeframe rejection from the ATH which pushed price into a corrective phase. Buyers have repeatedly defended the strong support zone near 4000-3980 creating a false breakout low followed by a controlled recovery showing that demand remains active.
However, each rally into the weak-high resistance at 4160-4200 has shown fading momentum meaning sellers are still protecting this zone aggressively. Until price breaks out with a clean close and retest above this resistance gold will remain in a neutral to slightly bullish consolidation phase driven by stop hunts and choppy movements inside the channel.
A successful breakout above 4200 can trigger a bullish continuation toward 4240 then 4320-4360 and possibly back to the ATH zone while a breakdown below 4040 rising support would shift the structure bearish again exposing the 3980 demand and potentially a deeper drop to 3900 if buyers fail there.
In simple terms buyers still control support, sellers still control resistance and the next big move will come once one of these critical levels breaks with strength.
✅ Option 1-Strong Bullish Bias
Gold is still respecting the rising channel and defending the strong support zone around 4000-3980. As long as price stays above the rising trendline bullish structure remains valid. A clean breakout above 4160-4200 will confirm continuation toward 4240 → 4320 → ATH retest. Buyers are still in the game, waiting for the breakout.
✅ Option 2-Neutral to Bullish
Gold is consolidating inside a rising channel after rejecting the ATH. Support remains strong around 4000-3980 while sellers continue to defend 4160-4200. A breakout on either side will define the next major move. Above 4200 bullish continuation toward 4240 and 4320+. Below 4040 deeper pullback toward 3980 and possibly 3900.
✅ Option 3-Neutral to Bearish
Gold is struggling to break above 4160-4200 showing seller strength at the top of the range. If price fails again and breaks below the rising channel near 4040 downside can accelerate toward 3980 and 3900 for liquidity. Bulls must hold support to avoid a deeper correction.
Gold remains trapped between 4040 support and 4200 resistance inside a rising wedge. Buyers holding strong at the bottom but sellers still defending the top. Break above 4200 bullish continuation toward 4320. Break below 4040 bearish move to 3980-3900. Still a range waiting for breakout confirmation.
Note
Please risk management in trading is a Key so use your money accordingly. If you like the idea then please like and boost. Thank you and Good Luck!
