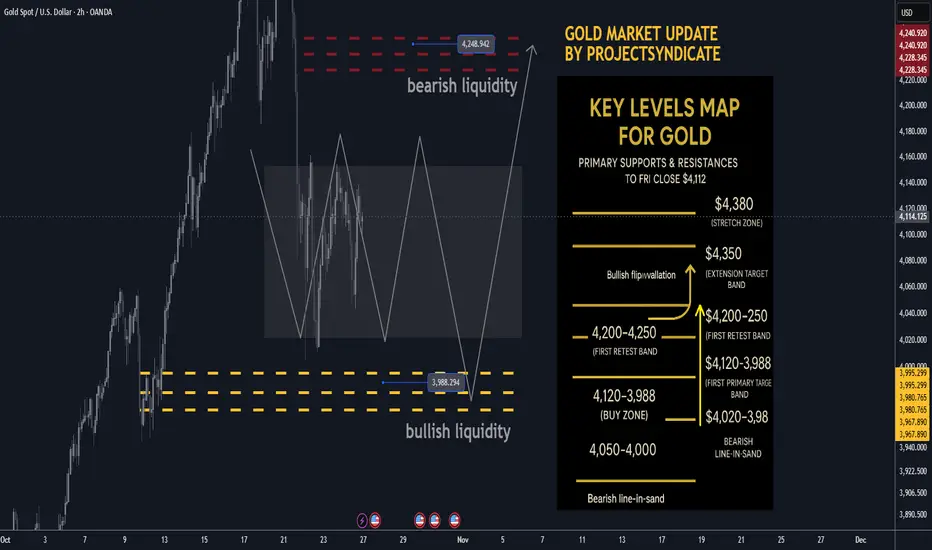
Gold next week Key S/R Levels and Outlook for Traders🔥 GOLD WEEKLY SNAPSHOT — BY PROJECTSYNDICATE
🏆 High/Close: $4,380 → ~$4,112 — lower close within range; momentum cooled but holding the $4,000 handle.
📈 Trend: Uptrend intact > $4,000; oversold into $4.1k—setup favors reflex bounce.
🛡 Supports: $4,120–$4,080 → $4,020–$3,988 (bullish liquidity) → $4,000/3,980 must hold.
🚧 Resistances: $4,200 / $4,250 (bearish liquidity) / $4,300 → stretch $4,350–$4,380.
🧭 Bias next week: Buy-the-dip $4,020–$3,988; momentum regain above $4,200 targets $4,250 → $4,300–$4,350. Invalidation < $3,980 risks a deeper flush to $3,950.
🌍 Macro tailwinds:
• Policy: Easing real yields supportive on dips.
• FX: Softer USD tone = constructive backdrop.
• Flows: Central-bank buying + tactical ETF interest underpin $4k.
• Geopolitics: Trade/tariff & regional tensions keep safety bids alive.
🎯 Street view: Select houses still float $5,000/oz by 2026 on policy easing & reserve-diversification narratives.
________________________________________
🔝 Key Resistance Zones
• $4,200–$4,230 immediate supply from the weekly close
• $4,250 bearish liquidity / primary target
• $4,300–$4,350 extension band
• $4,380 prior spike high / stretch
🛡 Support Zones
• $4,120–$4,080 first retest band below close
• $4,020–$3,988 buy zone (bullish liquidity)
• $4,000 / $3,980 must-hold shelf
________________________________________
⚖️ Base Case Scenario
Expect pullbacks into $4,120–$4,080 and $4,020–$3,988 to attract buyers, rotating price back toward $4,200 then $4,250. Acceptance above $4,250 invites a drive into $4,300–$4,350.
🚀 Breakout Trigger
A sustained push/acceptance > ~$4,250 unlocks $4,300 → $4,350, with room toward $4,380 if momentum persists.
💡 Market Drivers
• Real-yield drift lower (supportive carry backdrop)
• USD softness aiding metals
• Ongoing CB accumulation; ETF flows stabilizing on dips
• Headline risk (trade/geopolitics) sustaining safe-haven demand
🔓 Bull / Bear Trigger Lines
• Bullish above: $4,020–$4,100 (buyers defend pullbacks)
• Bearish below: $3,980 (risk expands; threatens $3,950)
🧭 Strategy
Buy low from bullish liquidity (~$3,988) with a target at $4,250; oversold conditions favor a strong bounce. Add on strength above $4,200 toward $4,300–$4,350. Keep risk tight below $3,980–$4,000 to invalidate.
Gold
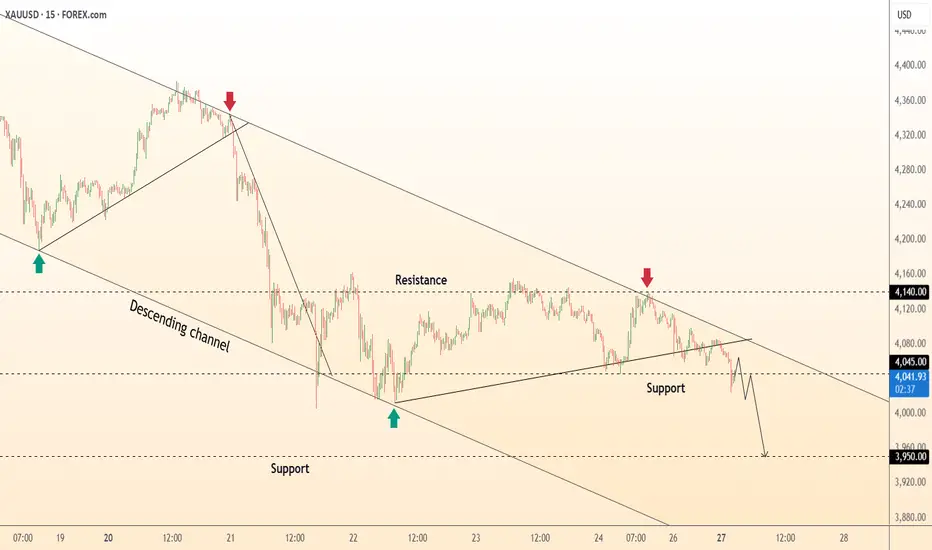
DeGRAM | GOLD is declining in the channel📊 Technical Analysis
● XAU/USD remains confined within a descending channel, forming consistent lower highs and lows, reinforcing bearish control.
● Price recently rejected the 4,140 resistance and is targeting the 3,950 support zone, confirming short-term continuation within the channel structure.
💡 Fundamental Analysis
● Gold faces pressure from a stronger USD and rising Treasury yields, as traders scale back expectations of early Fed rate cuts.
✨ Summary
● Short bias below 4,140; targets 4,000–3,950. Technical rejection and macro strength in USD sustain bearish momentum.
-------------------
Share your opinion in the comments and support the idea with a like. Thanks for your support!
Gold Preparing to Continue Its Bullish Move After ConsolidationHello traders, I want share with you my opinion about Gold. Gold has maintained a strong bullish structure over the recent period, forming a clear ascending channel that has been respected multiple times. Each correction has been followed by strong bullish impulses, confirming that buyers remain in control of the long-term direction. After reaching the 4,368 Resistance Level — which coincides with the upper boundary of the channel — the market entered a range phase, signaling consolidation after an extended rally. The current price action has formed a secondary support zone near 4,050 – 4,080, also aligned with the ascending support line of the broader channel. Currently, the price is moving inside a range structure (Buyer Zone to Seller Zone), consolidating just above the main ascending support line. In my opinion, this area represents a critical accumulation zone, where buyers are likely preparing for another upward push. I expect that after testing the Buyer Zone, the price will find strong support and initiate a new bullish wave toward the Seller Zone and the Resistance Level at 4,368. A confirmed breakout above the resistance line of the local descending structure would validate this bullish continuation scenario. Please share this idea with your friends and click Boost 🚀

Gold Price Analysis (XAU/USD) – October 28, 2025Gold continues its bearish momentum, forming a clear lower-high structure after multiple failed attempts to break the resistance area around $4,075–4,085. The market has been respecting a descending trendline, signaling sustained selling pressure from institutional traders.
At the moment, price is retesting the $3,930–3,935 zone — a key short-term support level that coincides with previous liquidity grabs. A decisive break below $3,922 could open the door toward the next demand zone near $3,830–3,805, where buyers may attempt a technical rebound.
Technical Highlights:
Trend: Bearish bias remains intact below $3,970.
Resistance levels: $3,970 / $4,025 / $4,085
Support levels: $3,922 / $3,880 / $3,830
Indicators: Price remains below EMA20 and EMA50 on H1, while RSI hovers near oversold — suggesting a potential short-term pullback before further decline.
Trading Strategy:
Traders could look for short opportunities on minor pullbacks toward the $3,950–3,960 area, maintaining a stop above $3,970 and targeting the $3,830–3,805 zone.
Conservative traders may wait for a confirmed close below $3,922 before joining the bearish leg.
Overall, the structure still favors the downside unless price breaks and sustains above $3,970.
- Stay alert to macro catalysts — especially upcoming U.S. data releases that could influence the dollar and bond yields.

Gold Elliott Wave Analysis – Potential Wave (4) Completion ZoneGold (XAU/USD) on the daily chart appears to be completing a classic Elliott Wave 5-wave impulse structure. After a strong rally into the wave (3) high, price is currently retracing toward the projected wave (4) correction zone.
The highlighted support area aligns with key Fibonacci retracement levels:
0.5 retracement: around $3,845
0.618 retracement: around $3,718
This region also coincides with the lower boundary of the ascending channel, adding confluence for potential bullish reversal.
If wave (4) finds support within this zone and maintains structure, a new impulsive rally toward wave (5) could begin — targeting the upper trendline resistance near $4,500–$4,600.

GOLD outcome.XAUUSD has been falling and now at a SUPPORT zone. Waiting for confirmation if it will rise in the London session or keep falling.

XAUUSD H4 | Potential Bearish Drop Off?Based on the H4 chart analysis, we could see the price rise to the sell entry at 4,053.43, which is an overlap resistance and could reverse from this level to the take profit.
Stop loss is at 4,149.54, which is a pullback resistance.
Take profit is at 3,690.65, which is a pullback support that is slightly below the 61.8% Fibonacci retracement.
Stratos Markets Limited (tradu.com ):
CFDs are complex instruments and come with a high risk of losing money rapidly due to leverage. 68% of retail investor accounts lose money when trading CFDs with this provider. You should consider whether you understand how CFDs work and whether you can afford to take the high risk of losing your money.
Stratos Europe Ltd (tradu.com ):
CFDs are complex instruments and come with a high risk of losing money rapidly due to leverage. 70% of retail investor accounts lose money when trading CFDs with this provider. You should consider whether you understand how CFDs work and whether you can afford to take the high risk of losing your money.

Gold Price Analysis - Gold Breakout Levels 4200 vs 4040Gold is trading inside a tightening rising channel after forming a strong higher timeframe rejection from the ATH which pushed price into a corrective phase. Buyers have repeatedly defended the strong support zone near 4000-3980 creating a false breakout low followed by a controlled recovery showing that demand remains active.
However, each rally into the weak-high resistance at 4160-4200 has shown fading momentum meaning sellers are still protecting this zone aggressively. Until price breaks out with a clean close and retest above this resistance gold will remain in a neutral to slightly bullish consolidation phase driven by stop hunts and choppy movements inside the channel.
A successful breakout above 4200 can trigger a bullish continuation toward 4240 then 4320-4360 and possibly back to the ATH zone while a breakdown below 4040 rising support would shift the structure bearish again exposing the 3980 demand and potentially a deeper drop to 3900 if buyers fail there.
In simple terms buyers still control support, sellers still control resistance and the next big move will come once one of these critical levels breaks with strength.
✅ Option 1-Strong Bullish Bias
Gold is still respecting the rising channel and defending the strong support zone around 4000-3980. As long as price stays above the rising trendline bullish structure remains valid. A clean breakout above 4160-4200 will confirm continuation toward 4240 → 4320 → ATH retest. Buyers are still in the game, waiting for the breakout.
✅ Option 2-Neutral to Bullish
Gold is consolidating inside a rising channel after rejecting the ATH. Support remains strong around 4000-3980 while sellers continue to defend 4160-4200. A breakout on either side will define the next major move. Above 4200 bullish continuation toward 4240 and 4320+. Below 4040 deeper pullback toward 3980 and possibly 3900.
✅ Option 3-Neutral to Bearish
Gold is struggling to break above 4160-4200 showing seller strength at the top of the range. If price fails again and breaks below the rising channel near 4040 downside can accelerate toward 3980 and 3900 for liquidity. Bulls must hold support to avoid a deeper correction.
Gold remains trapped between 4040 support and 4200 resistance inside a rising wedge. Buyers holding strong at the bottom but sellers still defending the top. Break above 4200 bullish continuation toward 4320. Break below 4040 bearish move to 3980-3900. Still a range waiting for breakout confirmation.
Note
Please risk management in trading is a Key so use your money accordingly. If you like the idea then please like and boost. Thank you and Good Luck!

USD/CAD 4-hour timeframe...USD/CAD 4-hour timeframe — and based on my markings:
Current price: around 1.3990
My drawn a breakdown below the Ichimoku cloud and a trendline, showing a possible bearish setup with two projected “Target Points.”
From the image:
First Target Point (upper one): approximately 1.3910 – 1.3920
Second Target Point (lower one): approximately 1.3740 – 1.3760
So my potential targets are:
🎯 Target 1: 1.3910 – 1.3920
🎯 Target 2: 1.3740 – 1.3760
It looks like a trendline break and cloud rejection strategy — aiming for a short trade setup if price holds below the cloud.

EUR/USD 4-hour timeframe...EUR/USD 4-hour timeframe — I can see that my drawn Ichimoku Clouds and have marked two “Target Points” on the chart.
From the image:
Current price: around 1.1664
First target (lower one): approximately 1.1740 – 1.1750
Second target (upper one): approximately 1.1835 – 1.1850
So my potential targets would be:
🎯 Target 1: 1.1740 – 1.1750
🎯 Target 2: 1.1835 – 1.1850
It looks like my analysis is expecting a bullish breakout above the Ichimoku cloud and prior resistance, aiming for those next resistance levels.

Stop!Loss|Market View: EURUSD🙌 Stop!Loss team welcomes you❗️
In this post, we're going to talk about the near-term outlook for the EURUSD currency pair☝️
Potential trade setup:
🔔Entry level: 1.15381
💰TP: 1.14051
⛔️SL: 1.16279
"Market View" - a brief analysis of trading instruments, covering the most important aspects of the FOREX market.
👇 In the comments 👇 you can type the trading instrument you'd like to analyze, and we'll talk about it in our next posts.
💬 Description: A breakout of the support area of 1.15000 - 1.16000 remains the main and more reliable sell scenario. More aggressive sell scenarios suggest entering near the current price, that is, from the local maximum of 1.16600. It is anticipated that the price will rapidly approach the 1.14000 area if the support area indicated is broken, as buyers liquidate their positions that have accumulated in large quantities below this level.
Thanks for your support 🚀
Profits for all ✅
❗️ Updates on this idea can be found below 👇

Red Alert !... ETH got rejected at the topHi guys,
If you zoom out of ETH you'll notice that its moving sideways on the Weekly/Monthly chart
Which can be bullish or bearish at the same time BUT recently we've seen the price gets rejected at the top of the sideways channel on three different monthly candles which is a red alert in my book.
Now I'm not saying that its going down a 100% but not breaking out of the channel is a very bad sign and could mean the signal for a major drop to the lows of the channel.
Not to mention the 4 years cycle of bitcoin is due and all realistic traders are expecting Bitcoin to drop to the previous all time high at 69000$ and if that happens all alt coins will go down too.
Crypto twitter is insanely bullish (very bad sign) and almost all big markets including US stock market and Gold are at all time high and extreamly over valued so don't listen to the greedy social media or the news and listen to reason and common sense here.
Risk management is advised so stay safe out there and let me know what do you guys think my this.

Gold Sitting on the Edge – Liquidity Sweep Before the Bounce?Monday didn’t give much movement, and price is now hovering around last week’s low.
I’m expecting a liquidity sweep of the current levels — likely taking out the Daily Low before moving to fill the full Weekly FVG below.
Short-term bias is bearish for the Asian session, but I’ll be watching closely for a shift once that FVG is filled.
If absorption shows up after the sweep, I’ll flip long for the bigger move higher into midweek.
#FuturesTrading #Gold #ICT #LiquiditySweep #NOFOMO

XAUUSDGold is in a correction phase, with prices near the support zone of 3973-3954. If the price fails to break above 3954, a rebound is likely. Consider buying in the red zone.
** Very Risky Trade
🔥Trading futures, forex, CFDs and stocks carries a risk of loss.
Please consider carefully whether such trading is suitable for you.
>>GooD Luck 😊
❤️ Like and subscribe to never miss a new idea!

Gold (XAU/USD) – Bearish Momentum Continues Below 4,000Gold (XAU/USD) – Bearish Momentum Continues Below 4,000 as Market Targets 3,940
Gold remains under pressure as sellers continue to dominate below the 4,040 resistance zone. After failing to break higher, price formed a lower high and is now consolidating near the 3,995 region.
On the 15-minute chart, a clear bearish structure is visible — the market is printing successive lower highs and lower lows, indicating that momentum still favors the downside. If gold makes a minor retracement toward 4,020–4,040, this could be an ideal zone for short-term sellers to re-enter.
The next key support sits around 3,940–3,920, which aligns with the previous demand zone and Fibonacci retracement from the recent swing low. A confirmed break below this level could accelerate the decline toward 3,900.
Resistance zones: 4,020 / 4,040 / 4,080
Support zones: 3,940 / 3,920 / 3,900
Short-term bias: Bearish below 4,040
Trading strategy:
Wait for a pullback toward 4,020–4,040.
Look for bearish confirmation candles (e.g., engulfing or rejection wicks).
Target 3,940 initially, and extend profits to 3,900 if momentum continues.
The RSI remains below its midpoint, confirming weak bullish momentum, while EMA trends are flattening—signaling that the sellers are still in control for the day.
Remember to manage risk carefully and adjust stop-losses above the 4,050 level.
Follow for more daily gold strategies and Fibonacci-based trade setups.

Gold to $4500?You’re looking at a 4-hour chart of Gold (XAUUSD) with a combination of Fibonacci extensions, RSI, and MACD indicators.
1. Price action & Fibonacci levels
• Current price: around $4,008.
• The chart shows retracement and extension levels, with key Fibonacci zones marked (0.618, 1.618, 2.618, etc.).
• The price recently retraced to the 1.618 level (~$4,010) — a common Fibonacci support zone — and bounced slightly.
• There’s also a 2.618 extension at $3,865, suggesting that if $4,000 fails as support, the next downside target could be around $3,865.
2. MACD (top indicator)
• MACD Line (blue) is well below the Signal Line (orange) → strong bearish momentum.
• Histogram is negative (–7.643), confirming the bearish trend.
• However, the histogram bars are starting to shrink, which can often signal bearish exhaustion or a potential bullish reversal coming.
3. RSI (bottom indicator)
• RSI = 35.93, with the RSI-based MA at 39.91.
• This means Gold is nearing oversold territory (below 30) — it’s not extreme yet, but buyers might soon step in.
• If RSI turns up and crosses the MA, it could confirm the beginning of a short-term reversal.
4. Projected path (orange line on chart)
• The drawn orange curve shows a possible bounce scenario:
• Gold could dip slightly below $4,000 or test $3,865 (2.618 level),
• then begin a gradual recovery toward $4,380–$4,400.
• That’s in line with a Fibonacci retracement to 1.0–1.618 area — a common recovery zone after a sharp drop.
5. Summary
Indicator Current Bias Signal
Price Action Slightly Bearish Approaching support zone
Fibonacci Key support at $4,000, next at $3,865 Possible bounce
MACD Bearish but flattening Early reversal potential
RSI Near oversold Could trigger rebound soon
Quick Take:
Gold might dip slightly lower (possibly to $3,865), but technicals suggest a bullish reversal may follow in early November, targeting the $4,380–$4,400 area.

Gold: A False Breakout Pattern Is FormingThe buyer needs to absorb the attack candle at 4023 to confirm a reversal and open the path toward 4154–4185.
This analysis is based on the Initiative Analysis (IA) concept.
On the 1-hour timeframe, the market is in a sideways range.
Sellers attacked the lower boundary of the range — the 4004 level — with increased volume.
This is the candle with the highest volume inside the seller’s initiative (IC on the chart).
Looking at the daily timeframe, we can see that most of the volume was accumulated below 4004, which looks very much like a false breakout.
A false breakout pattern on the hourly chart will be considered confirmed once the buyer absorbs the seller’s attack candle, meaning the buyer’s candle closes above the high at 4023.
If the buyer manages to absorb the attack candle at the lower boundary of the range,
the next steps to watch are:
whether the price can pass 4050 and the 50% level of the trading range at 4066; be especially cautious around this area, since 4059 is also a daily level where the buyer might face resistance and trigger a short reaction.
and whether the movement stalls near the high of yesterday’s daily candle at 4109.
If these levels are successfully passed, the buyer targets are located at 4154 and 4185.
Wishing you profitable trades!

gold analysis 30/9/2025 ( The Gold Map )Based on gold analysis using My own strategy that I use digital analysis combined with mathematics and physics :
Selling Zones :
3869 - 3881
3901 - 3922
3936 - 3951
3976 - 3994
4008 - 4020
4033 - 4056
4101 - 4118
4137 - 4157
4187 - 4202
4264 - 4285
4346 - 4362
buying zones
3778 - 3764
3751 - 3761
3717 - 3738
3693 - 3710
3670 - 3688
3654 - 3668
3636 - 3648
3612 - 3628
3596 - 3607
3561 - 3579
3503 - 3523

J.D. Vance and the market consequences of successionJ.D. Vance’s sudden rise to the Presidency could mark a dramatic shift for financial markets if he breaks from his current boss’s stance on how to govern an economy.
Before being picked as Trump’s VP, Vance was known for his opposition to corporate monopolies. In the past, he criticised the power of firms like Google, Apple, and Amazon, calling for antitrust enforcement. A sudden shift to a Vance-led administration could crash markets that have priced in continued support for the “Magnificent Seven,” who have driven much of the S&P 500’s recent performance. Ultimately, In the long run, however, breaking up dominant players can spark greater innovation (and potential stock gains), as the incumbents lose their ability to acquire and bury emerging competition.
Meanwhile, one of the defining trends of Trump’s second term has been the significant decline of the U.S. dollar. A change in leadership, especially one less inclined toward isolationist policies and piling on national debt, could potentially strengthen the dollar in the short term. Gold might also take a hit and find a medium-term price level below $4000.

GOLD Bull Market Over?Gold has fallen yet again today. Busting through some major technical support.
Gold is falling for 3 main reasons;
1. Trump / XI (USA vs China) meeting is expecting positive negotiations.
2. Mega Cap Tech Earnings: markets love to chase tech higher.
3. FOMC rate cut expectations.
We believe gold had a strong chance at retesting the daily 200 MA.
Picked up some GLD calls today.

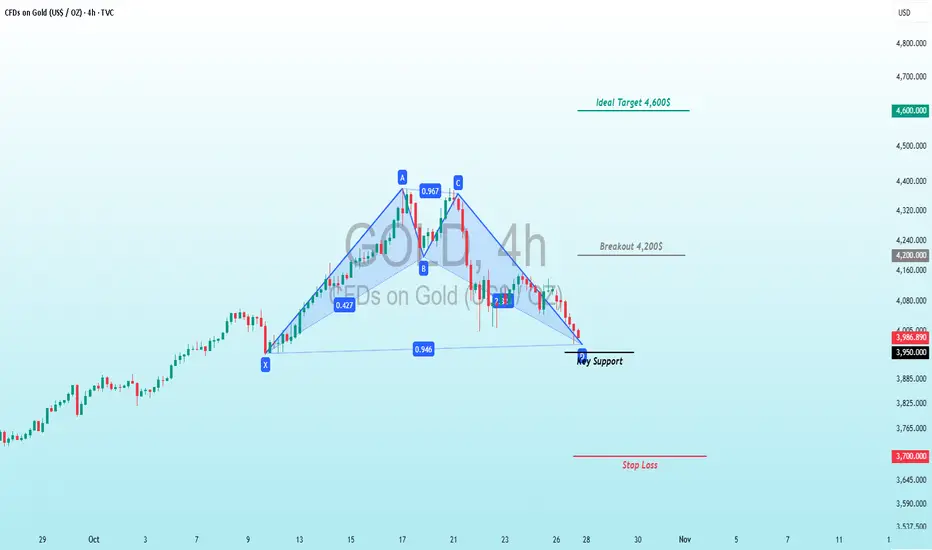
CFDs on Gold (USD/OZ) Symmetrical Triangle Squeeze Setup!TVC:GOLD
🟡 CFDs on Gold (USD/OZ) Symmetrical Triangle Squeeze Setup! 📊
TVC:GOLD 's been on a rollercoaster since early Oct! 🚀 Starting from a solid base at Point A (~$3,730 on Oct 3) 🏗️, it powered up in a steep ascending channel 📈, smashing through resistance to hit euphoric highs at Point B (~$4,600 by Oct 15) – a whopping +23% pump fueled by green marubozu candles, surging volume, and RSI blasting overbought at 75 amid safe-haven flows. But greed turned to fear: A sharp reversal kicked in at Point C, forming a classic symmetrical triangle consolidation 🔺 between ascending support (blue line from A-B) and descending resistance (from C), coiling tight over 10+ days with contracting volatility – MACD flattening, Bollinger Bands squeezing like a spring ready to pop!
Fast-forward to Oct 27: Price's testing the apex near $3,989 (up +3.989% short-term) ⚖️, hovering at the 0.47 Fib retracement level from the A-B swing 🕸️ (key support at $3,950, resistance at $4,070). Breakout north? Bulls could rocket to $4,200 (5.5% quick gain) or full measured move to $4,600 retest for +15.5% profit 💰 from here – ideal for longs with stops below $3,900. Bear breach? Down to $3,700 (-7%) for shorts. Geopolitics + Fed whispers = high octane – watch volume explosion! ⚠️
#GoldTrading #CFDs #CommodityBreakout
XAUUSD Best level to sell is this.Gold (XAUUSD) has turned bearish, at least on the short-term, as it broke below its 4H MA50 (blue trend-line) for the first time in a month and is headed for its 4H MA200 (orange trend-line).
Having made a Double Top at the start of the downtrend, the pattern that seems to be emerging is a Channel Down, with the last such formation seen in April - May.
So far the 4H RSI sequences between the two patterns are identical, so we expect a rebound now, which can give us the most optimal level to short again near the top of the Channel Down.
A break above 0.786 invalidates this, but as long as it holds, our Target will be the -0.236 Fibonacci extension at 3920 just like on May 15, which also hit its 1D MA50 (red trend-line).
-------------------------------------------------------------------------------
** Please LIKE 👍, FOLLOW ✅, SHARE 🙌 and COMMENT ✍ if you enjoy this idea! Also share your ideas and charts in the comments section below! This is best way to keep it relevant, support us, keep the content here free and allow the idea to reach as many people as possible. **
-------------------------------------------------------------------------------
💸💸💸💸💸💸
👇 👇 👇 👇 👇 👇

XAU/ USD Bullish trend analysis Read The captionSMC Trading point update
-
Technical analysis of XAU/USD (Gold Spot)
Timeframe: 1H (OANDA)
Technical Basis: Smart Money Concepts (SMC) + EMA Confluence
---
Market Structure
Current trend: Bearish, price respecting a descending wedge/channel.
Recent Break of Structure (BOS) confirms bearish momentum continuation.
Price is retracing after forming a new low and may move back to mitigate imbalance (FVG).
---
Key Technical Areas
Retracement Levels:
0.5 – 0.79 Fibonacci zone marks the premium shorting area.
Fair Value Gap (FVG) zone between 0.62–0.79 levels is the ideal entry region.
EMA Resistance:
EMA-50 ≈ 4,067
EMA-200 ≈ 4,120
Both EMAs align with the supply zone, strengthening sell bias.
---
Projected Move
1. Expected retracement toward the 4,067–4,100 zone (supply/FVG region).
2. Potential short entry within that area.
3. Bearish continuation targeting the next structural low at 3,960 (as marked).
---
Targets
Next Target (retracement zone): 4,089
Final Bearish Target: 3,960
Mr SMC Trading point
---
Summary
Gold remains under bearish pressure within a contracting structure. A retracement to the premium zone (4,067–4,100) offers potential short opportunities aligned with structure and EMA resistance. A break below 3,995 would further confirm bearish continuation toward 3,960.
---
Pelas support boost 🚀 this analysis
