GOLD (XAUUSD) – Liquidity Grab Setup | Buy-Side Sweep ScenarioGold is currently consolidating between $4,044 (PDL) and $4,113 (Buy-Side Liquidity Zone).
Price recently reacted from the demand zone near $4,044–$4,058, showing signs of bullish absorption.
The plan: a short-term liquidity sweep below $4,078, followed by a potential push toward $4,097–$4,113.
Key observations:
Buy-side liquidity resting above $4,097 and $4,113.
PDL ($4,044) and discount zone acting as a strong accumulation base.
Ideal scenario: Sweep of minor lows → structure shift → long entries targeting $4,113.
Watch for reaction near $4,068–$4,078 for confirmation.
Break below $4,044 invalidates the bullish setup.
📊 Bias: Short-Term Bullish (Intraday)
Gold

XAUUSD: A strong rebound toward 4,235 looks highly likelyHey everyone, it’s Erik here.
I’m closely watching a potential reversal zone on XAUUSD, which I’ve highlighted on my chart. Based on the current market structure, I expect price to face some rejection before continuing its move upward toward the 4,235 level.
This area could be a key decision point for the market. If buyers manage to hold the support, we could see a strong rebound and a continuation of the bullish momentum. But if price breaks below this zone, it could open the door for a deeper move down as liquidity builds beneath.
Should we get a clear bullish impulse, the next area I’ll be watching is T2. From there, we might see a period of accumulation or another sharp reaction, depending on the broader market sentiment at that time.
I’m simply sharing my personal view of the chart — this isn’t financial advice. Always confirm your own setups and manage your risk with patience and discipline.

GOLD → Technical analysis of the current situation FX:XAUUSD is consolidating, and the daily market behavior pattern is not particularly positive, but it does have bullish implications. Market sentiment largely depends on the fundamental background
This week, the Fed is expected to hold a meeting on interest rates, where it will most likely decide to lower them, which could generally support the dollar (but this news is most likely already priced in). Accordingly, the rest depends on decisions regarding the shutdown, trade war, and inflation. The resolution of the first two issues may weaken the price.
As for the technical side, since the price is currently within the trading range, it is worth considering trading within these limits first. However, a breakout and closing above/below one of the key levels: 4060 - 4150 could trigger further movement in the direction of the breakout, which in turn could push the price into another (bearish or bullish) trading range. Below, there is the 4000 zone, and there is a possibility of a retest of this area, with a potentially aggressive reaction.
Resistance levels: 4150, 4218, 4275
Support levels: 4060, 4015, 3944
While uncertainty remains, the market may continue to hold the price between 4060 and 4150. Another retest of the range boundary and the reaction to this retest will show the market's intentions for further movement.
Best regards, R. Linda!

Stop!Loss|Market View: NZDUSD🙌 Stop!Loss team welcomes you❗️
In this post, we're going to talk about the near-term outlook for the USDCAD currency pair☝️
Potential trade setup:
🔔Entry level: 0.57463
💰TP: 0.56839
⛔️SL: 0.57955
"Market View" - a brief analysis of trading instruments, covering the most important aspects of the FOREX market.
👇 In the comments 👇 you can type the trading instrument you'd like to analyze, and we'll talk about it in our next posts.
💬 Description: The New Zealand dollar continues to trade in a mid-term downtrend. Currently, this currency pair, as a commodity currency, is one of the most promising buying instruments for the USD, with further strengthening expected in the near future. Current prices are favorable for potential selling, but a false breakout near 0.57550 is possible, which would provide an even more reliable sell signal.
Thanks for your support 🚀
Profits for all ✅
❗️ Updates on this idea can be found below 👇

Gold: Balance of power between buyers and sellersKey levels 4004 and 3944 remain areas of interest for buyers, while sellers aim for 4011
Daily Timeframe
On the daily chart, the buyer initiative remains active.
The price has corrected below the 50% level of the initiative, and accumulation is currently taking place in this zone.
Key levels from the buyers’ perspective are 4004 and 3944,
while from the sellers’ side, the main resistance level is 4185, where we may see their reaction.
1-Hour Timeframe
On the hourly chart, the price has formed a sideways range, and the seller initiative is now active with a target at 4011.
It makes sense to look for long setups from a false breakout of the lower boundary of the range, around 4004.
If buyers defend the 4004 level, potential targets are 4160 and 4185, where seller reactions should be watched.
If buyers fail to hold 4004, then attention should shift to 3944, where another buyer response may appear.
Wishing you profitable trades!

Gold Price Analysis (XAU/USD) – October 27, 2025Gold Price Analysis (XAU/USD) – October 27, 2025 | Key Support at 4070, Eyeing Rebound Toward 4180
Gold continues to consolidate within a wide range between 4,000 – 4,180 USD/oz, after several days of sideways movement. On the 15-minute timeframe, the price recently completed a short-term descending channel and is now showing early signs of reversal from the 4,070 support area.
Technical Overview
Trend: Neutral-to-Bullish bias within the range
Support levels: 4,070 – 4,030 – 4,000
Resistance levels: 4,120 – 4,150 – 4,180
Indicators: RSI near oversold zone, potential for short-term recovery
Pattern: Breakout from falling channel suggests momentum shift toward the upper boundary of the range
Trading Strategy
Buy setup: Consider long entries near 4,070–4,050, targeting 4,150–4,180, with stop-loss below 4,030.
Sell setup: If price fails to break above 4,180, look for short opportunities targeting back toward 4,070.
Market Context
Gold remains supported by expectations of future Fed rate cuts and mild USD weakness. However, lack of clear catalysts keeps it trapped in consolidation. A clean breakout above 4,180 could open the way toward 4,240–4,280, while a breakdown below 4,000 would shift control back to sellers.
Summary
Today’s bias is mildly bullish as long as 4,070 holds. A bounce from this level could retest 4,150–4,180 in the short term.

Gold XAUUSD Macro map for 27 to 31 Oct 2025Macro map for 27 to 31 Oct 2025
Concentration of policy and inflation prints means policy expectations and real yields will drive the United States dollar, global equities, bitcoin, and gold. The hinge events are Wednesday FOMC, Thursday US GDP advance and German data, Friday US Core PCE and Chicago PMI. Secondary drivers are BoJ policy guidance and ECB tone, plus BoC.
Watch list
Real ten year yield and the DXY dollar index after FOMC and PCE
EUR front end versus USD front end after ECB and FOMC
VIX around the FOMC window and into PCE
US liquidity windows around 14:00 Eastern on Wednesday and 08:30 Eastern on Thursday and Friday
Gold outlook for next week
Set up
Gold trades the sign and size of moves in real yields and the dollar. Policy guidance and inflation prints are therefore the core drivers. A patient or cautious Fed, softer Core PCE, and any rise in macro uncertainty support gold through lower real yields and safe haven demand. A hawkish tilt and firmer PCE pressure it by lifting the opportunity cost of holding a non yielding asset.
Baseline view
The tape prefers a slow glide toward price stability without a growth accident. That backdrop keeps real yields contained or drifting lower and supports gold on dips. The opposite mix lifts real yields and weighs on the metal. Flows often scale in after the first spike around FOMC and PCE once spreads and liquidity stabilize.
Scenarios and probabilities
Upside continuation or breakout. Probability forty. Triggers are a patient FOMC and cooler PCE that push real yields down. A softer dollar would reinforce the move.
Balanced consolidation inside the recent weekly band. Probability thirty. Triggers are mixed signals across events and no major shift in real yields.
Pullback to prior support. Probability thirty. Triggers are firmer PCE or hawkish communication that lifts real yields. Dollar strength would confirm.
Key confirms and risks
Track the ten year real yield and the DXY. If real yields fall while the dollar is flat the setup still favors gold. If both rise, risk control becomes priority. Liquidity can thin quickly in the first minutes after data and during press events. Use predefined risk units and avoid adding into fast markets.

GOLD | Pullback Resistance AheadBased on the H4 chart analysis, we could see the price rise to the sell entry, which is a pullback resistance that aligns with the 161.8% Fibonacci extension and the 50% Fibonacci retracement, and could reverse from this level to the downside.
Stop loss is at 4,370.70, which is a multi-swing high resistance.
Take profit is at 3,946.74, which is a pullback support that is slightly above the 61.8% Fibonacci retracement.
Stratos Markets Limited (tradu.com ):
CFDs are complex instruments and come with a high risk of losing money rapidly due to leverage. 68% of retail investor accounts lose money when trading CFDs with this provider. You should consider whether you understand how CFDs work and whether you can afford to take the high risk of losing your money.
Stratos Europe Ltd (tradu.com ):
CFDs are complex instruments and come with a high risk of losing money rapidly due to leverage. 70% of retail investor accounts lose money when trading CFDs with this provider. You should consider whether you understand how CFDs work and whether you can afford to take the high risk of losing your money.

GOLD Strong Bullish Bias! Buy!
Hello,Traders!
GOLD has made a strong correction last week but found a liquidity pool at the lower levels, and we are seeing a local accumulation phase. Then a bullish breakout is likely with the price moving towards the higher liquidity levels again following a strong uptrend!
Buy!
Comment and subscribe to help us grow!
Check out other forecasts below too!
Disclosure: I am part of Trade Nation's Influencer program and receive a monthly fee for using their TradingView charts in my analysis.

Bullish bounce off 50% Fibonacci support?The Gold (XAU/USD) is falling towards the pivot, which aligns with the 50% Fibonacci retracement and could bounce from this level to the swing high resistance.
Pivot: 3,847.44
1st Support: 3,701.62
1st Resistance: 4,357.81
Disclaimer:
The above opinions given constitute general market commentary, and do not constitute the opinion or advice of IC Markets or any form of personal or investment advice.
Any opinions, news, research, analyses, prices, other information, or links to third-party sites contained on this website are provided on an "as-is" basis, are intended only to be informative, is not an advice nor a recommendation, nor research, or a record of our trading prices, or an offer of, or solicitation for a transaction in any financial instrument and thus should not be treated as such. The information provided does not involve any specific investment objectives, financial situation and needs of any specific person who may receive it. Please be aware, that past performance is not a reliable indicator of future performance and/or results. Past Performance or Forward-looking scenarios based upon the reasonable beliefs of the third-party provider are not a guarantee of future performance. Actual results may differ materially from those anticipated in forward-looking or past performance statements. IC Markets makes no representation or warranty and assumes no liability as to the accuracy or completeness of the information provided, nor any loss arising from any investment based on a recommendation, forecast or any information supplied by any third-party.

XAU/USD Bullish trend analysis Read The captionSMC Trading point update
Technical analysis of XAU/USD – Bullish Continuation Setup (1H Chart)
Technical Overview:
Instrument: Gold Spot (XAU/USD)
Timeframe: 1 Hour
Current Price: $4,114
Next Target: $4,220
---
Chart Breakdown:
1. Demand Zone (Blue Box):
The price has respected a key bullish order block / demand zone between $4,040 – $4,080, showing strong buyer reaction (green arrows).
2. Ascending Trendline Support:
Multiple rejections from the ascending trendline confirm higher lows, signaling ongoing accumulation from buyers.
3. Fibonacci Retracement:
The market retraced around the 0.618 – 0.786 Fibonacci levels — a strong buy zone for continuation setups.
4. Moving Averages (EMA 50 & EMA 200):
EMA 50 (Blue) is trying to cross above the EMA 200 (Black), hinting at a possible bullish crossover.
A successful break above both EMAs would confirm bullish momentum.
5. Bullish Flag / Wedge Pattern:
The structure shows a bullish flag/wedge forming after an impulsive upward move — indicating potential for another breakout rally.
---
Trade Idea:
Buy Zone: $4,070 – $4,100
Target 1: $4,160
Target 2: $4,220 (main target on chart)
Invalidation (Stop Loss): Below $4,030
Mr SMC Trading point
---
Market Bias:
Bullish Bias – As long as the price holds above the highlighted demand zone and the ascending trendline, buyers remain in control. A breakout above recent highs will confirm momentum toward the next target.
---
Pelas support boost 🚀 this analysis

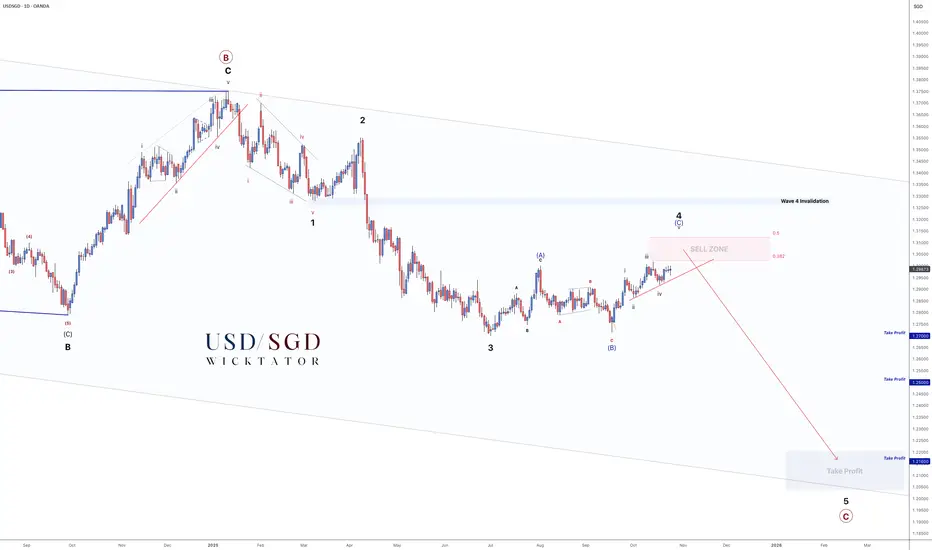
USDSGD - 1000pip Drop Almost Ready!1D Chart
In our previous breakdown, we highlighted the upcoming Wave 4 correction and the potential sell zone ahead — price has now followed that roadmap with precision and fast approaching our sell zone.
Wave 3 completed cleanly, and we’ve since seen a textbook ABC correction forming Wave 4.
Price is now approaching the Sell Zone (38.2–50% retracement), where we’ll be watching closely for confirmation to trigger shorts.
The structure remains intact — Wave 4 invalidation sits just above the 1.32 region. As long as we stay below that level, the bearish setup toward Wave 5 remains valid.
Trade Idea:
- Aggressive short: Rejection inside the Sell Zone
- Conservative short: Break of structure / trendline break confirmation
Targets:
TP1: 1.27 (400pips)
TP2: 1.25 (600pips)
TP3: 1.216 (1000pips)
Weekly Chart:
This is where patience pays off — we’ve tracked this correction from the start, and the final leg of Wave 5 is almost ready to begin.
Plan the trade. Wait for confirmation. Execute with precision.
Goodluck, and as always, Trade Safe!
GOLD (XAUUSD): Support & Resistance Analysis For Next Week
Here is my latest support & resistance analysis for Gold.
Horizontal Structures
Resistance 1: 4186 - 4244 area
Resistance 2: 4358 - 4381 area
Support 1: 4040 - 4060 area
Support 2: 3942 - 3959 area
Support 3: 3870 - 3897 area
Support 4: 3766 - 3831 area
Support 5: 3691 - 3735 area
Vertical Structures
Vertical Support 1: Rising trend line
Consider these structures for pullback/breakout trading next week.
❤️Please, support my work with like, thank you!❤️
I am part of Trade Nation's Influencer program and receive a monthly fee for using their TradingView charts in my analysis.

XAUUSD: Bullish Momentum Still Intact After a Healthy PullbackHello everyone, here is my breakdown of the current Gold setup.
Market Analysis
The broader trend for Gold remains strongly bullish, as we can clearly see from the consistent upward channel that has been forming since mid-September. Each corrective phase has been followed by a decisive breakout, confirming buyers’ control and sustaining the uptrend.
Recently, the market broke out from the upper boundary of the range near 4020, establishing a new structural high close to the 4250 resistance zone. However, after reaching this zone, the price entered a correction phase, pulling back to retest the major support zone around 4050–4020 — a level that also aligns with the lower boundary of the ascending channel.
My Scenario & Strategy
At the moment, the price is stabilizing around the support zone, showing early signs of a potential bullish rebound. This zone has acted as a strong demand area throughout the uptrend, and I expect buyers to defend it once again. If the price confirms a bounce from this level, the next logical move would be a continuation towards the 4215 resistance zone, which also aligns with the mid-level of the previous range.
I remain bullish on Gold while the price holds above the 4020 support zone. A successful retest here would provide a good opportunity for long positions targeting 4215 initially. If the price fails to hold above this level, we could see a deeper pullback — but as long as the channel structure remains intact, the broader bias stays positive.
That's the setup I'm tracking. Thank you for your attention, and always manage your risk.

Siver may reach ATH again but not gold. 26/Oct/25 XAGUSD based on wave substructure silver may reach ATH again next week with price touching the upper trendline ( red) 3rd time at 55 +/-

Analysis of gold movement on the 4-hour time frameHi traders
Gold has not been able to close a candle above the equilibrium range (4114) for the 4-hour time frame for now, but it can have an upward movement to the resistance areas, pick up the rising liquidity, and then return to close a candle below the 4-hour equilibrium range (it can stabilize below 4067, in which case it will pullback to 4067 and 4090 and towards the sell).
For the resistances in question, 4171 - 4193 and 4208 - 4231 are two one-hour equilibrium resistances that the market has not yet pulled back to these numbers, and the 4-hour candle after the pullback should stabilize below these areas to confirm the continuation of the decline to low liquidity and sellers' TPs

Is the Yellow Metal Ready to BUST Out?Hold onto your hats, traders!
It's been a very wild ride in the FX_IDC:XAUUSD market, proving that what goes up (to a Double Top 🏔️🏔️) must come down (with a vengeance!). After a decisive rejection at the $4381 peak, Gold took a spectacular 8.64% dive last Tuesday, landing sharply at the $4002 low 📉. Talk about a waterfall! 🌊
But don't count the bulls out yet! Gold showed some backbone, bouncing 3.97% back up to $4161 before settling into a cage match. It's now consolidating in a classic Triangle pattern (a.k.a. Compression) 📐, ranging from the $4002 floor up to the stronger resistance near $4135.
The Great Consolidation: Triangle Tension 😮💨
The key takeaway? That $4000 psychological support is a BEAST. 💪 It survived test after test during the Asia, EU, and US sessions last Tuesday and Wednesday! This resilience allowed Gold to build support: first at the $4065 level (the Fib 0.382) and then down to the $4043 low, followed by rock-solid support near the $4000 zone.
As Friday closed out the week, Gold was still testing the lower $4100 area, pulling back to $4096. So, what’s next for the shiny metal?
That $33 candle Friday, was a direct reaction to the release of the slightly softer-than-expected US September Consumer Price Index (CPI) inflation data.
My Outlook: Patience is Gold, But the FED is Key 🔑
While some market watchers are singing a bearish tune 🐻, I see this as a healthy consolidation phase. Gold has already corrected 50% from its massive move (from $3631 low to the $4381 high). While a deeper correction to the 0.618 Fib at $3918 is possible, I don't see the catalyst right now to push it that far.
My bet? Gold will continue to consolidate in $4050 - $4150 range until the major announcement from the FED 🏦. The sharp reversal from the Double Top might just be the clean-out needed to launch prices higher once the rate cut announcement (or even just the dovish talk of future cuts) takes place! The last inflation data was a mixed bag, which gives the FED room to sound reassuringly dovish.
The FED Announcement is the main event this week. Mark your calendars! 🗓️
🔥 Key Economic Events: Central Bank Super Week! 🔥
This week is absolutely jammed with market-moving events across the globe. Get ready for volatility! 🌪️
Monday, October 27, 2025
8:30 AM ET: USD 🇺🇸 Durable Goods Orders (MoM) (Sep)
10:00 AM ET: USD 🇺🇸 New Home Sales (Sep)
Tuesday, October 28, 2025
10:00 AM ET: USD CB Consumer Confidence (Oct)
Wednesday, October 29, 2025 (The Fed Day) 🏦
All Day: HKD Holiday - Chung Yeung Day
9:45 AM ET: CAD BoC Interest Rate Decision
10:30 AM ET: USD Crude Oil Inventories
2:00 PM ET: USD Fed Interest Rate Decision
2:30 PM ET: USD FOMC Press Conference
10:00 PM ET (Approx.): JPY BoJ Interest Rate Decision
Thursday, October 30, 2025 (ECB and GDP Day)
2:00 AM ET: EUR German GDP (QoQ) (Q3)
4:00 AM ET: EUR German CPI (MoM) (Oct)
8:15 AM ET: EUR Deposit Facility Rate (Oct)
8:15 AM ET: EUR ECB Interest Rate Decision (Oct)
8:30 AM ET: USD GDP (QoQ) (Q3)
8:45 AM ET: EUR ECB Press Conference
9:30 PM ET: CNY Manufacturing PMI (Oct)
Friday, October 31, 2025 (Inflation and Month End)
6:00 AM ET: EUR CPI (YoY) (Oct)
8:30 AM ET: USD Core PCE Price Index (MoM) (Sep)
8:30 AM ET: USD Core PCE Price Index (YoY) (Sep)
9:45 AM ET: USD Chicago PMI (Oct)
-------------------------------------------------------------------------
This is just my personal market idea and not financial advice! 📢 Trading gold and other financial instruments carries risks – only invest what you can afford to lose. Always do your own analysis, use solid risk management, and trade responsibly.
Good luck and safe trading! 🚀📊

Gold > Previous Day Highs?Gold looks interesting from $4,100 - could act as a potential bullish pivot point to target previous day highs.
Kind regards,
Aman

Wall Street Weekly Outlook - Week 44 2025 [27.10.- 31.10.2025]Wall Street Weekly Outlook – Week 44, 2025 📊💥
Let’s dive into another exciting trading week! 🚀
Rate decisions, month-end flows, and fresh quarterly earnings are setting the stage for strong market moves.
Sit back, enjoy the overview, and dive into the world of banks, hedge funds, and institutional flows — with exclusive insights into how the pros are positioning right now. 🧠💼📈
Extra Lessons: Strategies, setups, and market psychology — everything you need to know for the week ahead. ⚡️
**S&P500 Performance after FED rate cuts**
**Overview: The most important events of the week**
Have a great start to the trading week!
Meikel

BTC - Liquidity Dynamics leading to new HighsMarket Context
Bitcoin has shown a constructive reaction from the recent lows, printing a clean double bottom structure that suggests short-term demand entering the market. After a previous buy-side liquidity sweep and rejection, price has rebalanced and is now challenging a fair value gap (FVG) that previously served as resistance. This marks a key decision zone where the next directional move will unfold.
Fair Value Gaps & Structure
The FVG overhead has already acted as resistance, capping the first impulsive move from the lows. Should price retrace slightly to take out the remaining sell-side liquidity below the double bottom before re-engaging higher, it would confirm the area as a springboard for a bullish continuation. A clean reclaim and hold above the FVG zone would signal a shift in order flow favoring buyers.
Liquidity Dynamics
The current setup offers both sides of the market clear liquidity targets: sell-side liquidity resting under the double bottom and buy-side liquidity resting above the prior high. Smart money could engineer a sweep of the lower side first to accumulate before expansion, or alternatively, break directly through resistance to trigger a larger bullish leg.
Final Thoughts
The structure reflects a balanced but bullish-leaning scenario — a classic accumulation and breakout setup. A deeper retest to clear out lower liquidity would strengthen the foundation for continuation, while sustained strength above the FVG opens the door for a reaction toward new highs.
If this analysis aligned with your view, drop a like — do you think we clear the lows first, or head straight for a bullish breakout?

GOLD → Retest 4060 within the range. What are the expectations?FX:XAUUSD is forming a correction from the Asian session, with the price testing the important 4060 zone ahead of two key events: US inflation data (CPI) and the results of US-China trade negotiations.
Key factors: US inflation (CPI): Low data will support gold (expectations of two cuts in 2024), but high figures will strengthen the USD and weaken gold (rates for a rate cut in December will decline).
Progress in negotiations between China and the US could weaken gold, while failure would bring back demand for safe havens. US sanctions against Russian oil are supporting oil prices and inflation expectations.
Gold is in wait-and-see mode. Growth is likely with weak CPI or a failure of negotiations. Strong CPI and progress in trade will reinforce the correction. The mood remains cautious ahead of events.
Resistance levels: 4090, 4150, 4163
Support levels: 4060, 4002
The important zone of 4060 - gold is forming a false breakdown. If the bulls hold their defense above this zone, it could trigger growth towards the resistance of the range. Otherwise, we can expect a retest of 4000K, and the reaction should be aggressive...
Best regards, R. Linda!

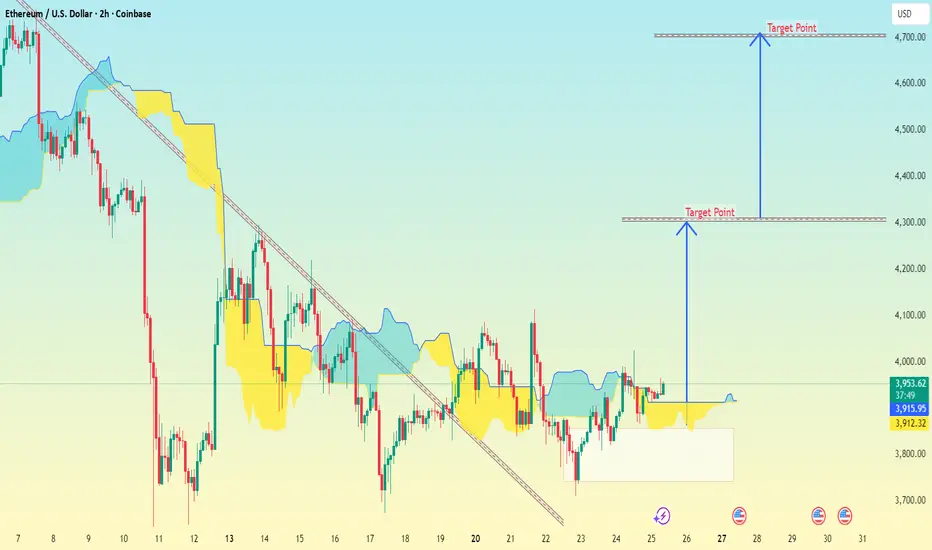
Ethereum (ETH/USD) on the 2-hour timeframe (Coinbase).Ethereum (ETH/USD) on the 2-hour timeframe (Coinbase).
My drawn two downward projection arrows labeled Target Point, showing possible downside continuation.
Here’s what the chart structure indicates:
Price is around $3,975–$4,000.
The structure shows a rising wedge breakdown, typically bearish.
Volume profile (yellow/blue areas) shows strong resistance above current levels.
Based on my arrows and price scale, my chart marks two main downside targets.
🎯 Target Zones
1. First Target Point: Around $4,200 → $4,250
Short-term correction zone, possible support test.
2. Second Target Point (Deeper move): Around $3,750 → $3,800
Major downside target — corresponds to full wedge breakdown measurement.
✅ Summary
Pattern: Rising wedge (bearish)
Current price: ~$3,975
Target 1: ~$4,200 (minor support retest)
Target 2: ~$3,750 (main bearish target)
BTC/USD (Bitcoin vs. USD) chart Pattern..BTC/USD (Bitcoin vs. USD) chart..
Here’s the breakdown of what’s visible:
The wedge is narrowing downward, suggesting price compression.
The breakout projection line (blue arrow) shows an upside target.
Current price (near wedge bottom): around $111,750.
The wedge top resistance area: around $113,500–114,000.
The measured move target (length of the widest part of the wedge projected upward) gives a target zone near $120,000–118,000.
✅ Projected Target Zone:
$12,0000 – $118,000 (USD)
⚙ Confirmation Needed:
Breakout above $113,500 with strong volume.
Retest of breakout zone holding as support.
