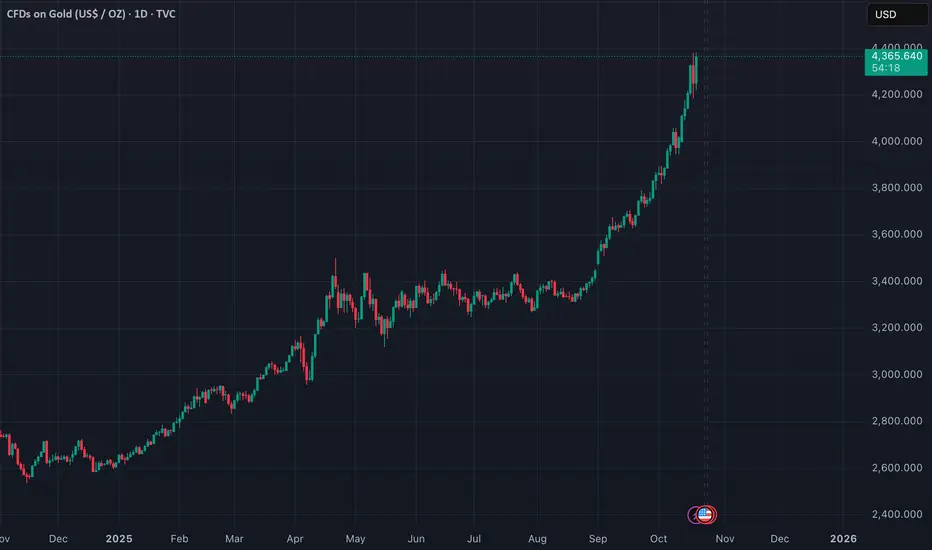
GOLD XAUUSD LONGTERM 1-3M CHARTСhart shows the long-term gold price structure from the 1970s to 2040s, highlighting the main resistance (red) and main trend support lines (green).
(RED) Main Resistance ZONE— every time the price reached this upper red channel, a major correction followed (marked by red arrows).
(GREEN) Main Trend Support Line — has consistently acted as a strong long-term foundation for price recoveries since 1970.
Gold is approaching the upper boundary, suggesting we may be entering a distribution phase similar to 1980 and 2011, unless a strong breakout confirms a new supercycle... ----->
------> Just like from March 2006 to July 2011, gold may continue rising while the RSI shows long-term bearish divergence.
If history repeats, we may see a final blow-off phase before another deep retracement toward the mid or lower trend levels.
Gold

gold\btcI don't understand this...
If gold protects against inflation, why is it losing so much value against Bitcoin?
Conspiracy theorists, the stage is yours 👀

Regarding "catching the top" at all time highsWhen market conditions are as they are right now it is really tempting to try and predict the top. But please don't and here is why.
If you'd look at the gold chart right now you'd see that it has been running up all year long with a slight consolidation in the summer. At any moment this year it could have been "the top", but it wasn't. What I am pointing at is that the R:R of predicting the top when you are at the all time highs is unfavourable to say the least. Even if you would've been able to predict a throwback it would've been minor when comparing with the whole of the swing.
Now technical analysis is great and all but at all times in history there were some assets that were absolutely sentiment driven and you can squiggle what ever lines you want on that pretty colourful chart. It will not help you but give you false expectations of cracking the matrix. Market sentiment is like rabies - nobody knows whats going on and then sudden death. Now we have precious metals booming, it was A.I. before that, and EV's before that, and tech before that and so on and on and on. So when you're doing TA on a sentiment driven asset that is currently at all time highs it is only natural that the only thing you will look for is the top and in such matter you will become liquidity.
When what ever you are looking at is in price discovery mode you literally have no price history to look at. So tell me? What is you point of reference? People who work with fundamentals here have a greater edge because they don't even need to look at the chart to understand that we are in a territory that is volatile and pricing in a premium, but when you don't see the sticks forming you don't think about tops, you play the waiting game. Of course at some point in time the price will drop, but it will not be because of a fibonacci projection or a double top, or any other kind of TA pattern, at least not in this sentiment driven asset like gold. It will be because of two things - smart money exiting their positions and a change in sentiment. And for both of these to happen you need news and macro events to stir up the pot and to have someone or something to blame for the dips that are yet to come.
All in all, regarding "catching the top" - don't. It is gambling unless you have many and many years of experience trading in the markets at all time highs and probably the people that do have the so much needed experience will agree with me.
Trade smart, don't be liquidity.
GOLD Will Break ATH Again? Buy!
Hello,Traders!
GOLD Price is maintaining a strong bullish structure, consolidating just beneath its all-time high. Liquidity build-up above the highs suggests potential for an impulsive breakout, extending toward new record levels as buyers remain in full control. Time Frame 5H.
Buy!
Comment and subscribe to help us grow!
Check out other forecasts below too!
Disclosure: I am part of Trade Nation's Influencer program and receive a monthly fee for using their TradingView charts in my analysis.

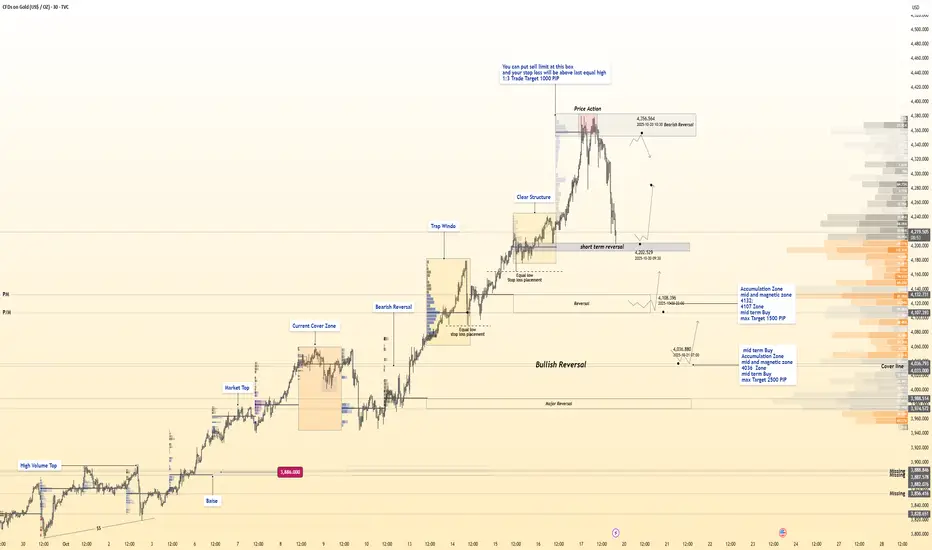
The Ultimate GOLD Reversal Map📊 Hanzo Protocol Note
Every marked level reflects precision between liquidity, delta reaction, and volume logic —
Only structure and flow decide — not bias.
Mid-Term SELL Zone — 4360
Setup: Limit Sell Recommended
Stop Loss: Above recent equal highs
Target: +1000 Pips (1:3 RR)
Reasons:
Liquidity pool above previous equal highs
Institutional distribution volume at upper range
HVN (High Volume Node) cluster acting as resistance wall
Delta shift showing heavy sell absorption
Imbalance re-test aligned with order block
4H premium pricing zone within range top
Price deviation above value area high
Stop hunt confirmation wick
Momentum divergence vs delta
Hidden distribution footprint visible on volume profile
Short-Term BUY Zone — 4202
Setup: Reactive Buy Opportunity
Target: 500–1000 Pips
Reasons:
Ultra-volume spike with no price continuation
Delta flip confirming buyer absorption
Trap formation below session low
Volume exhaustion beneath POC
Smart Money re-entry point after sell-side clear
Strong 30M reversal wick with liquidity gap
Reaction from prior fixed HVN
Internal structure shift with micro CHoCH
Buyer cluster confirmed under equilibrium
Perfect liquidity grab setup before new leg
Mid-Term BUY Zone — 4132 – 4107
Setup: Accumulation & Magnetic Demand Area
Target: Up to 1500 Pips
Reasons:
Multi-session HVN alignment
Strong accumulation footprint on delta flow
Reactive rejection at discounted price zone
Liquidity engineered below equilibrium
Large volume imbalance correction
Compression channel breakout origin
Major liquidity gap filled
High-probability reversal range from fixed profile
Delta divergence showing quiet buyer absorption
Institutional order flow detected at low volume shelf
Long-Term BUY Zone — 4036
Setup: Deep Accumulation Zone
Target: Up to 2500 Pips
Reasons:
Major 4H structural base confirmed
Deep liquidity flush below quarterly low
Volume absorption + delta compression zone
Institutional reloading pattern visible
Smart Money demand block within discount 0.79 level
Magnet zone aligning with historical POC
Strong rejection from fixed range low
Major delta shift to positive
Buyer footprint expansion in lower volume node
Final liquidity grab before long-term accumulation move
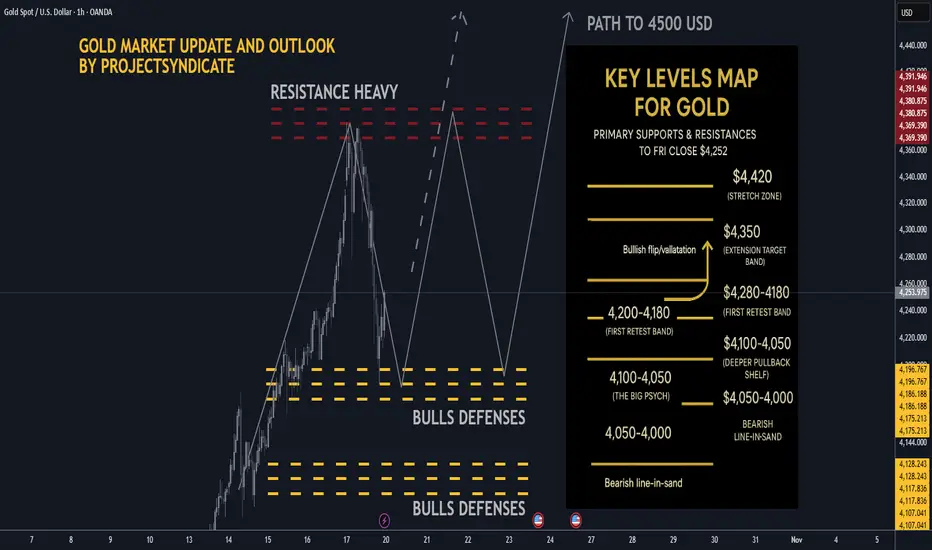
Gold next week: Key S/R Levels and Outlook for Traders🔥 GOLD WEEKLY SNAPSHOT — BY PROJECTSYNDICATE
🏆 High/Close: $4,379 → ~$4,252 — higher close vs. last week’s pullback finish.
📈 Trend: Uptrend intact > $4,000; dip buyers continue to control rhythm.
🛡 Supports: $4,180–$4,140 → $4,100–$4,050 → $4,000 must hold.
🚧 Resistances: $4,260 / $4,300 / $4,350 → stretch $4,380–$4,420.
🧭 Bias next week: Buy-the-dip > $4,140–$4,200; momentum regain targets $4,300–$4,380+. Invalidation < $4,050 → risk $4,000/3,980.
🌍 Macro tailwinds:
• Fed: Markets lean to another cut into Oct 28–29; softer real yields buoy gold.
• FX: DXY under pressure = constructive backdrop.
• Flows: ETF interest & CB buying remain supportive on dips.
• Geopolitics: Tariff/trade and regional risks keep safe-haven bids live.
🎯 Street view: Several houses float $5,000/oz by 2026 scenarios on easing policy & reserve diversification narratives
________________________________________
🔝 Key Resistance Zones
• $4,260–$4,280 near-ATH supply / immediate ceiling from close
• $4,300–$4,350 extension target band
• $4,380–$4,420 stretch zone toward prior spike high and measured extensions
🛡 Support Zones
• $4,220–$4,200 first retest band just below close
• $4,180–$4,140
• $4,100–$4,050 deeper pullback shelf; $4,000 remains the big psych
________________________________________
⚖️ Base Case Scenario
Expect shallow pullbacks into $4,220–$4,140 to be bought, followed by rotation back into the $4,260–$4,300 resistance stack for an ATH retest.
🚀 Breakout Trigger
A sustained push/acceptance > ~$4,280 unlocks $4,300 → $4,350, with room toward $4,380–$4,420 if momentum persists.
💡 Market Drivers
• Fed cut expectations into late Oct(lower real yields = gold tailwind
• USD softness / DXY sub-100 tone supports metals
• Ongoing central-bank bullion demand; ETF inflows stabilizing
• Geopolitics & trade/tariff headlines keeping safety bids active
🔓 Bull / Bear Trigger Lines
• Bullish above: $4,140–$4,200
• Bearish below: $4,100–$4,050 risk expands under $4,000
🧭 Strategy
Accumulate dips above $4,140–$4,200.
On breakout > $4,280, target $4,300–$4,350+. Maintain tight risk under stepped supports; invalidate momentum below $4,050–$4,000.
________________________________________
The 4400 era is coming, and the 4500 era is just beginning.Judging from the current trend, the middle track of the hourly line and the 4H line are already around 4280. As time goes by, the lower low point is constantly rising. We can appropriately increase the expected retracement target and participate in long trading when it retraces to around 4390-4380. But at the same time, we also need to pay attention to the short-term support formed by 4330-4320. If it falls back to this level in the evening and shows a clear stop in the decline, we can also consider entering the market in advance and going long on gold in this range. The upper pressure continues to focus on 4365-4380. If gold rebounds first, you can also consider shorting gold appropriately.
OANDA:XAUUSD

Gold's Historic Rally: Where We're HeadingGold broke out of a multi-year consolidation (2020–2024) when it cleared the previous all-time high of $2,080. Once that level broke, we entered price discovery mode .
This is important: There's no overhead resistance from traders who bought at higher levels because there are no higher levels. That's bullish. But it also means we're in uncharted territory.
The weekly chart shows a clean uptrend with no signs of reversal yet. But rallies this big and fast typically need consolidation phases.
Here's where it gets specific. Gold showed a classic consolidation pattern:
- Consolidation range: $2,565–$2,750
- Breakout point: Early 2025
- Measured move target: ~$3400
Using the Fibonacci extension, if the uptrend continues, it suggests the next major resistance is around $4,500 and $4,750.
If you plot these on a chart, you see:
- Gold broke out cleanly from consolidation
- Every pullback has been bought
We're in a controlled uptrend, not parabolic. This is the structure of a trend that could continue.
But it's also the structure that could reverse if critical support breaks.

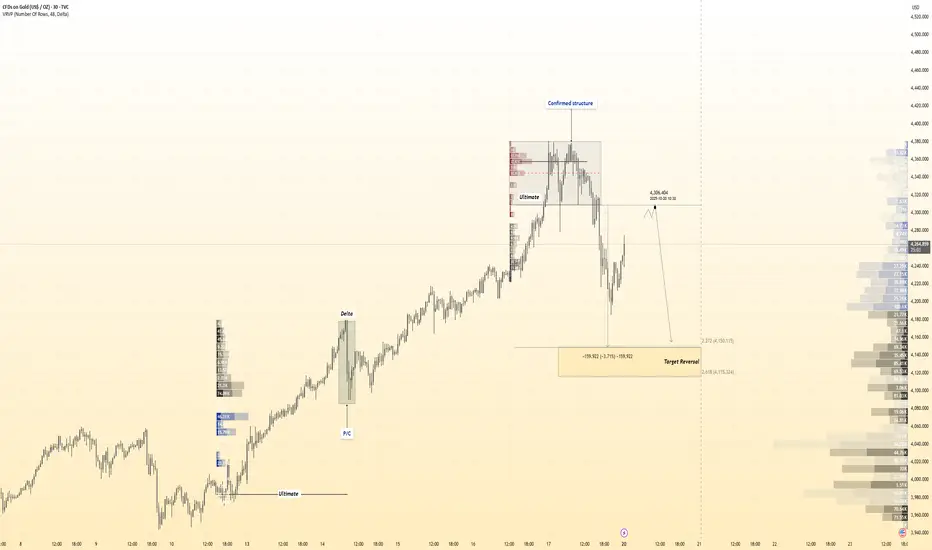
( HANZO Gold Protocol ) Bearish Reversal Detected SELL Scenario — Hanzo Reversal Intel (Smart Money Phase III)
🔥Sell Reversal : 4307 Zone
Status: Active Reversal Protocol
Symbol: Gold
Session: London–New York Overlap (Smart Exit Window)
🧩 Technical Breakdown
➤ Volume Surge Confirmed
A clear overload of institutional sell volume detected at exhaustion highs. The tape confirms aggressive unloading by composite operators.
➤ Session Alignment
The Smart Money exit window is open — this is where large players offload liquidity before volatility collapse.
➤ Cluster Shield Active
Price met a dense supply cluster on the volume map, validating an active imbalance zone. This zone acts as a precision trap for late buyers.
➤ Delta Shift Turned Negative
Order flow flipped — buyers absorbed, sellers dominate. Imbalance sustained across multiple timeframes.
➤ POC Retest Completed
Liquidity re-engaged at the Point of Control, confirming absorption and rejection — final validation before reversal.
➤ Structure Fracture Pending
Micro-structure shows early bearish intent — liquidity purge complete, ready for engineered drop.
🧠 Hanzo Logic
This setup isn’t a prediction — it’s an engineered reaction. Every confirmation aligns with controlled liquidity flow, not retail patterns. Hanzo logic reads the market as a machine, not a chart.
🎯 Execution Objective
Bias: Bearish
Goal: Controlled short with minimal drawdown
Tactical Edge: Reversal precision through liquidity engineering
Confidence Level: ★★★★★ (Smart Money Aligned)
⚡️ Hanzo Signature Insight
Most traders see resistance — we see distribution intelligence.
What looks random to others… is designed precision to us.
Short-term volatility, how to plan for the next market trendGold is currently continuing its upward momentum. In the short term, we will first focus on whether gold can break through 4266. The intraday market has rebounded to this point many times and encountered resistance and fell back. If it is difficult to break through in the short term, the gold price will continue to fluctuate widely. On the contrary, if it can effectively break through 4266, continue to pay attention to the upper resistance range of 4280-4300. When the first rebound touches this resistance range, consider shorting gold in batches with light positions.
OANDA:XAUUSD

XAU/USD | First LONG, then SHORT! (READ THE CAPTION)By analyzing the Gold (XAUUSD) chart on the 15-minute timeframe, we can see that gold hit all targets between $4,300 and $4,350 and even rallied to $4,380.99, marking a new all-time high (ATH)!
After that, gold started to correct below $4,300, briefly dipping to $4,258 before bouncing back above $4,285. I expect that if the price moves into the $4,300–$4,317 zone, we may see a negative reaction or rejection from this area.
If that scenario plays out, gold could drop toward $4,250 as its first key target.
Keep a close eye on these levels — and if you have questions about gold’s trend, feel free to leave a comment using the link below!
Please support me with your likes and comments to motivate me to share more analysis with you and share your opinion about the possible trend of this chart with me !
Best Regards , Arman Shaban

Gold Analysis: Break Above $4,293 Could Trigger a New HighHi guys!
Gold has been moving inside a clear ascending channel, respecting both its upper and lower boundaries. Recently, we saw a double top formation near the upper trendline , which triggered a corrective move down to the $4,190–$4,200 support zone, an area that has already shown strong buying interest.
After the rebound from this support, the price is now aiming toward the $4,293 resistance.
👉 If the price breaks and holds above $4,293 , it’s likely to continue the bullish momentum and head toward a new higher high inside the channel.
Overall, the structure remains bullish as long as the price stays above $4,190 , with the next key resistance at $4,293 being the level to watch for a potential continuation of the uptrend.
Gold’s bullish bias remains supported by the ongoing geopolitical tensions, uncertainty over global interest rate paths, and softening U.S. dollar. Investors are also increasingly turning to gold as a safe-haven asset, especially amid concerns about economic slowdown and central bank gold purchases remaining strong.
Disclaimer: As part of ThinkMarkets’ Influencer Program, I am sponsored to share and publish their charts in my analysis.

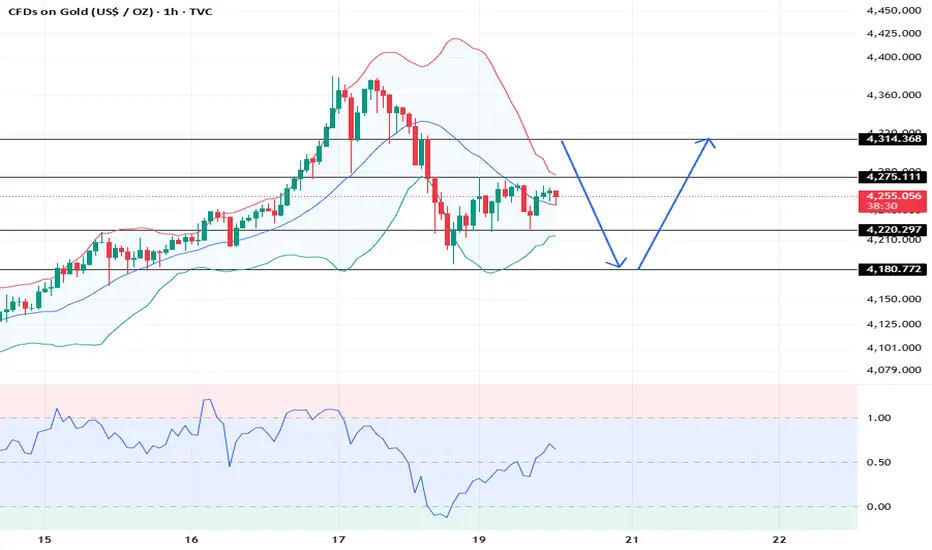
XAUUSD: Market Analysis and Strategy for October 20Gold Technical Analysis
Daily Resistance: 4380, Support: 4100
4-Hour Resistance: 4314, Support: 4180
1-Hour Resistance: 4275, Support: 4220
Last Friday, gold prices retreated after hitting $4380, dropping nearly $200 intraday to a low of around $4186.
The decline stems from both the previous excessive price increase and the strengthening US dollar and tariff policy changes. Regardless, this significant decline in gold prices is bound to raise market concerns about future trends.
From the weekly chart, despite a sharp rise, the market retreated after a surge. Friday's daily chart nearly reversed Thursday's gains.
The 4-hour MACD indicator formed a downward death cross, suggesting that short-term market volatility is at least inevitable.
What is certain is that the bull market in gold's major cycle has not ended. This so-called major cycle is measured on an annual basis, meaning next year's average price will undoubtedly be higher than this year's. As for whether the market will continue to fall this week, this possibility cannot be ruled out. After this week's rebound, if it fails to hold above 4300, there is still a chance that it will test the 4200 or even 4100 levels below.
For intraday trading, sell high and buy low. The market is expected to fluctuate and consolidate.
Selling range:
SELL: near 4275
SELL: near 4315
BUY: near 4220
BUY: near 4180
More analysis👉
Gold Price Analysis - Gold Showing Strong Reversal SignsGold is currently trading around $4,230, showing a mild pullback after making an all-time high near $4,380. The market has corrected toward its main support zone around $4,120–$4,166 (Fib 0.5–0.618 region). This zone is acting as a crucial demand area, aligning with the ascending trendline, which suggests potential for bullish continuation if price holds above it.
In the short term, a retest of the support is likely before a possible bounce toward the resistance at $4,401–$4,420. If bulls regain strength above $4,250, momentum could quickly shift upward, targeting new highs. However, a confirmed 4H candle close below $4,110 may open the door for deeper correction toward $4,050–$3,950.
🔑 Key Levels to Watch
Resistance: $4,379 → $4,401 → $4,541
Main Support: $4,120–$4,166
Trendline Support: $4,100 area
🔹 Buy Zone:
- Primary Buy Zone: $4,120–$4,166 (Fib 0.5–0.618 area + trendline support)
🔹 Buy Trigger:
- Buy Trigger: Break and 4H close above $4,250
- Upside Target: $4,379 → $4,401 → $4,450
Summary
Gold remains bullish in the bigger picture but is currently in a retracement phase.
- Holding above $4,120 keeps buyers in control.
- Breaking below $4,100 turns the short-term trend bearish, opening room for a deeper correction.
Note
Please risk management in trading is a Key so use your money accordingly. If you like the idea then please like and boost. Thank you and Good Luck!

Gold Formed TriangleGold has formed a rising triangle pattern, which typically signals a potential upside breakout. If confirmed, it could offer a $40–$50 buying opportunity today.

GOLD Is this a Super Cycle??XAUUSD (Gold) has been rising non-stop basically since the last time it made contact with (and bounced on) the 1M MA50 (blue trend-line) two years ago (October 2023). Contrary to what many believe, a technical correction may not be coming soon as this long-term bullish trend resembles the Super Cycle that started in the early 2001.
So far Gold is within a Channel Up since 2018 and the next correction may take place well within 2026 and closer to the 3.0 Fibonacci extension. In any case, if this is indeed a new such Super Cycle, Gold represents a sound long-term investment up until at least $8000, which would be again a +660% rise from the Bear Cycle's bottom (as in the previous Cycle).
Do you think history will repeat itself?
-------------------------------------------------------------------------------
** Please LIKE 👍, FOLLOW ✅, SHARE 🙌 and COMMENT ✍ if you enjoy this idea! Also share your ideas and charts in the comments section below! This is best way to keep it relevant, support us, keep the content here free and allow the idea to reach as many people as possible. **
-------------------------------------------------------------------------------
💸💸💸💸💸💸
👇 👇 👇 👇 👇 👇

Gold corrective pullback supported at 4203The Gold remains in a bullish trend, with recent price action showing signs of a corrective pullback within the broader uptrend.
Support Zone: 4203 – a key level from previous consolidation. Price is currently testing or approaching this level.
A bullish rebound from 4203 would confirm ongoing upside momentum, with potential targets at:
4365 – initial resistance
4420 – psychological and structural level
4450 – extended resistance on the longer-term chart
Bearish Scenario:
A confirmed break and daily close below 4203 would weaken the bullish outlook and suggest deeper downside risk toward:
4160 – minor support
4114– stronger support and potential demand zone
Outlook:
A bullish bias remains intact while the Gold holds above 4203. A sustained break below this level could shift momentum to the downside in the short term.
This communication is for informational purposes only and should not be viewed as any form of recommendation as to a particular course of action or as investment advice. It is not intended as an offer or solicitation for the purchase or sale of any financial instrument or as an official confirmation of any transaction. Opinions, estimates and assumptions expressed herein are made as of the date of this communication and are subject to change without notice. This communication has been prepared based upon information, including market prices, data and other information, believed to be reliable; however, Trade Nation does not warrant its completeness or accuracy. All market prices and market data contained in or attached to this communication are indicative and subject to change without notice.

GOLD: Long Signal with Entry/SL/TP
GOLD
- Classic bullish pattern
- Our team expects retracement
SUGGESTED TRADE:
Swing Trade
Buy GOLD
Entry - 4255.7
Stop - 4240.2
Take - 4286.09
Our Risk - 1%
Start protection of your profits from lower levels
Disclosure: I am part of Trade Nation's Influencer program and receive a monthly fee for using their TradingView charts in my analysis.
❤️ Please, support our work with like & comment! ❤️

THE KOG REPORTTHE KOG REPORT:
In last week’s KOG Report we gave the bias level as bullish above 4003 and the red box we would be looking for to break to then confirm the move into the region we wanted. The move played well from the opening going on to complete all the red box targets together with our algo targets on gold.
Although it being risky we wanted to short from the given region, but due to price breaking through without even halting, we updated traders with the higher region we were looking to target, which also worked well.
On Friday, we managed to identify the pattern we wanted and activated a target of 4197 together with the break below the bias level. This for us again worked well to end the week with a wonderful short and then a TAP AND BOUNCE from the indicator level giving those who missed the short and opportunity to capture a 200pip long to end the week.
A phenomenal week in Camelot, not just on Gold but the many other pairs we trade and analyse.
So, what can we expect in the week ahead?
So, this week I have a bit of a concern with this bearish move. I have a sneaky suspicion that they may not have completed upside as yet, and instead, want to get traders in to thinking the retracement has started. Just a inkling for now so let’s see how the week opens and what region we attack first.
Above, I have a reversal on the hourly and the 4H chart but the daily, weekly and monthly are still suggesting higher pricing. Ideally, we need another bearish day for price to leave the 4200’s and come close to the 4150 level to hold before we decide we’re going to either consolidate and accumulate here or get a deeper pull back. Below, we have 4220 which is the level that will need to break for us to go lower with the initial target below being 4165 and below that 4129.
Our key level here initially is the 4295 level and above that 4310. 4310 is the line in the sand for bulls to attempt to break to go higher and complete the move back above to create another all time high. Failure, and we should get more confirmation of a deeper pull back that should attempt to target the lower 4000 mark.
As usual, we’ll let the algo confirm the move, the indicators will tell us which way to stay in, and the liquidity indicator will tell us when to play caution. For now, the path is on the chart, let’s see how we open and begin the week.
KOG’s bias of the week:
Bullish above 4230
Bearish below 4220
RED BOXES:
Break above 4255 for 4265, 4270, 4284 and 4304 in extension of the move
Break below 4237 for 4230, 4220, 4210, 4206, 4185 and 4177 in extension of the move
Please do support us by hitting the like button, leaving a comment, and giving us a follow. We’ve been doing this for a long time now providing traders with in-depth free analysis on Gold, so your likes and comments are very much appreciated.
As always, trade safe.
KOG

LiamTrading - XAUUSD: Mid-Term Correction Begins ...LiamTrading - XAUUSD: Mid-Term Correction Begins - Watch for Selling at Key Resistance Zone
Hello traders community,
After a surge due to geopolitical tensions, XAUUSD (Gold) is starting to show signs of a mid-term correction. The upward momentum has stalled, and prices are showing weakness from the peak region.
The market is currently in a state of tug-of-war, influenced by various macro factors, creating clear two-way trading opportunities.
📰 Macro Analysis: Interwoven Market
Gold prices are currently caught between three main streams of information:
Support (Bullish): The Israel–Hamas conflict and escalating geopolitical risks remain the main "safe haven" factor, keeping Gold prices anchored at high levels.
Pressure (Bearish): Signs of "cooling down" in US-China trade tensions reduce the demand for safe haven assets and restrain Gold's upward momentum.
Long Term (Bullish): Expectations that the Fed will soon cut interest rates continue to support Gold in the long term, although it does not have a strong short-term impact.
This contradiction makes it difficult for the market to break further, instead necessitating a technical correction.
📊 Technical Analysis
The M30/H1 chart clearly shows the correction structure forming:
Declining Structure: Prices have formed a distinct peak and dropped sharply, breaking short-term upward structures. The current uptrend is merely a technical recovery wave.
Dominant Sell Zone: The $4306 zone is an extremely important confluence area. This is:
The 0.382 Fibonacci Retracement level, a common retracement ratio.
An old support zone that has been broken, now becoming strong resistance ("Sell fibonacci and support" on the chart).
A large previous liquidity area, where sellers will strongly defend this region.
Price Decline Target: The main target for this decline is the VAL (Value Area Low) zone of the Volume Profile indicator, around $4180. This is a high-volume trading area, where buyers are likely to return.
🎯 Detailed Trading Strategy
The main priority is to watch for selling at Fibonacci resistance zones.
Scenario 1: Sell Correction (Sell) 📉
Entry: $4306
Stop Loss (SL): $4312 (A tight, safe SL above the resistance zone)
Take Profit (TP): $4288 - $4265 - $4233 - $4210 - $4190 (Final target is the VAL zone)
Scenario 2: Buy at Strong Support Zone (Buy) 📈
Entry: Watch for buying when prices correct deeply to the VAL $4178 zone.
Stop Loss (SL): $4170
Take Profit (TP): $4198 - $4225 - $4246 - $4270
Summary
Although long-term macro factors continue to support Gold, technically, a mid-term correction has begun. The optimal strategy is to watch for selling (Sell) when prices recover to the confluence resistance zone $4306 and take profits at the targets below, especially the VAL $4180 zone.
Always manage your capital tightly. Wishing traders a successful week!
Note: This article is for reference only and is not investment advice.

Gold (XAUUSD) Analysis – October 20, 2025Gold continues to trade within a strong ascending channel, maintaining its medium-term bullish structure. After forming a corrective “V-shaped” recovery from the 4,220 support zone (aligned with the 100-EMA), buyers have stepped back in, defending the lower trendline.
Gold continues to trade within a strong ascending channel, maintaining its medium-term bullish structure. After forming a corrective “V-shaped” recovery from the 4,220 support zone (aligned with the 100-EMA), buyers have stepped back in, defending the lower trendline.
The price action now shows early signs of bullish continuation as momentum builds above the short-term moving averages (EMA20 and EMA50). A clean break and retest above 4,260 could confirm a renewed push toward the upper boundary of the rising channel.
Key Technical Levels:
Support 1: 4,221 – confluence with EMA100 and local swing low
Support 2: 4,142 – deeper retracement area / 0.618 Fibonacci zone
Resistance 1: 4,290 – intraday pivot level
Resistance 2: 4,370 – upper channel target
Resistance 3: 4,450 – projected Fibonacci extension
Trading Strategy:
As long as gold holds above 4,220, the short-term bias remains bullish. Traders may look for confirmation of higher lows around the EMA cluster to position for a breakout toward 4,370–4,450.
If the structure fails below 4,220, a deeper correction toward 4,140 may unfold before buyers re-emerge.
Outlook:
Momentum indicators show recovery potential after a technical pullback. A breakout continuation scenario remains the primary bias, supported by trendline structure and moving average alignment.
Keep this setup on your watchlist and follow for more in-depth strategies in the upcoming sessions.

Global Uncertainty, Fed Moves, and the Golden Opportunity AheadHey everyone, good to see you here. Let’s unpack what’s been happening with gold after another explosive week in the markets.
Last Friday, gold pushed to new record highs, touching close to 4,400 before heavy profit-taking kicked in during the US session. The pullback shaved roughly 165 off the top, but even with that drop, gold still managed to close the week nearly 6% higher. That makes it nine straight weeks of gains — an incredible run we haven’t seen in years. Since this short-term rally began, gold’s climbed more than 25%, outperforming the 2020 surge that once shook the market.
So what’s driving this strength? It’s a mix of global uncertainty, geopolitical tensions, and traders positioning around the Fed’s policy shift. Rate cuts and the looming risk of a US government shutdown have added volatility, but also reinforced gold’s status as a safe-haven play. Every dip so far has been met with buyers stepping in confidently — a clear sign that sentiment remains firmly bullish.
Technically, the 4,200 zone stands out as key support. As long as price holds above it, the “buy-the-dip” strategy stays valid. The Fibonacci retracements around 0.5 and 0.618 align perfectly with this level, highlighting an area where buyers could reload before the next leg up.
If momentum keeps building, the path toward 4,500 looks open and realistic. The trend is strong, the fundamentals are supportive, and gold continues to attract both institutional flows and retail interest.
Right now, gold isn’t just shining — it’s commanding attention. The question is, are you watching closely enough to catch the next move?

Gold’s Golden Retest?Gold continues to trade within a rising blue channel, maintaining its overall bullish structure.
Currently, price is retesting the intersection between the lower blue trendline and the red structure zone, which has acted as strong support multiple times.
As long as this confluence area holds, I’ll be looking for trend-following longs targeting the upper boundary of the channel.
A break and close below this zone would temporarily pause the bullish momentum and open room for a deeper correction.
⚠️ Disclaimer: This is not financial advice. Always do your own research and manage risk properly.
📚 Stick to your trading plan regarding entries, risk, and management.
Good luck! 🍀
All Strategies Are Good; If Managed Properly!
~Richard Nasr
