Gold Pops 5% as Fed Fears Drive Demand. New Record High Soon?Gold bugs are doing well this summer.
The yellow metal OANDA:XAUUSD just logged its best monthly performance since April, climbing nearly 5% in August and closing at $3,447 per ounce on Friday – its highest level since mid-June.
As stock bros take a break for Labor Day on Monday, gold bugs are pushing higher, challenging the current all-time high with another leg up to $3,490. But before the ATH hits, let's see how we got here.
Between Fed drama, Trump-vs-Lisa Cook headlines, and falling yields , gold suddenly looks like the life raft everyone wants.
🕺🏻 Let’s break it down. 🤸♀️
🏦 Fed Drama Meets Gold Fever
When politics and monetary policy collide, volatility follows – and gold traders have been feasting on it.
President Donald Trump’s latest target? Lisa Cook, a Biden-appointed Fed governor and one of the crew of seven responsible for setting interest rates. Trump wants her out, she wants to stay , and a federal court hearing wrapped Friday without a ruling on whether he can fire her while her lawsuit plays out.
The bigger picture: this fight is about Fed independence – or what’s left of it. A perceived White House grip on rate decisions injects more uncertainty into markets, and when things get murky, gold shines.
Traders don’t just buy bullion for safe-haven vibes; they’re hedging against the possibility that the Fed is less independent than we thought. The Trump-vs-Lisa Cook fight is a precedent, a sight never seen in the history of America.
📉 Rate Cut Bets Are Back on the Table
Friday’s inflation data – the Personal Consumption Expenditures ECONOMICS:USPCEPI price index – came in exactly as expected, up 0.2% month-over-month and 2.6% year-over-year. Core PCE clocked in at 2.9%, in line with consensus.
That’s the Fed's favored inflation metric so it holds big weight when central bankers get together to decide whether to keep, hike, or cut borrowing costs.
Last month's readout showed predictable numbers that set off a chain reaction: markets are now pricing in a 90% chance of a September rate cut, as per the CME FedWatch tool.
Rates are instrumental in adjusting the prices of gold because it doesn’t pay any yield. In a high-rate world, holding bullion means losing out on returns you’d get from Treasuries or savings accounts – a classic opportunity cost, in economic lingo.
But when rates drop, that cost shrinks, and the shiny metal suddenly looks far more attractive as a store of value rather than a drag on returns.
In short, lower yields + lower dollar = stronger demand for gold. And with the dollar down 2.2% in August, the tailwind is getting stronger, helping explain gold’s upswing.
📈 A Double Top… or a Line Crossed?
Here’s where things get spicy for chart-watchers.
Friday’s rally pushed gold right up against its mid-June peak above $3,440 per ounce, forming what looked suspiciously like a double top pattern – a bearish setup where prices stall twice at the same resistance level before heading lower.
Only that, it didn't take long for momentum to carry gold past the double-top pattern and into record-close territory.
Fast fact: gold’s record high is just about $10 to $30 away from current market prices. The precious metal hit $3,500 in late April, just before shaving off some $200 in a bruising two-day wipeout .
🛍️ Why Gold Is Back in Fashion
Gold’s rally is about technicals as much as it is about vibes and fundamentals. And right now, the macro backdrop is doing the heavy lifting:
Fed policy uncertainty is making traders nervous
Political drama over Fed independence is adding fuel
Falling yields are pulling investors into non-yielding assets
Dollar weakness is inviting overseas buyers to pile in
👀 What Traders Should Watch Next
This week could be pivotal for gold’s next leg:
The upcoming nonfarm payrolls ECONOMICS:USNFP report on Friday will set the tone. Prediction gurus have pinned their expectations at 78,000 hires in August, about the same as the previous month’s 73,000.
What about revisions? That’s a thing now, after the last reading trimmed 258,000 jobs off May and June.
A weak jobs print would reinforce fears of a slowing economy, cementing expectations of a September rate cut – a potentially bullish setup for gold. On the flip side, a blowout number could cool the rally.
Also on deck: more chatter from the Federal Reserve ahead of its September 16-17 meeting, especially around the firing of Lisa Cook.
For now, traders are watching the $3,450–$3,460 resistance zone like hawks. That’s the line between a short-term top and a fresh breakout.
👉 The Takeaway
Gold just had its best monthly run in four months, but it’s walking a tightrope at a critical resistance level. With prices less than 1% away from the all-time high, the next move could define the rest of the quarter for bullion (and maybe even the fourth quarter).
If you’re trading this, two camps are emerging:
Breakout believers think falling yields and the mosaic of data are about to send prices ripping above $3,500.
Doom-and-gloom permabears see more froth than substance, saying prices can only go one way from here.
Off to you: Which side are you on? Share your thoughts and observations in the comments!
Gold

XAUUSD BUY AT 3320.5 and Target at 3466.2 Before 25th AugustXAUUSD BUY AT 3320.5 and Target at 3466.2 Before 25th August 2025, This Gann Method, Do your analysis and check according to your analysis,
XAUUSD BUY

Gold (XAUUSD) – Short SetupGold is currently trading around $3,405 and moving directly into a strong resistance zone between $3400 – $3450. Price is entering a Reversal Zone around that price range, where previous attempts to break higher have failed multiple times.
The structure shows that gold is testing the upper resistance line again, while momentum indicators are already showing signs of exhaustion. If price rejects this area, I expect a potential move down to the following targets:
Target 1 (T1): $3,348
Target 2 (T2): $3,286
Target 3 (T3): $3,169
Stop Loss (SL): Above $3,450
If price breaks above this level with strong volume, the setup becomes invalid.
Summary:
I expect a rejection around the resistance zone and a potential pullback towards lower support levels. If the the resistance zone holds, this setup offers a good risk-reward ratio to the downside.
No financial advice – just my personal trade idea based on my chart.

DeGRAM | GOLD above the channel📊 Technical Analysis
● Gold rebounded strongly from the 3,320–3,330 support zone, breaking above the descending channel and confirming bullish takeover.
● Price is holding above 3,374 support, with momentum aiming toward the 3,401 resistance and potential extension to 3,433 if buyers sustain pressure.
💡 Fundamental Analysis
● Weakening US dollar amid cooling labor market signals and dovish Fed commentary supports gold’s role as a hedge, with investors rotating back into safe-haven assets.
✨ Summary
Bullish above 3,374; targets 3,401 → 3,433. Invalidation on a close below 3,359.
-------------------
Share your opinion in the comments and support the idea with a like. Thanks for your support!

GOLD (XAUUSD): ATH Soon! What's Next?!
What a market opening on Gold!
Bull run continues, and the price is going to reach a current All-Time High soon.
Watching how strong is the momentum, it feels like the market is going to
update the ATH.
Your next confirmation to buy will be a daily candle close above 3500.
❤️Please, support my work with like, thank you!❤️
I am part of Trade Nation's Influencer program and receive a monthly fee for using their TradingView charts in my analysis.

xauusd near ATH!! Whats nextGold is near its ATH, almost about 4months back, just observe the candle on the monthly levels,
this week, 1st September to 5th September, there is only news and daily. While gold is at an all-time high, i am noticing the trend is not that strong, small HH and quick pullbacks, which usually indicate the selling might come. Be very cautious of trading this week because of news and ATH. might want to protect your capital rather than FOMO entry

Gold 30Min Engaged ( Bullish Reversal Entry Detected )Time Frame: 30-Minute Warfare
Entry Protocol: Only after volume-verified breakout
🩸Bullish Reversal - 3455
➗ Hanzo Protocol: Volume-Tiered Entry Authority
➕ Zone Activated: Dynamic market pressure detected.
The level isn’t just price — it’s a memory of where they moved size.
Volume is rising beneath the surface — not noise, but preparation.
🔥 Tactical Note:
We wait for the energy signature — when volume betrays intention.
The trap gets set. The weak follow. We execute.
CaptainVincent | Gold in a tug-of-war amid new geopolitical bloc1. News Waves 🌍
At a 2-day summit in Shanghai, Prime Minister Modi and President Xi Jinping announced that India and China will become development partners instead of rivals.
The summit also included Russia and four Central Asian countries, aiming to establish a Global South bloc to counterbalance the U.S. and the West.
👉 This highlights a geopolitical power shift, raising concerns over global polarization → gold maintains its safe-haven appeal.
2. Technical Outlook ⚙️
On the H2 chart, gold has printed Higher Highs after its recent strong breakout.
Storm Breaker 🌊 (Sell Zone 3511 – 3518): strong resistance, potential supply if retested.
Golden Harbor 🏝️ (Buy Zone 3450 – 3448): confluence of FVG + Fibonacci 0.5/0.618 , key support for a rebound.
Main trend: gold may continue ranging within 3450 – 3510 before choosing a major direction.
3. Captain Vincent’s Map – Trade Scenarios 🪙
🔻 Storm Breaker 🌊 (SELL Reaction)
Entry: 3511 – 3508
SL: 3518
TP: 3505 → 3500 → 3497 → 349x → 348x
🏝️ Golden Harbor (BUY Zone – strong support)
Entry: 3450 – 3448
SL: 3440
TP: 3453 → 3456 → 3459 → 3462 → 346x
4. Captain’s Note ⚓
“Political news continues to stir the gold sea 🌊. Bears are waiting at Storm Breaker 3511 , but the safe harbor remains Golden Harbor 3450 – 3448 . In an unpredictable environment, prioritize short-term SELL setups to ride with safe-haven flows, instead of recklessly challenging the rough waves.”

Gold (XAU/USD) 1st September 2025🔎 Market Context
Gold continues to trade within a high-liquidity environment, driven by ongoing flows between equity risk sentiment, real yields, and dollar positioning. With the $3500 psychological level acting as a liquidity magnet above, and demand clusters building in the $3440 region, today’s structure offers both sides of opportunity.
Our institutional framework layers multiple confluences across Daily → 4H → 1H, blending Smart Money Concepts (SMC), ICT, supply/demand, VWAP, and Fibonacci arrays. This ensures only the highest-probability zones are highlighted for execution.
🟢 Buy-Side Liquidity Zones
Primary Buy Zone – $3438 to $3446 (Golden Zone)
Why This Matters:
Daily demand + fresh 4H Order Block.
NY session low sweep + Asia accumulation base.
Fibonacci 61.8% retracement cluster.
Hidden RSI bullish divergence + anchored VWAP support.
Execution Plan:
Entry: $3440 – $3444
SL: $3432
TP1: $3476
TP2: $3490
Strength Score: 9/10 (A+ Institutional)
Secondary Buy Zone – $3410 to $3418
Why This Matters:
Deep daily demand retest.
Weekly VWAP lower band + 78.6% retracement.
Sweep of last week’s low + $3415 round magnet.
Execution Plan:
Entry: $3412 – $3416
SL: $3402
TP1: $3442
TP2: $3470
Strength Score: 6/10 (Medium Zone)
🔴 Sell-Side Liquidity Zones
Primary Sell Zone – $3488 to $3496
Why This Matters:
4H supply aligned with 1H bearish OB.
Daily swing high liquidity resting at $3492.
Volume Profile POC + $3490 magnet.
Overbought RSI with bearish divergence on 1H.
Execution Plan:
Entry: $3490 – $3494
SL: $3504
TP1: $3460
TP2: $3446
Strength Score: 8/10 (Strong Zone)
Secondary Sell Zone – $3518 to $3526
Why This Matters:
Higher-timeframe supply continuation.
Liquidity sweep of quarterly highs near $3520.
Options expiry gamma cluster in $3520s.
Execution Plan:
Entry: $3520 – $3524
SL: $3532
TP1: $3490
TP2: $3465
Strength Score: 5/10 (Medium Zone)
🏆 Golden Zone of the Day
👉 Primary Buy Zone ($3438 – $3446)
Best alignment across institutional confluences.
High conviction zone with clear liquidity sweep and macro alignment.
Execution favors long positioning with SL $3432 | TP1 $3476 | TP2 $3490.
📌 Final Bias
Longs favored on dips into $3440 Golden Zone.
Sells only valid if liquidity sweeps extend into $3490/$3520 zones.
Maintain disciplined risk with tight stops below liquidity pockets.

XAUUSD GOLD TO THE MOON !!Gold to the moon !!1
sell of we currently see is only the 4th wave correction .
5th wave will soon kick in , generally the 5th wave up is a parabolic move to the moon where
we will place a gold flag on .
tp 3600 and above .

Gold XAUUSD Intraday Analysis 01.09.2025Structure: Gold has broken upward impulsively, forming a higher-high structure, suggesting continuation toward 3500 and possibly 3525.
The immediate support zones (3469–3472 and 3452–3455) are valid demand areas aligning with recent consolidation and order blocks.
If price retraces into 3469–3472, a bullish rejection candle or structure shift on lower timeframes (5m/15m) would validate buys.
If liquidity is swept below 3469, the deeper demand zone 3452–3455 offers a safer long entry with reduced downside risk.
Upside targets remain:
3500 (first liquidity pool / round number resistance)
3525.00 (next extension target)
Invalidation: A sustained close below 3450 would weaken the bullish setup and open room for further downside.
Buying Idea 1:
Entry: 3469–3472
Stop: Below 3460
Target 1: 3500
Target 2: 3525
Buying Idea 2 (safer but deeper):
Entry: 3452–3455
Stop: Below 3440
Target 1: 3500
Target 2: 3525
Aggressive Continuation Buy:
If gold breaks above 3490 with strong momentum and volume, consider chasing continuation toward 3500, but with tighter risk management.

Gold 01/09: FVG Retracement – Buy the Dip, Short 3515SMC Analysis for 01/09
Gold continues to maintain a bullish order flow after clear BOS and ChoCH confirmations. Price has created an FVG (Fair Value Gap) around 3463 and is currently moving toward the 3515 supply zone.
✅ BUY Scenarios
• Buy Zone 1: 3418 – 3422
o Demand zone aligned with trendline + liquidity sweep.
o SL 3410
o TP: 3430 – 3445 – 3455 – 3460+.
• Buy Scalp Zone: 3352 – 3350
o Deep liquidity grab area for quick scalp.
o SL 3344
o TP: 3360 – 3380 – 3400.
👉 All buy zones follow the dominant bullish structure. The best strategy is to wait for retracements to enter long.
❌ SELL Scenario
• Sell Zone: 3515 – 3517
o H1 supply zone overlapping resistance.
o SL 3522
o TP: 3500 – 3485 – 3475 – 3465 – 3450.
👉 Short trades are only for quick pullbacks. Larger bias remains bullish unless a strong bearish ChoCH develops.
________________________________________
📌 Conclusion:
• Main bias: Buy the dip at 3415–3422, 3442–3447, and scalp at 3352–3350.
• Secondary play: Sell 3515–3520 back to demand.
• Keep an eye on FVG 3463 as the key reaction level.

XAU 90% Chance of hitting ALL TIME HIGHS?!Please let me know what you think. If I missed any details that may be important please let me know.
This is my way of giving back while getting other's opinions.
Thanks 🙏🏾

Will Gold Back Again To 3400 ?Market Context
• Price has shown multiple bullish break of structure, confirming short-term bullish order flow.
• A supply zone around 3449 – 3451 may provide liquidity for a reaction.
• The fair value gap between 3360 – 3310 remains unfilled and could attract price.
________________________________________
Key Levels
• Supply Zone: 3449 – 3451
• Buy Zone 1: 3396 – 3400 (SL 3390)
• Buy Zone 2: 3310 – 3315 (SL 3303)
• FVG Zone: 3360 – 3310
________________________________________
Trading Scenarios
Primary Buy Setup
• Entry: 3396 – 3400
• Stop Loss: 3390
• Target: 3449 – 3460 liquidity sweep
Secondary Buy Setup
• Entry: 3310 – 3315
• Stop Loss: 3303
• Target: 3396 – 3449
Counter-trend Sell
• Entry: 3449 – 3451 if rejection occurs
• Stop Loss: above 3458
• Target: 3400 demand
________________________________________
Summary
The main bias remains bullish with two buy zones identified: 3400 for a shallow entry and 3310 for a deeper liquidity sweep. Short positions at supply should only be considered as counter-trend scalps.

Go long after gold fluctuates and pulls back#XAUUSD
Against the backdrop of the "de-dollarization" trend, gold's position as the preferred safe-haven asset has gradually become more prominent.🌈
Influenced again by news this morning, gold retreated slightly before continuing its short-term bullish trend.📈 The current gold price is consolidating around 3375, with bulls dominating the day.📊
All short-term technical indicators are overbought, and there is a need for a technical correction. The short-term upward pressure is focused on the 3490-3500 range.🥅 However, it is worth noting that the U.S. market is closed today and there is a lack of sufficient capital flow during the NY session. ⚖️If the upper resistance cannot be effectively broken through in the Asian and European sessions, there is a possibility of a shock correction during the day.📉
It encountered resistance and pressure on the upper 3490-3500 level for the first time during the day. 📉You can consider shorting with a light position and wait for a pullback.🐻 Focus on the effectiveness of the support level of 3355-3345 below. You can go long if it retraces but does not break through.🐂
This week's data is relatively concentrated, and interest rate cuts may trigger unilateral market trends at any time. Independent traders must trade with caution, strictly follow the plan, and avoid the uncontrollable risks brought about by frequent trading.📰

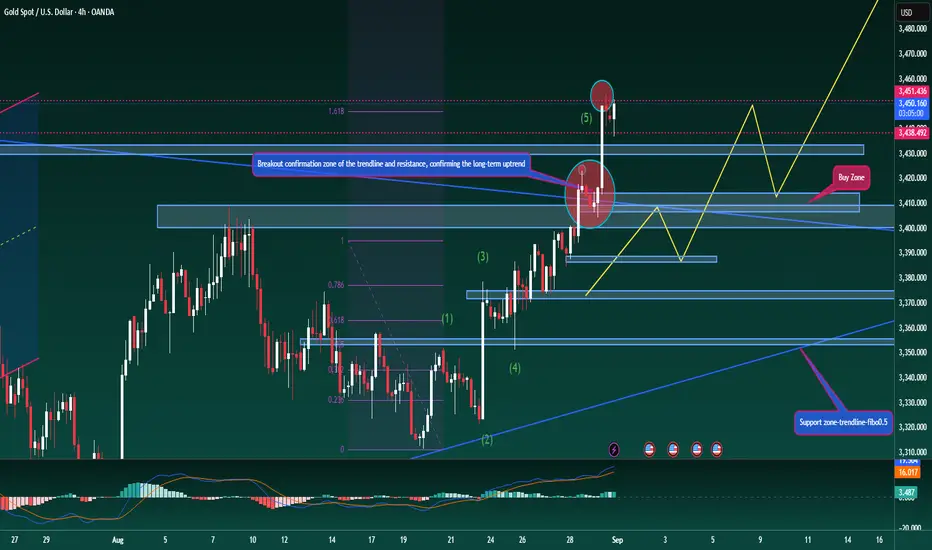
Hellena | GOLD (4H): LONG to resistance area of 3460.Dear colleagues, the idea is generally simple and clear.
In the upward movement of waves “3”, “4”, “5” the price should update the maximum of waves ‘D’ and “B” 3448.87.
This means that we should expect the price in the area of 3460.
The target is quite close and I think there is reason to believe that it will be reached next week.
Manage your capital correctly and competently! Only enter trades based on reliable patterns!

XAU/USD – Gold Pushes Toward 3,480 ResistanceHello everyone, last week gold had quite an impressive rally, recording a gain of around +2%, equivalent to more than $70, as the price climbed from the 3,380 area to nearly 3,450. This indicates that buying pressure continues to dominate the market.
Looking at the H2 timeframe, the uptrend remains intact as the price maintains a higher high – higher low structure, combined with trading volume favoring the bulls. The 3,455–3,463 zone is acting as short-term resistance; if broken decisively, gold could extend its rally toward 3,478–3,480. On the other hand, the 3,405 area will serve as a key support; only if an H2 candle closes below this level will the bullish structure face the risk of being invalidated.
The main short-term trend still leans bullish, although some technical pullbacks may occur when approaching strong resistance.
What do you think about this move? Does gold have enough momentum to break resistance and extend its rally? Share your thoughts below!

Gold Trading Scenario – Start of the WeekGold Trading Scenario – Start of the Week
Hello traders,
A new week begins with gold holding steady above the 34xx zone, establishing a fresh value area. The current structure has already broken through key resistance levels on the higher timeframe – including the daily trendline and H4 barriers – confirming strong bullish momentum.
The rally played out exactly as expected, reaching the target around 3450 (with a high of 3454). Price is now showing a slight pullback. This will only be seen as a trend reversal if price breaks below 3404. Otherwise, it’s simply a secondary correction in line with Dow Theory.
Wave 5 may have already completed, but the ABC structure is not yet clear. For that reason, I continue to favour buying in line with the trend to maintain higher probability setups.
Buy zone for today: 3408–3412. This area previously acted as resistance, but was broken on Friday and now serves as a solid support region.
This is my medium-term outlook for gold at the start of the week. Take it as reference, and feel free to share your thoughts in the comments so we can discuss further.
Gold Futures | New Month Setup – ATH on Deck?Price has been bullish all week with no significant pullbacks. Now as we step into a new month, Gold is pressing toward the previous All Time High (green line).
Key Notes:
Market left behind a bullish H4 FVG that could serve as a retracement zone.
With Labor Day Monday (early close for NY), setups may be quieter until Tuesday.
My bias: looking for a possible pullback into the FVG before continuation higher into fresh ATHs.
Watching closely for price action around the previous ATH to confirm breakout or rejection.

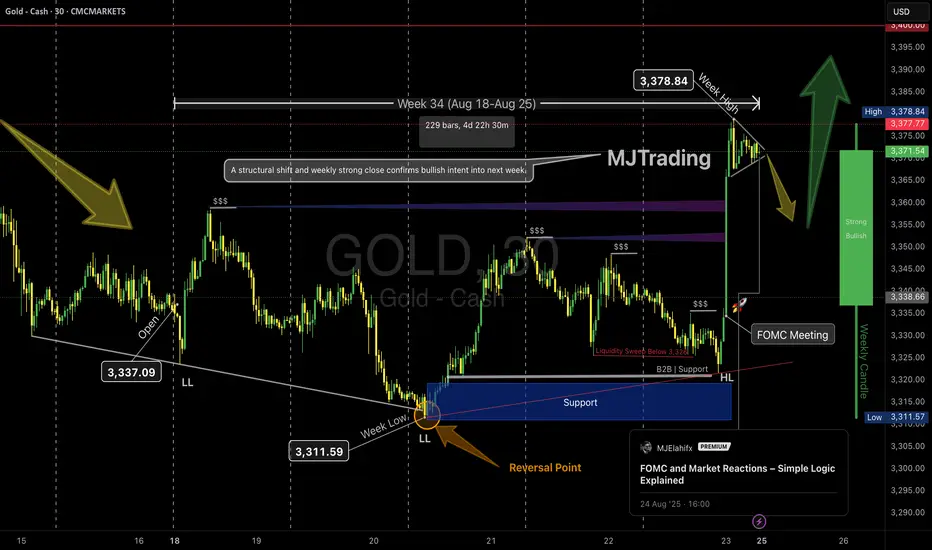
Weekly Recap – Gold (Week 34: Aug 18–25)💎MJTrading
📸 Viewing Tip:
🛠️ Some layout elements may shift depending on your screen size.
🔗 View the fixed high-resolution chart here:
📊 Market Overview
TVC:GOLD started the week under pressure, extending its decline to print a weekly low at 3,311.59. The decline created a lower low (LL) and set the stage for a potential structural shift.
Following the liquidity sweep below 3,326, buyers stepped in strongly, defending the blue support zone. This reversal point became the foundation for the week’s bullish recovery.
🔑 Key Highlights
Liquidity Event: A deep sweep beneath support flushed weak hands before institutional demand entered.
Reversal Point: Marked at the second LL, where aggressive buyers regained control.
Support Zone: Held firmly, leading to a sustained bullish rally.
FOMC Meeting: Served as a catalyst, triggering a breakout above 3,338.66 and confirming bullish intent.
Weekly High: Gold rallied sharply into 3,378.84, breaking structural barriers and leaving behind liquidity zones ($$$).
🟢 Weekly Candle Sentiment
The weekly close was strongly bullish, showing conviction after weeks of mixed momentum. The structural break confirms a shift in market intent. With buyers reclaiming control, sentiment points to further upside potential into next week, provided pullbacks remain above the 3,338–3,345 support band.
🔮 Outlook for Next Week
As long as 3,338 holds, the path of least resistance remains to the upside.
Short-term consolidation above support could lead to a continuation towards 3,390–3,400.
A weekly strong close suggests market participants are positioning for extended bullish momentum.
✅ Summary:
Week 34 showed a clean reversal from liquidity sweep → support defense → bullish breakout. With strong weekly close, the bias for next week is bullish continuation, though traders should watch for minor retracements back to support zones for potential re-entries.
#Gold #Xauusd #Forex #MJTrading
Psychology Always Matters:
GOLD (XAUUSD): Bullish! Look For Buys!In this Weekly Market Forecast, we will analyze the Gold (XAUUSD) for the week of Sept 1 - 15th.
Gold has been ranging for months. August closed strong, above the high of July. I am looking for continuation of this bullish momentum in September.
Wait for buying opportunities. Be patient. +FVGs will form, and present the best POIs for long entries.
Enjoy!
May profits be upon you.
Leave any questions or comments in the comment section.
I appreciate any feedback from my viewers!
Like and/or subscribe if you want more accurate analysis.
Thank you so much!
Disclaimer:
I do not provide personal investment advice and I am not a qualified licensed investment advisor.
All information found here, including any ideas, opinions, views, predictions, forecasts, commentaries, suggestions, expressed or implied herein, are for informational, entertainment or educational purposes only and should not be construed as personal investment advice. While the information provided is believed to be accurate, it may include errors or inaccuracies.
I will not and cannot be held liable for any actions you take as a result of anything you read here.
Conduct your own due diligence, or consult a licensed financial advisor or broker before making any and all investment decisions. Any investments, trades, speculations, or decisions made on the basis of any information found on this channel, expressed or implied herein, are committed at your own risk, financial or otherwise.

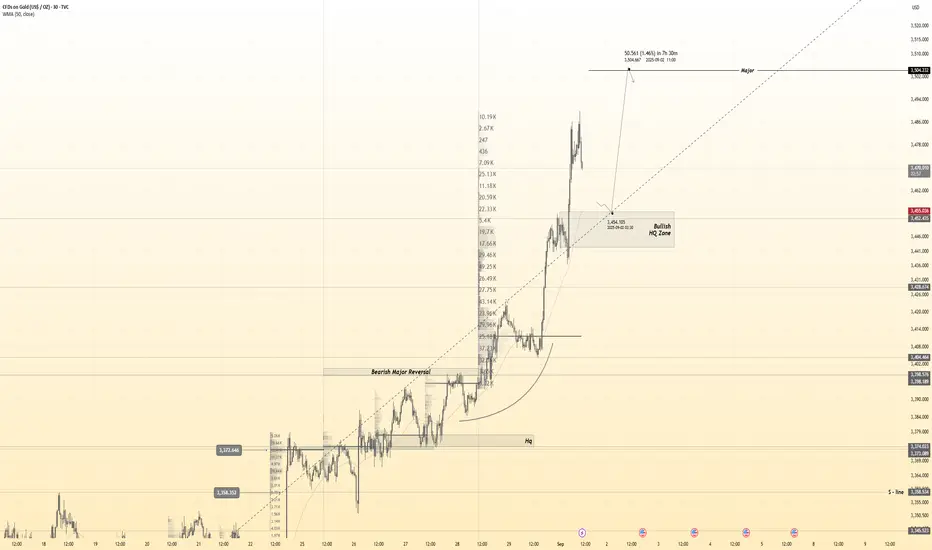
𝐌𝐓𝐗 | Buy-Side Sweet Spot in Gold’s Correction📌 From previous analysis:
• We anticipated corrective pullbacks and highlighted reversal zones.
• Focus was on 436–432 as the first critical support/resistance area.
⸻
1️⃣ Key Reversal Levels
There’s two scenarios in this rally:
A)
• 436 – 432 → First potential bullish reversal zone.
• 4H close above 435 → upside continuation toward 442 → 447 → 452.
B)
• 4H close below 432 → decline into 420.
• 420 – 415 is the strongest weekly demand zone (high-probability bullish bounce).
⸻
2️⃣ Continues Bullish Scenario
• 4H close above 454 → opens the way to 467.
• Stabilization above 467 → next major upside target 484.
✴️Plus Tip:
Daily closes above 420-415 zone supports the bullish momentum.
⸻
⚖️ Summary:
Gold is starting the month at a decisive zone (436–432). Holding above 435 favors further upside toward 452, while losing 432 puts the strong 420–415 demand zone into play. A confirmed breakout above 454 could accelerate the rally toward 484.

Gold | Oil | Dollar | Silver | Natural Gas Price ForecastGold | Oil | Dollar | Silver | Natural Gas Price Forecast
COMEX:GC1!
COMEX:SI1!
AMEX:UNG
NYMEX:CL1!
