Gold Is on Fire: Can XAU/USD Hit $4130 Gold’s price is really strong right now. As long as gold stays above $4000, it can move up to $4130. But if gold drops below $4000, it could slow down or even start to fall.
What do you think will happen next, do you think gold will keep going up or fall back down? Have you ever watched gold make a big move before?
If you want to know what to do or have any questions, just ask me! Sometimes a simple question can help you learn something new about trading gold. What do you want to know about gold today?
Mindbloome Exchange
Trade Smarter Live Better
Gold

GOLD Intraday Chart Update for 15 Oct 25GOOD Morning Traders,
As long as GOLD sustains above 4080 FMP Level it will remains bullish however the only way to join Trend Rally is following Psychological Levels with 3080 chain
Major Support zone for the day is located @ 4130-4150 below this zone GOLD will move Towards 4100 or even 4080
Above 4150 Psychological Level GOLD Next Target will be 4230 FMP Level or even 4250
Disclaimer: Forex is Risky

Momentum Breakout into Strength | D-H Flip ConfirmedStrong continuation from last session’s impulsive push.
I caught my move during the Tokyo impulsive hour after price broke cleanly above 4175 — confirming a momentum breakout setup on the 15-min chart.
The previous Daily High (4191.2) has now flipped into solid support, reinforcing the bullish narrative I’ve been tracking since the start of the week.
My original weekly target was 4200 — we’ve exceeded that level now, and the momentum still looks healthy.
Price action is slowing ahead of the London session, which could set the stage for another expansion leg. If bullish pressure holds, I’m watching 4230–4250 next, with 4500 as a stretch target.
💡 Key Notes:
Setup: Momentum Breakout
Bias: Bullish
Entry: 4177.3 | Exit: 4185.1
Result: +$386 (5 Contracts)
Time in Trade: 42m
Context: Daily High Flip + Strong Impulse Continuation
#Gold #Futures #DayTrading #PriceAction #Breakout #TradingView #MGC #Trader #NoFOMO #Discipline #MomentumBreakout #ICTInspired

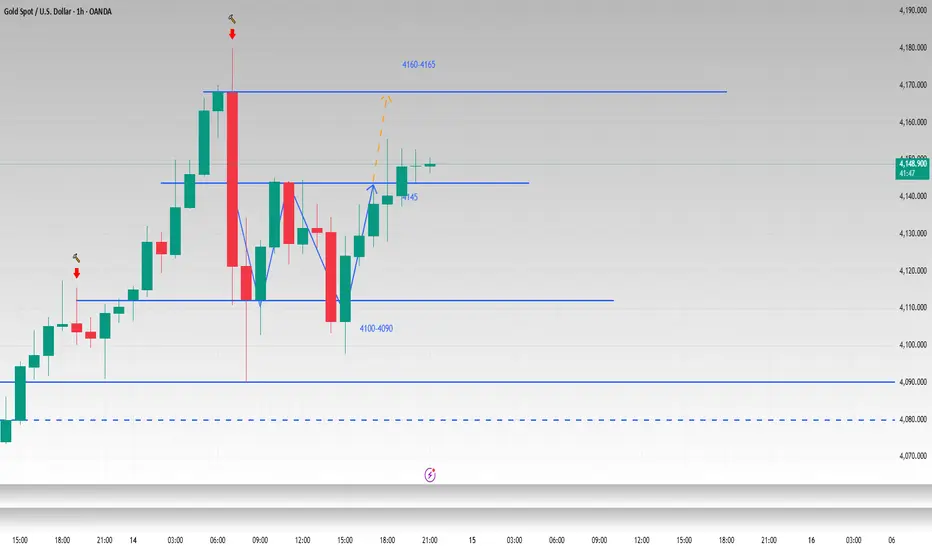
W pattern is established and the bullish pattern remain unchangeI have said before that gold is in a fluctuating upward state whether viewed from the weekly or daily charts, and there is no reversal signal. I mentioned in my previous post that from the hourly chart, gold has the prototype of a W shape, and the neckline is at 4145. In the evening of the US session, gold successfully broke through the neckline and touched around 4155. Although the bullish momentum of gold has stagnated slightly after a slow rise, I am still optimistic that gold will reach 4160-4165. If it falls back to around 4145-4135 again, we can still consider trying to go long on gold.
OANDA:XAUUSD
XAUUSD (Gold): buy setupXAUUSD (Gold): buy setup. Wait for a close in 1H and check for volume confirmation.
Cheers

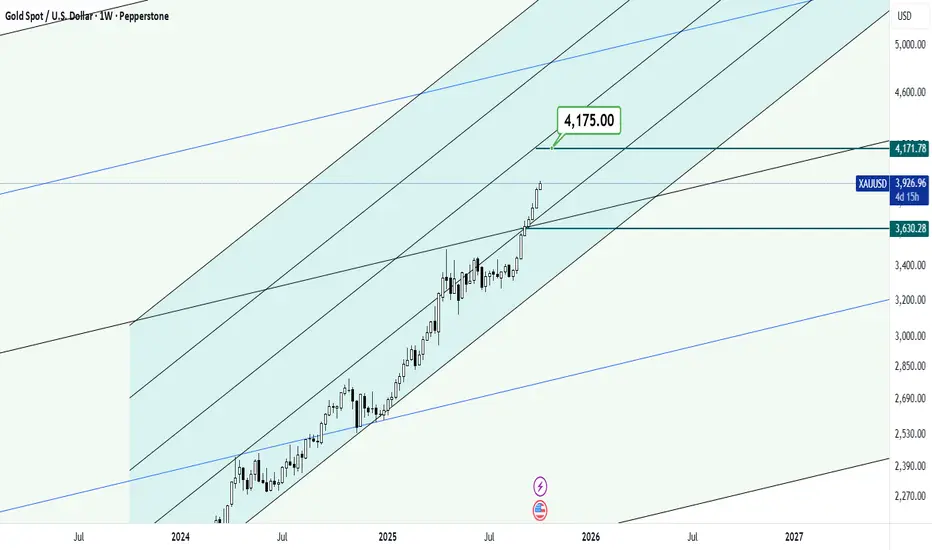
How can I justify this price?Whatever you understand, that was your concept!
Well, we are rapidly approaching the end of the gold bull run and prices are facing a much steeper slope in the weekly and monthly timeframes!
The target price at 4175 is not far away, but I think it is scary!
Good luck
Gold → Ready for the Next Bullish WaveGold (XAUUSD) continues to gain momentum as shifting global conditions drive investors toward safer assets. The ongoing uncertainty in financial markets, coupled with renewed concerns over U.S. fiscal policy and interest rate adjustments, has strengthened gold’s long-term appeal.
Recent market behavior reflects consistent institutional demand, with traders positioning ahead of potential monetary easing cycles. As confidence in traditional currencies weakens, gold remains a preferred store of value for both investors and central banks.
Structurally, the market is maintaining a healthy uptrend, showing controlled corrections within a broader bullish framework. The latest price movements suggest that momentum is building for another upward phase, possibly targeting new historical zones if global instability persists.
In summary, gold’s outlook stays constructive — supported by both macroeconomic sentiment and steady technical momentum.
How do you see the XAUUSD trajectory evolving — continuation of growth or a major pause ahead?

GOLD 4H CHART ROUTE MAP UPDATE & TRADING PLAN FOR THE WEEKHey Everyone,
Please see our updated 4h chart levels and targets for the coming week.
We are seeing price play between two weighted levels with a gap above at 4041 and a gap below at 3978. We will need to see ema5 cross and lock on either weighted level to determine the next range.
We will see levels tested side by side until one of the weighted levels break and lock to confirm direction for the next range.
We will keep the above in mind when taking buys from dips. Our updated levels and weighted levels will allow us to track the movement down and then catch bounces up.
We will continue to buy dips using our support levels taking 20 to 40 pips. As stated before each of our level structures give 20 to 40 pip bounces, which is enough for a nice entry and exit. If you back test the levels we shared every week for the past 24 months, you can see how effectively they were used to trade with or against short/mid term swings and trends.
The swing range give bigger bounces then our weighted levels that's the difference between weighted levels and swing ranges.
BULLISH TARGET
4041
EMA5 CROSS AND LOCK ABOVE 4041 WILL OPEN THE FOLLOWING BULLISH TARGETS
4099
EMA5 CROSS AND LOCK ABOVE 4099 WILL OPEN THE FOLLOWING BULLISH TARGET
4154
EMA5 CROSS AND LOCK ABOVE 4154 WILL OPEN THE FOLLOWING BULLISH TARGET
4212
BEARISH TARGETS
3978
EMA5 CROSS AND LOCK BELOW 3978 WILL OPEN THE FOLLOWING BEARISH TARGET
3916
EMA5 CROSS AND LOCK BELOW 3916 WILL OPEN THE SWING RANGE
3840
3767
EMA5 CROSS AND LOCK BELOW 3767 WILL OPEN THE SECONDARY SWING RANGE
3689
3632
As always, we will keep you all updated with regular updates throughout the week and how we manage the active ideas and setups. Thank you all for your likes, comments and follows, we really appreciate it!
Mr Gold
GoldViewFX

NZD/USD 30-minute chart Pattern...NZD/USD 30-minute chart, here’s a breakdown of what the setup shows:
The chart depicts a downtrend, but price is currently forming a potential reversal from a support zone (the rectangular box at the bottom).
A downtrend line has been broken or is about to be broken to the upside.
The Ichimoku cloud (yellow area) is overhead — suggesting resistance near that zone, but also my target point is drawn above the cloud.
Current price is around 0.5709.
✅ My target (as shown on the chart):
The “Target Point” is drawn near 0.5750–0.5760.
So the likely target zone for this bullish move is:
👉 0.5750 – 0.5760
⚠ Trading notes:
A clear break and close above 0.5715–0.5720 would confirm bullish momentum.
First resistance: 0.5730
Final target: 0.5750–0.5760
A logical stop-loss could be below 0.5690, beneath the recent support zone.

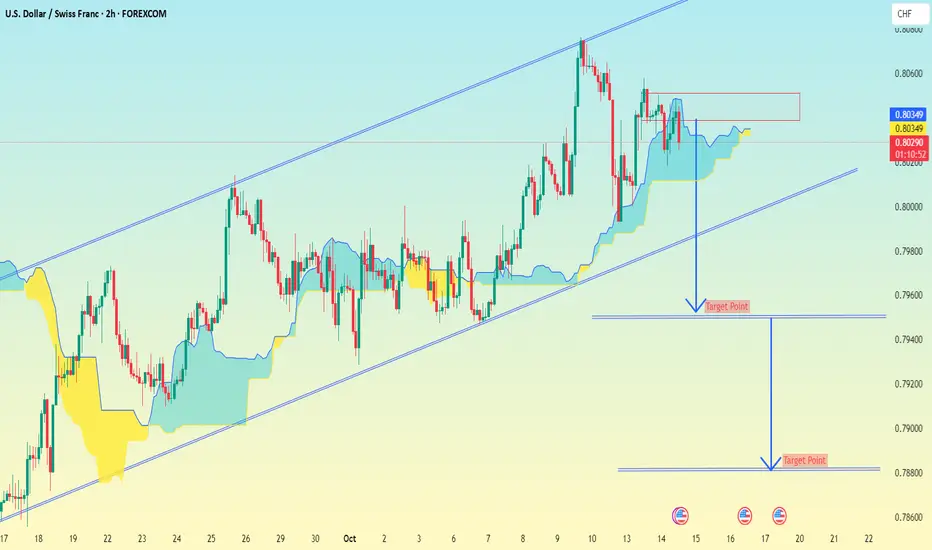
USD/CHF 2-hour chart Pattern..USD/CHF 2-hour chart, here’s a quick technical analysis breakdown based on what’s visible in my chart :
The chart shows a rising channel (uptrend) with price currently near the middle to lower zone of the channel.
My drawn two potential downward target projections labeled “Target Point.”
Price is around 0.8027 currently, with the first downward projection extending roughly to 0.7960, and the second one near 0.7875.
The Ichimoku cloud shows current price slightly above the cloud, but momentum seems to be weakening, suggesting possible correction.
✅ Targets based on my chart setup:
First target: 0.7960
Second (extended) target: 0.7875
These align with my drawn projections.
⚠ Trading note:
If you’re planning a short position, watch for a confirmed break below the channel support or below 0.8000, as that would confirm bearish continuation toward those targets. If price stays above the cloud or rebounds from the lower trendline, the bullish channel might still hold.
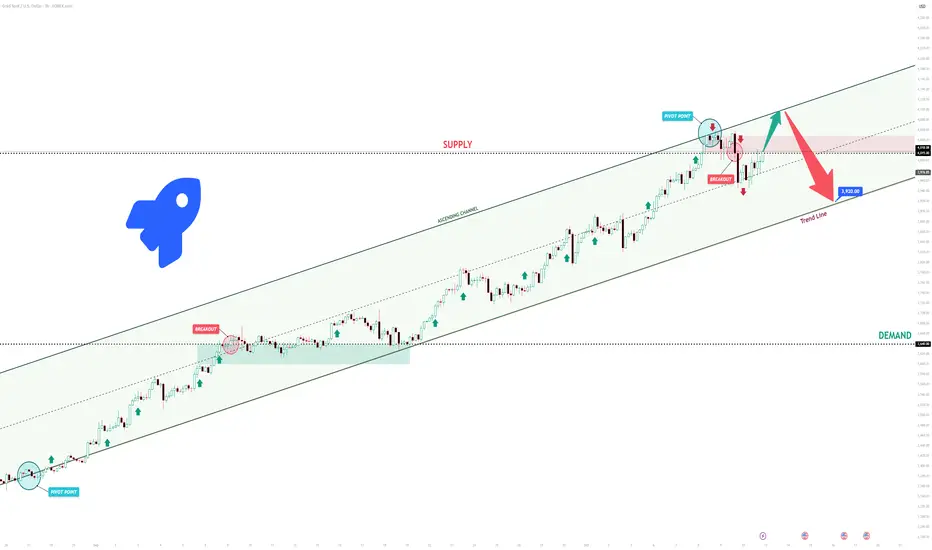
XAUUSD Short: Correction to 3920 Expected from the HighsHello, traders! The price auction for XAUUSD has been dominated by a strong bullish trend, which has been clearly defined by a large ascending channel. The market has consistently made higher highs and higher lows, breaking through key resistance levels like 3640 and showing that the buyer initiative has been in firm control of the trend.
Currently, the auction has reached a major point of contention at the 4015 supply level. The price is consolidating here, right below the upper resistance line of the ascending channel, after a failed initial attempt to break higher. This area represents a significant test for the continuation of the uptrend.
My scenario for the development of events is a 'blow-off top' followed by a correction. I believe the price will make one final push, breaking the 4015 level to touch the channel's upper resistance line. In my opinion, this move will be exhaustive, and a sharp reversal will occur from that line. The take-profit is therefore set at 3920, targeting a retest of the nearby trend line. Manage your risk!
XAU/USD | Gold Rockets Past $4090 – Over 1000 Pips Gained!By analyzing the Gold (XAU/USD) chart on the 30-minute timeframe, we can see that Gold continued its strong bullish momentum, exactly as expected, and successfully hit all our targets at $4006, $4016, and $4028, fully filling the FVG.
However, Gold didn’t stop there — it kept pushing higher and has just printed a new all-time high (ATH) at $4090!
This move has already delivered over 1000 pips of profit.
Key demand zones are now located at $4051–$4060 and $4020–$4024.
Given the current momentum, I expect Gold to continue rising toward targets above $4100 in the short term.
THE Previous TA :
Please support me with your likes and comments to motivate me to share more analysis with you and share your opinion about the possible trend of this chart with me !
Best Regards , Arman Shaban

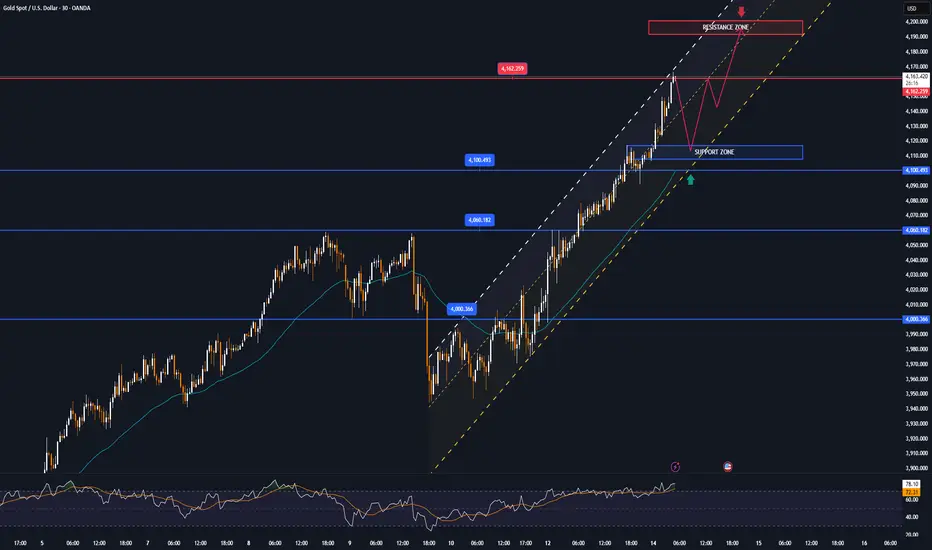
Gold (XAU/USD), 4H timeframe..Gold (XAU/USD), 4H timeframe — here’s what the technical setup indicates:
Current price: around $4,107
Structure: Rising channel (uptrend), but price recently rejected the upper boundary.
Indicators: There’s a clear blue arrow pointing downward, suggesting a short-term correction.
Support zones:
First near $4,050 – $4,030 (mid-channel support)
Second near $4,000 – $3,995 (cloud & lower trendline support — also marked “Target Point” on my chart)
✅ Short-term Target: $4,000 – $3,995
If the bearish momentum continues, it might test the lower edge of the Ichimoku cloud near $3,975.
⚠ Invalidation:
If price closes above $4,145, the bearish correction setup fails and the bullish channel continues.
So, my target zone = $4,000 ±10.

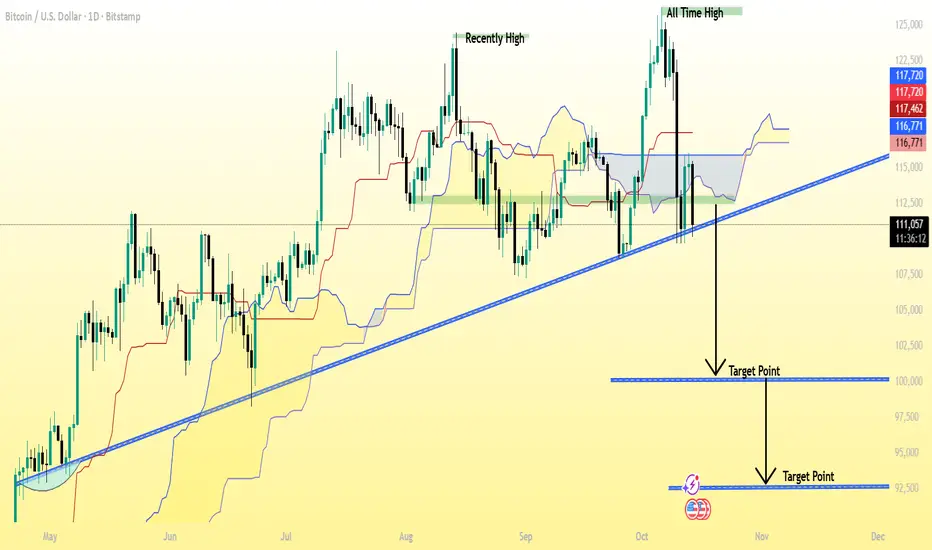
BTC/USD (Bitcoin) chart pattern..BTC/USD (Bitcoin) 1D (Daily) chart 👇
✅ Current Price: around $110,685
✅ Trend: Bearish breakdown — price has clearly broken below the long-term ascending trendline.
✅ Market structure: After rejecting near $117,000, BTC dropped below both the Ichimoku cloud and the trendline — confirming downside pressure.
---
🎯 Target Levels (Downside)
1. Primary Target: $100,000 – $98,000
2. Extended / Final Target: $94,000 – $92,000
This is the second target point shown on my chart.
It would be the next major support if BTC continues falling after $98,000 breaks.
---
🛡 Resistance / Stop-Loss
Immediate resistance: $113,000 – $114,000 (broken trendline retest zone).
Stop-loss for short trades: above $115,000 – $116,000 (invalidates bearish setup).
---
🔍 Summary
Trend bias: Bearish (break of trendline + below cloud)
Sell zone: $111,000 – $113,000
Target 1: $100,000 – $98,000
Target 2: $94,000 – $93,000
Stop-loss: above $115,000
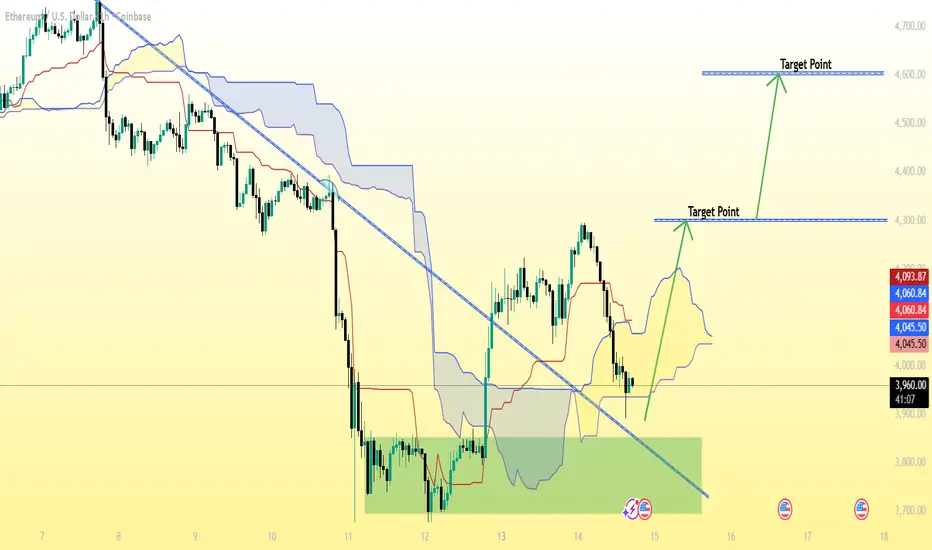
Ethereum (ETH/USD) 1-hour chart Pattern...Ethereum (ETH/USD) 1-hour chart from Coinbase, with Ichimoku Cloud and a downtrend breakout drawn — here’s the clear target breakdown:
🔹 Current Price
≈ $3,965
🔹 First Target Zone
$4,280 – $4,320
This aligns with the first “Target Point” shown on my chart.
It represents the initial resistance after a confirmed breakout and retest of the cloud.
may i expect some profit-taking or short-term pullback here.
🔹 Second Target Zone
$4,550 – $4,600
This is my final target on the chart.
It marks the upper resistance and aligns with the Ichimoku cloud’s future projection and previous structure highs.
---
📈 Summary:
Target Price Range Comment
🎯 Target 1 $4,280 – $4,320 Short-term target after breakout confirmation
🎯 Target 2 $4,550 – $4,600 Mid-term target if momentum continues
GBP/USD (1H chart) ...GBP/USD (1H chart)
Current price: around 1.3274
Breakout trendline: downward sloping, recently broken
Support zone: near 1.3200 – 1.3220 (highlighted green area)
Resistance/Target zones: marked as “Target Point” on my chart
From the chart structure and Ichimoku breakout:
🎯 Target Levels
1. First target (near-term): 1.3370 – 1.3380
→ This aligns with the first “Target Point” on my chart (post-breakout resistance area).
2. Second target (major target): 1.3470 – 1.3490
→ This matches my higher “Target Point” level and previous supply zone/resistance.
🔄 Summary
Target Type Price Zone Comment
TP1 1.3370 – 1.3380 Short-term breakout target
TP2 1.3470 – 1.3490 Extended bullish target if momentum continues
SL (Suggested) Below 1.3220 To protect against false breakout

XAU/USD Analysis – Gold Continues to Respect the AscendingGold remains strongly bullish within its rising parallel channel, confirming a sequence of higher highs and higher lows on the H1 timeframe. Each correction phase has been shallow and consistently supported along the midline, signaling strong buyer momentum and institutional support.
At the current stage, price has slightly rejected from the upper boundary near $4,145–4,160, suggesting a short-term pullback could occur before the next leg higher.
Key Technical Levels
Support zone: $4,085–$4,100 (previous swing low and trendline confluence)
Resistance zone: $4,185–$4,220 (channel top and Fibonacci 1.618 extension)
Trendline support: Holding firmly across all swing lows since late September
Trading Strategy
As long as price remains within the ascending channel, the bias stays bullish. The ideal strategy today is to:
Wait for a pullback toward the $4,085–$4,100 zone
Look for bullish confirmation (EMA rebound or RSI bounce from 50)
Target the next resistance around $4,200–$4,220
A clean break and close above $4,220 could open the path to $4,250+ in the upcoming sessions.
Summary
The market structure is still intact and momentum supports further upside. Short-term retracements can be used to re-enter long positions at better prices. Traders should maintain patience and discipline, aligning with the dominant bullish trend.
Remember — trend is your friend until it bends.
Follow for more daily gold strategies and updated setups.

XAUUSD: Market Analysis and Strategy for October 14thGold Technical Analysis
Daily Resistance: 4200, Support: 3945
4-Hour Resistance: 4180, Support: 4060
1-Hour Resistance: 4145, Support: 4090
From a technical perspective, after yesterday's surge to 4100, gold continued its upward trend today, challenging 4200, reaching a high near 4180. This also indicates that the market is entering a period of acceleration, and a significant downward correction is imminent.
As a result, gold and silver prices began to fall sharply in the Asian market today, with gold prices quickly falling from 4180 to 4090, a $90 drop in just one hour. While a $90 correction may seem significant, it's not an exaggeration compared to the period of the upward trend.
Of course, it's too early to say whether gold will continue to fall sharply. After all, several key levels (last week's high of 4060 and low of 3945) have not yet been broken. For now, the upward trend can only be considered a pause. As long as key support remains, the trend will not easily change.
Trading Strategy:
BUY: 4090near
BUY: 4060near

GOLD: Long Trading Opportunity
GOLD
- Classic bullish setup
- Our team expects bullish continuation
SUGGESTED TRADE:
Swing Trade
Long GOLD
Entry Point - 4137.6
Stop Loss - 4123.3
Take Profit - 4164.5
Our Risk - 1%
Start protection of your profits from lower levels
Disclosure: I am part of Trade Nation's Influencer program and receive a monthly fee for using their TradingView charts in my analysis.
❤️ Please, support our work with like & comment! ❤️

Gold’s Bull Run Continues – Target $4,080+Gold is clearly maintaining strong bullish momentum above $4,000. The market has maintained its upward trajectory since rebounding from the $3,900–$3,920 support zone. This zone acted as a solid demand area, leading to consistent higher highs and higher lows — a clear indication that buyers are dominating.
The recent price action shows a clean breakout above the $3,980–$4,000 resistance area, which has now turned into a new short-term support. The chart also marks a “Weak High” near the current level, suggesting that a minor pullback or consolidation could occur before another bullish push resumes. This retracement could test around $4,010–$4,020 before aiming higher.
The next major resistance levels are visible at $4,060, $4,075, and potentially $4,080–$4,100, which could be the next targets if bullish momentum continues. As long as gold stays above $4,000, the overall market bias remains positive. A sustained break below this zone might trigger a deeper correction toward $3,960 or even $3,940, but that currently looks less likely given the strong bullish structure.
In summary, the short-term outlook remains bullish with expectations of a possible brief dip before continuation toward $4,080+. The trendline support and consistent break of minor resistances confirm strong buyer confidence in the market.
Strong bullish trend continues
Key resistance: $4,072 → $4,132 → $4,150
Support to watch: $3,976 → $3,925
🔹 Buy Zone:
A potential buy zone lies between $4,010 – $4,025, where a short retracement is expected before the next upward move. This area aligns with minor structure support and trendline confluence, making it ideal for re-entry or fresh long positions.
🔹 Buy Trigger:
A strong buy trigger would be a bullish 1-hour candle closing above $4,045, confirming momentum continuation toward the next resistance targets at $4,065, $4,075, and $4,080+.
Note
Please risk management in trading is a Key so use your money accordingly. If you like the idea then please like and boost. Thank you and Good Luck!

Surpassing the $4,100 mark amid trade tensionsOANDA:XAUUSD rose sharply in the first session of the week, surpassing the 4,100 USD/ounce mark, a new record high, as investors sought refuge in the context of escalating trade tensions between the United States and China, along with expectations that the Federal Reserve (Fed) is about to start a cycle of interest rate cuts.
Earlier, in the trading session on Monday, Spot Gold increased by 2.34% to 4,110.30 USD/ounce, reaching an intraday peak of 4,117.27 USD, massive speculative money flows into the precious metal as global political and trade uncertainties continue to dominate.
Some investors believe that gold can easily maintain the current upward momentum, thanks to a combination of central bank buying, ETF inflows and expectations of Fed policy easing.
US-China tensions spark safe-haven buying
Gold prices accelerated after President Donald Trump announced a 100% tariff on imports from China and plans to control strategic software exports from November 1, a move seen as a response to Beijing's restrictions on exports of key minerals.
Although Trump assured on social media that "everything will be fine", the market still saw this as the start of a new round of escalation in the trade war.
The risk of additional 100% tariffs is still an unpriced variable and of course all risks are a lucrative bait for gold prices to continue to develop positively.
Fed Moves Closer to Taper Cycle
Expectations for Fed easing continue to underpin non-yielding gold. According to CME Group’s FedWatch tool, markets are pricing in a 97% chance of a 25 basis point cut in October, and a 100% chance of a cut in December.
Chair Jerome Powell is scheduled to speak at the National Association for Business Economics (NABE) annual conference on Tuesday, which is expected to provide further clarity on the path of monetary policy during this delicate period. A host of other Fed officials are also due to speak this week, as global financial markets react strongly to signals from Washington.
Gold Price Outlook: Long-Term Uptrend Strengthened
According to the latest forecasts, Bank of America and Société Générale both see gold prices surpassing $5,000 an ounce by 2026, while Standard Chartered has raised its 2025 target to $4,488.
Suki Cooper, global head of commodities research at Standard Chartered, said:
“The current rally still has room to run. A short-term technical correction could be a positive signal for a more sustainable uptrend.”
Finally, with trade tensions yet to ease and global monetary policy easing, gold continues to consolidate its position as a strategic haven asset in the current period of economic and geopolitical volatility.
Technical Outlook Analysis OANDA:XAUUSD
Main trend:
Gold continued its strong uptrend, closing around 4,142 USD/ounce, still within the main uptrend channel.
Resistance: 4,162 – 4,213 – 4,286 USD
Support: 4,100 – 4,060 – 4,000 USD
RSI > 75 shows extremely strong buying momentum, but short-term overbought, a technical correction may appear.
Overview:
The medium-term uptrend remains intact, the next target is towards $4,300, as long as the price holds above $4,000.
RSI warns of short-term fluctuations, prefer buying on corrections rather than chasing prices.
SELL XAUUSD PRICE 4200 - 4198⚡️
↠↠ Stop Loss 4204
→Take Profit 1 4192
↨
→Take Profit 2 4186
BUY XAUUSD PRICE 4113 - 4115⚡️
↠↠ Stop Loss 4109
→Take Profit 1 4121
↨
→Take Profit 2 4127
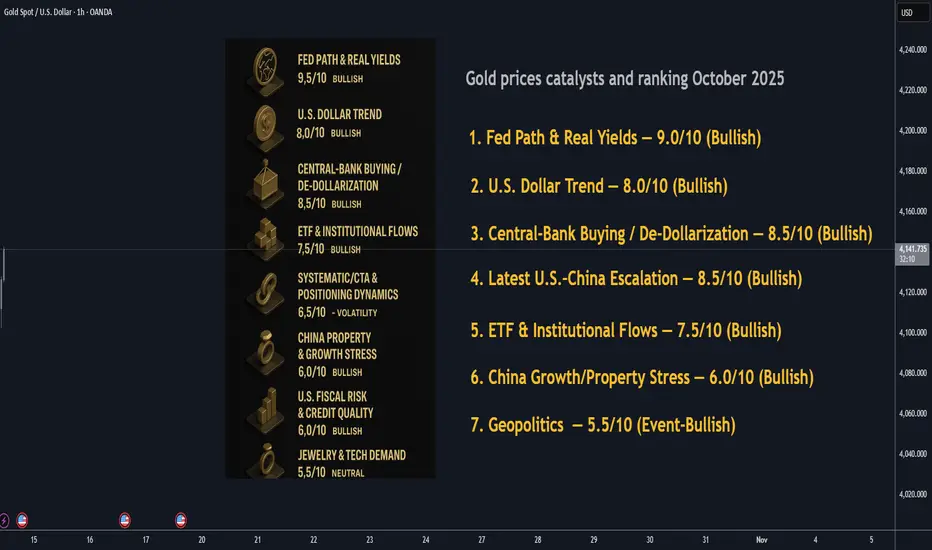
Gold Prices Overview of Primary Catalyst : October 2025📊 Catalyst Scorecard — Updated (10 = max bullish impulse)
1. Fed Path & Real Yields — 9.0/10 (Bullish)
Markets lean toward additional Fed cuts into year-end as labor-market risks build; dovish signaling around/after Jackson Hole has coincided with record gold prints. Lower real yields remain the single strongest tailwind.
2. U.S. Dollar Trend — 8.0/10 (Bullish)
DXY ~99 keeps FX headwind light for non-USD buyers; any further dollar slippage greases upside.
3. Central-Bank Buying / De-Dollarization — 8.5/10 (Bullish)
Official-sector demand re-accelerated in August after a softer July; 2025 remains a strong year led by EM banks. This sticky, price-insensitive bid keeps floors firm.
4. Trade/Tariff Shock (Latest U.S.–China Escalation) — 8.5/10 (Bullish)
Tariff brinkmanship has re-ignited, with scenarios floating sweeping new/raised U.S. tariffs on China up to triple-digits on some categories. Inflationary impulse + growth uncertainty = safe-haven and hedge demand for gold.
5. ETF & Institutional Flows — 7.5/10 (Bullish)
Record-style inflows in Sept. (largest monthly on WGC data this year) and five straight months in Europe underline broadening participation. Flows amplify macro moves.
6. Systematic/CTA & Options Positioning — 6.5/10 (Mixed → Volatility)
Trend-following and options gamma around big figures ($4,100 / $4,200) are magnifying intraday whipsaws. Inference from price behavior vs. round-number pivots and fresh highs.
7. China Growth/Property Stress — 6.0/10 (Bullish)
Macro fragility + trade tensions keep risk appetite cautious and investment demand for hedges elevated. Macro inference aligned with tariff news and sustained safe-haven bids.
8. U.S. Fiscal & Credit Risk — 6.0/10 (Bullish)
Deficits and periodic funding drama incl. shutdown headlines sustain a background bid for duration-agnostic hedges like gold.
9. Jewelry & Tech Demand — 4.5/10 (Slightly Bearish near records)
At all-time highs, price-sensitive jewelry demand lags (India still seasonally active, but at higher rupee prices); investment demand dominates.
10. Geopolitics (Ukraine/Mideast/Taiwan) — 5.5/10 (Event-Bullish)
Event spikes persist but remain secondary to the rate/FX driver set.
🗂️ Quick Table
Rank Catalyst Score/10 Impact Direction Notes
1 Fed path & real yields 9.0 Very High Bullish Cuts priced; new highs on rate-cut bets.
2 Central-bank buying 8.5 High Bullish Aug net adds; robust 2025.
3 U.S.–China tariff risk 8.5 High Bullish Escalation chatter/looming hikes.
4 U.S. dollar trend 8.0 High Bullish DXY ~99 keeps winds favorable.
5 ETF/institutional flows 7.5 High Bullish Sept set records; 5-mo EU streak.
6 Systematic/CTA flows 6.5 Mod Mixed Round-number gamma, whipsaws.
7 China growth stress 6.0 Mod Bullish Macro fragility + tariffs.
8 U.S. fiscal risk 6.0 Mod Bullish Funding theatrics support hedges.
9 Jewelry/tech demand 4.5 Low Slightly Bearish Price-sensitive demand lags at highs.
10 Geopolitics (broad) 5.5 Low-Mod Event-Bullish Episodic spikes; not primary.
________________________________________
🚀 Street Outlook — Bullish 2026 Calls ≥ $5,000
• Bank of America: lifts 2026 target to $5,000/oz (avg $4,400), citing sustained investment demand and macro hedging.
• Société Générale: referenced alongside BofA in calling potential $5,000 by 2026 amid rate-cut cycle & trade tensions.
Bottom line: High-conviction houses are explicitly flagging $5k scenarios into 2026 on the combo of easier policy, FX tailwinds, and structural buying.
________________________________________
🧨 Spotlight: Latest U.S.–China Tariff Escalation
Tariff rhetoric and policy paths have re-intensified into mid-October, with reports of much higher U.S. tariffs on Chinese imports incl. 100% in some proposals “looming”. The renewed brinkmanship is elevating inflation and growth uncertainty, a classic support for gold.
________________________________________
🧩 Key Supports & Resistances
Reference: Spot ~$4,123/oz; day’s high ~ $4,179, low ~ $4,091 (Oct 14, 2025).
🔼 Resistances
• $4,180–$4,200: Record high / round-number supply (fresh sellers + optionality).
• $4,250: Next psychological magnet; common options strike/target zone (technical inference).
• $4,300: Major psychological figure; likely heavier gamma/stop clusters (inference).
🔽 Supports
• $4,100: First intraday pivot (today’s congestion).
• $4,000: Major psych level / prior breakout; expect dip-buying and CTA reloads. (Inference supported by recent breakout behavior.)
• $3,900–$3,850: Pullback buffer from prior impulse leg (tech inference).
• $3,750 / $3,700: Deeper mean-reversion shelf if macro data surprises hawkish.
• $3,500: Cycle baseline—would imply a regime shift (low probability barring macro shock).
🧠 Trading implications: Expect chop around $4,100–$4,200 as options/CTA flows battle; decisive acceptance above $4,200 opens a momentum run toward $4,250 → $4,300. Failure to hold $4,100 puts $4,000 in play where physical + ETF dip-buyers likely re-engage.
________________________________________
🌐 Flow & Positioning Notes
• ETFs: September marked the largest monthly inflow of 2025, led by Europe (UK/CH/DE), extending a five-month streak—a textbook confirmation of bull-trend participation.
• Official sector: Net buyers in August; EM central banks remain the anchor bid.
• FX: DXY drift lower = mechanical tailwind; watch for USD squeezes around U.S. data prints.
________________________________________
🧭 Risk Map What Can Derail $5k?
• Hawkish upside surprises in U.S. inflation/growth pushing real yields higher (cuts repriced later/weaker).
• Swift tariff de-escalation dampening inflation hedging bid.
• Positioning washouts near round numbers if CTA trend signals flip (volatility risk).
________________________________________
✅ Bottom Line
Momentum, macro, and flows argue buy-the-dip into $4,000–$4,100 while the $5k-by-2026 narrative strengthens on the Street. Break and hold above $4,200 likely extends the up-leg toward $4,250–$4,300 near term; BofA’s $5,000 2026 call underscores the cycle’s runway.
GOLD → Ready for continued growth. Target 4100 - 4125FX:XAUUSD remains above $4,000, starting the week with a record high amid the escalating trade war between the US and China. Traders bought up all of last week's decline.
Key drivers: Trump's new tariffs: Introduction of 100% tariffs on all Chinese goods and export controls on software from November 1. China is not sitting idly by: Restrictions on exports of rare earth metals and technologies.
The ongoing shutdown and trade uncertainty are weakening the dollar.
US inflation data (CPI on October 24) will be the first key release after the shutdown.
Speeches by Fed officials may adjust rate expectations.
Gold remains in an uptrend, but momentum will depend on the progress of trade negotiations. A breakout to new highs is likely if tensions remain high.
Resistance levels: 4078, 4100, 4110
Support levels: 4059
A breakout of 4078 and a close above the key level could trigger a continuation of the growth to 4100. An additional scenario could be a correction to 4059 before further growth to 4100-4125.
Best regards, R. Linda!
