Gold continued its upward trend. Watch for key resistance levelsThe current 4-hour chart for gold shows that short-term moving averages are continuously overlapping and the trend is flat, indicating that the market's bullish and bearish forces are in a state of temporary equilibrium.
Price fluctuations are mainly confined to a large range of 4000-4130. Looking at the 1-hour chart, the previous Fibonacci retracement levels remain valid, with the key resistance level still at the psychological level of 4100. Therefore, a shorting strategy can be considered at this level.
If the price breaks through 4100, pay close attention to the 4130 level. This level is both a key resistance point from the previous period and a key resistance level of the daily trend line. Therefore, you can look for this level to enter a short position after the first resistance is broken.
Looking at the MACD indicator, no clear trend has emerged, which means that the direction of gold's price movement is still uncertain. We should pay attention to the divergence in the market going forward.
In terms of trading, it is recommended to focus on the adjustment and correction process of short-term technical indicators. Selling on rallies within the range is advisable. The first resistance level to watch is around 4100. If a significant breakout fails to occur, the price will likely return to range-bound trading.
Trading Strategy: Short positions can be initiated in batches around 4100-4110, with a stop-loss at 4120 and a profit target of 4070-4060.
If the price breaks through 4110 decisively, consider shorting again around 4135.
Goldprediction

GOLD RE-UPDATEDPrevious idea base, still waiting for price to clear the first leg of this drop.
we might see this zone 3800$ test!
This is only my view, cancel the idea once price break 4200$ again. wait for 3820-3860 zone for entries. if that zone break closed the trade.
This is only my view until the month of december, for now the price are ranging. I cannot see a clear sign to rise at this level.
follow for more.
Longterm trades base on your own accounts.
I personally take trades on my investors with sharing the ideas personally.
comment '"personal" for daily updates.
sometimes I don't post ideas because of my trades are longterm.
Goodluck. keep trading.

How to choose a direction at the end of a triangular formation#XAUUSD TVC:GOLD OANDA:XAUUSD
Although gold is still in a volatile market in the short term, its current trend has entered the end of a converging triangle pattern, and the market is getting closer to choosing a direction.
The market has recently been driven primarily by news, and the current geopolitical tensions, coupled with the stalled Russia-Ukraine peace talks, may trigger a new wave of risk aversion. Therefore, during the European session, we can consider going long on gold when it retraces to the 4040-4030 range.

XAU/USD) Bullish trend analysis Read The captionSMC Trading point update
Technical analysis of breakdown of your analysis idea based on the chart you provided (XAUUSD – 4H):
---
Chart Overview
Symbol: Gold Spot (XAUUSD)
Timeframe: 4H
Indicators used: EMA 50 (blue), EMA 200 (black)
Current price: ~4095.58
Key support zone: 4060 – 4075 region
Target: 4125 – 4130
---
Idea Explanation
1. Market Structure
Price has recently broken upward strongly from the EMA50 zone.
Expectation: A retracement back into the Demand Zone (blue region).
Fibonacci levels shown: 0.5 / 0.618 / 0.705 / 0.786
Expected retracement point appears around 4070–4065.
2. Trade Plan
Bullish Scenario
Wait for price to retrace into the Demand Zone
Look for confirmations (rejection candle, BOS, liquidity sweep)
Enter long position between 4075 – 4065
SL likely beneath 4050–4045
TP area 4125 – 4130
3. Liquidity Concept
Chart shows a liquidity grab (sweep) below previous lows inside the demand zone
After sweep → expectation of impulsive move upward
---
Target & Risk Management
Entry Stop Loss Take Profit R:R
4075–4065 4045 4125–4130 approx 1:3 – 1:4
---
Summary
Bias: Bullish continuation
Strategy: Retracement to demand + Fibonacci confluence + EMA support
Target aligned with next significant high & liquidity area
Mr SMC Trading point
---
My Personal Insight
This setup is clean and valid. The key will be waiting for price to confirm rejection in the zone. If news volatility pushes price deeper, 4060–4050 is strong institutional level.
---
please support boost 🚀 this analysis

GOLD 4H CHART ROUTE MAP UPDATE & TRADING PLAN FOR THE WEEKHey Everyone,
Please see our updated 4h chart levels and targets for the coming week.
We are seeing price play between two weighted levels with a gap above at 4124 and a gap below at 4042. We will need to see ema5 cross and lock on either weighted level to determine the next range.
We will see levels tested side by side until one of the weighted levels break and lock to confirm direction for the next range.
We will keep the above in mind when taking buys from dips. Our updated levels and weighted levels will allow us to track the movement down and then catch bounces up.
We will continue to buy dips using our support levels taking 20 to 40 pips. As stated before each of our level structures give 20 to 40 pip bounces, which is enough for a nice entry and exit. If you back test the levels we shared every week for the past 24 months, you can see how effectively they were used to trade with or against short/mid term swings and trends.
The swing range give bigger bounces then our weighted levels that's the difference between weighted levels and swing ranges.
BULLISH TARGET
4124
EMA5 CROSS AND LOCK ABOVE 4124 WILL OPEN THE FOLLOWING BULLISH TARGETS
4212
EMA5 CROSS AND LOCK ABOVE 4212 WILL OPEN THE FOLLOWING BULLISH TARGET
4328
EMA5 CROSS AND LOCK ABOVE 4328 WILL OPEN THE FOLLOWING BULLISH TARGET
4422
EMA5 CROSS AND LOCK ABOVE 4422 WILL OPEN THE FOLLOWING BULLISH TARGET
4494
BEARISH TARGETS
4042
EMA5 CROSS AND LOCK BELOW 4042WILL OPEN THE FOLLOWING BEARISH TARGET
3964
EMA5 CROSS AND LOCK BELOW 3964 WILL OPEN THE FOLLOWING BEARISH TARGET
3873
EMA5 CROSS AND LOCK BELOW 3873 WILL OPEN THE SWING RANGE
3767
3646
As always, we will keep you all updated with regular updates throughout the week and how we manage the active ideas and setups. Thank you all for your likes, comments and follows, we really appreciate it!
Mr Gold
GoldViewFX

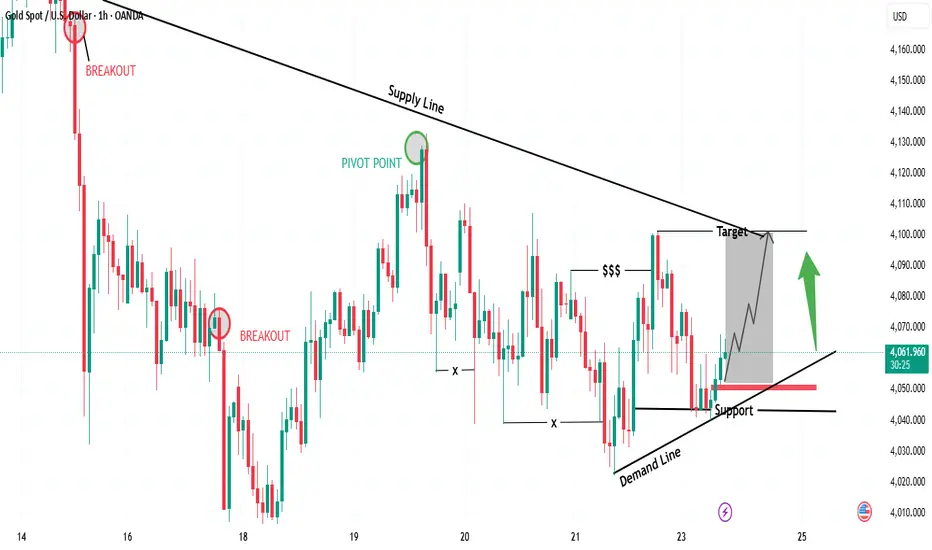
“Gold Rebounding from Demand – Targeting Supply Line Retest🔍 Key Observations
📉 Supply Line (Downtrend Resistance)
Each rally is being capped by the descending supply line
📈 Demand Line (Ascending Support)
Buyers defending higher lows
Strong bullish reaction off support
💰 Liquidity Grab ($$$)
Liquidity was taken below swing lows — bullish signal
Smart money likely securing positions before pushing up
🟢 Bullish Confirmation
If price holds above demand line + support zone
Expect bullish continuation toward supply line retest
🎯 Suitable Target Levels
Target Level (Approx) Status
🥇 First Target 4,095 – 4,105 At supply line retest
🥈 Extended Target 4,120 – 4,130 Breakout continuation
📌 Trade Idea (Bullish Scenario)
Entry Zone: 4,055 – 4,065 🟩
Stop Loss: Below 4,025 ❌
Take Profit 1: 4,100 🎯
Take Profit 2: 4,125 🚀
RR Ratio: 1:2.5 – 1:3 📈
🧭 Market Sentiment
📍 Bias → Short-term Bullish
🛑 But… sellers may reappear at supply line
⚠️ Watch for fakeouts near the target
Data week. Focus on trend continuation.This week's intensive data release could be a catalyst for market volatility:
Due to data delays caused by the government shutdown, a large amount of economic data will be released this week. Tuesday: September PPI, September retail sales, October pending home sales. Wednesday: Durable goods orders, Q3 GDP preliminary estimate, PCE price index, new home sales, initial jobless claims. The market will be closed on Thursday for Thanksgiving, and there will be no major data releases on Friday.
Market Analysis:
Gold initially fell before rising on Friday, briefly dipping to the 4022 level before a bullish reversal, and has been hovering around the previous resistance level of 4100 for an extended period. Currently, there is no clear direction.
The daily chart shows that since encountering short-term resistance at 4110, each attempt to bottom out has been followed by a rebound. Therefore, this is a strong rebound, not a reversal. However, without significant positive news, further upward movement at the previous resistance level of 4110 will be difficult.
In the short term, the key level to watch is the breakout of the triangle pattern. Support is at $4020, and resistance is at $4110. A breakout from this range will likely lead to further continuation of the trend.
After rebounding last Friday, it failed to hold $4,100. The highs have been moving lower and the lows have been moving higher, and the trading range has begun to narrow. This is a good thing, meaning that a one-sided trend is coming soon.
Short-term trading strategy:
Buy in batches between 4020 and 4030, with a stop loss at 4010. The profit target is the resistance level at 4100.
Short sell with a small position when the price first touches around 4110, aiming for a profit of 40-50 points.
XAUUSD – Reading the Market’s Secret Intentions🌐 MARKET CONTEXT
Gold begins the new week with compressed volatility yet maintains a bearish overall structure on H1. Price continues forming Lower Highs → Lower Lows, suggesting Smart Money is still distributing at premium zones while accumulating at deep discount pools.
Current Market Drivers
USD strength remains stable → keeping gold under pressure
Market awaits midweek USD data → early sessions may be liquidity-driven
Institutional flows show no strong bullish commitment yet
Bias for the day:
🔻 Bearish until price reclaims key premium zones with a valid CHoCH.
🔺 BUY setups valid only at deep discount liquidity pools (3996, 4030).
📉 TECHNICAL ANALYSIS (Liquidity + SMC Structure)
Market Structure
H1 Trend: Bearish
Key premium zone above: 4146–4148
Mid-range equilibrium: 4060–4080
Discount demand clusters: 4030 & 3994
Liquidity Observation
Buy-Side Liquidity (BSL):
Above 4146
Above 4071 liquidity wick
Sell-Side Liquidity (SSL):
Below 4030
Below 3994 (major liquidity pocket)
Imbalances / FVG
Strong bearish FVG at 4146–4148
Minor imbalance at 4068–4071
Clear discount imbalance at 4032–4030
Deep liquidity vacuum near 3996–3994
🔑 KEY PRICE ZONES (Clear, Compelling Explanations)
1️⃣ 4148–4146 → Premium Liquidity Trap – Main SELL Zone
This zone contains:
Unmitigated H1 Supply Zone
Heavy BSL resting above recent swing highs
Major bearish FVG fill
➡️ A classic liquidity-engineered premium trap where Smart Money sweeps breakout buyers before reversing aggressively.
2️⃣ 4068–4071 → Mid-Range Liquidity Sweep – SCALP SELL Zone
Features:
Clusters of intraday stops from earlier longs
A small FVG acting as inducement
Positioned near equilibrium → perfect for fakeouts
➡️ Expect quick wicks and sharp rejections, ideal for short, high-precision scalps.
3️⃣ 4032–4030 → Discount Reaction – SCALP BUY Zone
This area offers:
Clean SSL located just beneath
Micro Demand Zone
A common reversal point during bearish cycles
➡️ Excellent for fast BUY scalps with tight risk, especially during London manipulation.
4️⃣ 3996–3994 → Deep Discount Reversal – GOLD BUY Zone
A high-value accumulation zone:
Contains significant higher-timeframe SSL
Aligns with deep-discount structure
Frequently used by Smart Money to reload long positions
➡️ If price taps this zone, a strong bullish rebound is very likely.
⚙️ TRADE SETUPS (High Precision Entries)
✔️ SELL GOLD – Main Premium Short
Entry: 4148–4146
Stoploss: 4154
TP1: 4120
TP2: 4080
TP3: 4030
Logic: BSL sweep → FVG mitigation → bearish displacement.
✔️ SELL SCALP – Mid-Range Sweep
Entry: 4068–4071
Stoploss: 4077
TP1: 4050
TP2: 4038
Logic: Engineered liquidity → immediate rejection expected.
✔️ BUY SCALP – Discount Liquidity Reaction
Entry: 4032–4030
Stoploss: 4024
TP1: 4045
TP2: 4068
Logic: SSL sweep → CHoCH likelihood → intraday rebound.
✔️ BUY GOLD – Deep Discount Long
Entry: 3996–3994
Stoploss: 3988
TP1: 4020
TP2: 4060
TP3: 4140
Logic: Strong institutional accumulation zone → potential formation of H1 higher low.
🧠 SESSION NOTES
Avoid trading mid-range to reduce chop exposure.
Best moves form after liquidity sweeps in London or during NY displacement.
Confirm entries with M5/M15 CHoCH + displacement.
Never buy inside premium zones; never sell inside deep discount zones.
🏁 CONCLUSION
Gold maintains a bearish structure, favoring SELL setups at premium liquidity traps 4146–4148 and 4068–4071.
BUY setups remain valid only at strong discount zones 4030 and 3994, where liquidity supports a clean bullish reaction.
Let liquidity form the trap. Then strike with precision.

Gold Setup Is TOO CLEAN to Ignore — Bulls in Control!In my view, Gold currently presents one of the cleanest technical structures across the entire market. Ideally, I would like to see a downside manipulation first, followed by a continuation move toward the 4110 area to sweep internal buy-side liquidity. Only after that, a potential retracement toward the 3900 zone becomes reasonable. Any bearish movement that occurs without first taking buy-side liquidity does not align with my plan, and in that case, I will not consider opening any short positions.
Like and follow if you wanna see more analysis like this!
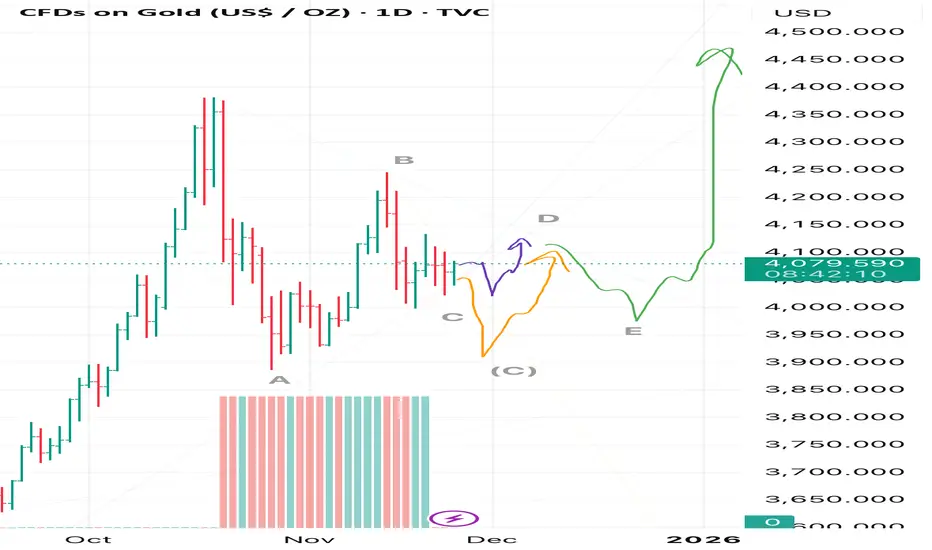
Gold — ABCDE Triangle Formation With Bullish Breakout AheadIn my view, gold is forming a corrective ABCDE triangle with an expected breakout to the upside🚀
At the moment, wave C is either still developing or it is almost completed, and wave D may soon begin. I marked these two scenarios with orange🟠and purple🟣 arrows respectively.
However, I also do not rule out the possibility that this structure may turn out to be a flat ABC correction rather than a triangle, as I currently expect.
In that case, price should first move according to the orange scenario.
After the correction completes, I expect price to follow the green path, taking gold above its recent all-time high🌱
And between us — I personally expect gold to eventually reach above 8000 😱
But for now, let’s patiently wait for this current structure to finish forming.
💬Share your thoughts in the comments:
Do you think wave C is already complete, or will gold dip lower according to the orange path?
I’m curious to hear your view.
XAUUSD - Time to buy gold!XAUUSD (GOLD) was recently in a short term downtrend for a few weeks but has now shown some clear bullish movements ahead. XAUUSD (Gold) has broken out of a downward trend channel that was acting as strong resistance, The price is very likely to head to the next strong resistance level which is marked as the take profit zone (green line). Time to buy!

Still Good Long R:R's (Gold)Setup
Bullish trend / Correction
Gold still above 50 day moving average
Daily RSI stable around 50 level
Has made a 50% correction of rally since breakout at 3400
Commentary
It seems likely gold needs to first complete an ABCD correction before moving higher - meaning one more lower low. However, support at 3920 could hold, offering good R:R opportunities - even if 4200 holds as resistance.
Strategy
Look for bullish reversals below 4000, above 3920 support
Wait for bigger pullback to the 61.8% Fib / demand zone under 3800

$Gold Technical Analysis October 2025 📊 #GOLDUSD Update
🔑 Key Zones
PRZ: $4,371 (Gold stopped nicely at $4,381!)
Local Support Zone: $4,180–$4,050
Holding this range can send Gold soaring again toward:
➡️ $4,500 → $4,750 → $5,200
If these supports are lost, → next downside zones are:
➡️ $3,950 → $3,850 → $3,750
📅 Timeframe & View
Short-term:
Gold trading between $4,180–$4,050 — key range before the next big leg.
Long-term:
ATH projection levels:
💎 $5,300 → $5,700 → $7,300 → $7,700
These correspond with critical years for the global cycle:
2025 (Oct–Nov) performance
2027
2031
2033
Every pullback in this decade-long uptrend remains a buy opportunity.
⚖️ Gold or BTC?
For the short term, my focus shifts to BTC.
But once that phase completes, I’ll move back to Gold for the long wave.
💰 Long-Term Holders
For those holding gold long-term (1 year+):
Any pullback below $3750 remains a strong buy zone for adding.
✅ Quick Recap
📍 PRZ hit: $4,371–$4,381
🛡 Support: $4,180–$4,050
🚀 Upside Targets: $4,500–$4,750–$5,200
⚠️ Downside Risk: $3,950–$3,850–$3,750
🧭 Cycle Years: 2025, 2027, 2031, 2033
💰 Focus: Short-term BTC → Long-term Gold
🧭 Personal Trading Note
I only trade Gold in the real market, and use the demo setup here purely for tracking and study.
⚓ Renzo Tip
“When the tide turns, the wise trader doesn’t fight it — he rides one wave, then waits for the next.”
🤲 Prayer
May Allah bless us with patience in the long waves, wisdom in every entry,
and reward us with clarity in both gold and time.

XAUUSD | Gold Swing Short SetupGold closed strong Bearish in Weekly now retesting the Bearish Ob, Until unless it doesn't take liquidation below, chances are higher it will dump again. Use proper risk management, if it forms the daily fvg, then take first entry from the 50% of daily fvg, 2nd from the entry mentioned, and hold till tp or SL.

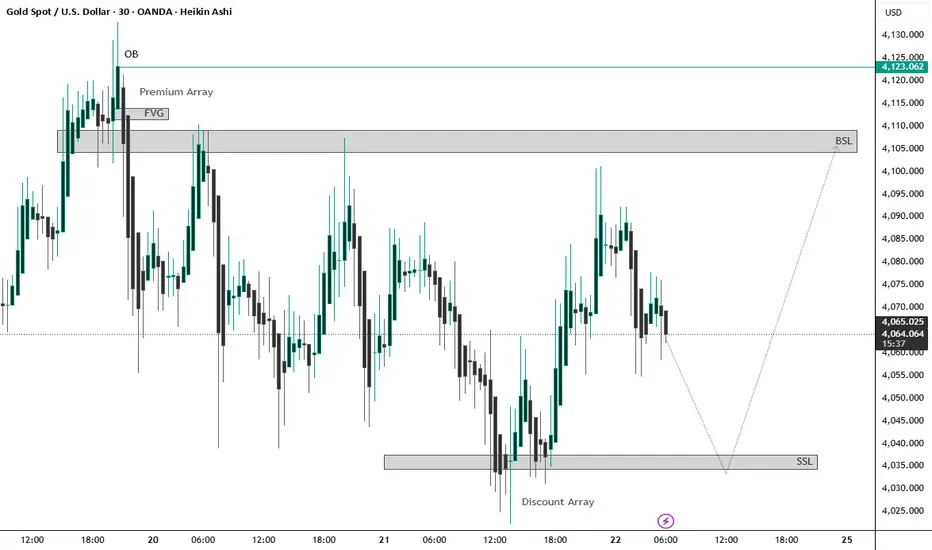
the mid-range, between a Premium Array above and a Discount ArayAt the top, there’s an Order Block (OB) and a marked Buy-Side Liquidity (BSL) level around the 4,105–4,125 region, indicating a potential bullish target if price moves upward.
A Fair Value Gap (FVG) is highlighted within the premium range, suggesting an imbalance that price may return to fill during a retracement.
In the lower region, the chart marks a Discount Array and a Sell-Side Liquidity (SSL) pool near the 4,035–4,045 area, hinting at a possible liquidity sweep before a reversal.
The projected path on the chart suggests a bearish move first, targeting the discount area and SSL, followed by a bullish reversal aiming back toward the premium zone and BSL.
Overall, the chart outlines a clear liquidity-based scenario: liquidity grab below → bullish expansion toward
XAU/USD Weekly Outlook | Gold Stuck in Consolidation RangeGold ended the week stuck inside a broad consolidation range, trading between 4052 support and 4098 resistance, showing indecision as neither buyers nor sellers have been able to take control.
Both the MA50 and MA200 are flat, reflecting a lack of strong directional momentum — the market is in balance, waiting for a catalyst.
Buyers need a confirmed break and sustained hold above 4098, followed by a break of 4142, to shift momentum. Until then, any upside attempts remain corrective within the range.
Failure to reclaim 4098 increases downside pressure. A drop below 4052 would expose the
4016–3968 Support Zone. If selling momentum extends further, gold could slide into the HTF Support Zone at 3921–3862, which is a major higher-timeframe demand area.
📌 Key levels to watch:
Resistance:
4098
4142
4198
4232
Support:
4052
4016
3968
3921
3862
🔎 Fundamental focus:
This week brings key U.S. data releases such as Core PPI, Retail Sales, Consumer Confidence, and Durable Goods Orders. With gold stuck in a range, any surprise in inflation or consumer strength could spark volatility.

XAU/USD) Bullish trend analysis Read The captionSMC Trading point update
Technical analysis of (XAUUSD) – Bullish Reversal Setup from Demand Zone
1. Key Zone: Strong Demand / Rejection Area
Price has reacted multiple times inside the blue demand zone (around 4040–4035).
This zone aligns with Fibonacci levels (0.705–0.79), strengthening the bullish probability.
Each touch shows buyers stepping in (long wicks + strong rejections).
2. Falling Wedge Breakout
A falling wedge pattern has been broken to the upside.
Price retested the wedge but dropped again to retest deeper inside the demand zone.
A bullish continuation is expected after one more dip into the zone (green arrow).
3. EMAs: Bullish Confluence
EMA 50 and EMA 200 are close, tightening and suggesting a potential trend shift.
Price is expected to bounce off the demand zone and climb above EMAs.
4. Projected Move
After tapping the demand zone, price is expected to:
Break above recent structure highs
Build bullish momentum toward the target point: 4,143.06
SMC Trading point
5. Overall Idea
This setup indicates a bullish continuation forming after a correction.
The blue zone is the high-probability buy zone, and the projected path suggests a move toward 4143 after confirmation.
---
please support boost 🚀 this analysis

Watch for support and entry point for long positions: 4020.Negative news has been priced in; be wary of consumer data.
In the short term, from now until the next three months, gold is an overcrowded trade. Any information next week will be a risk for gold; only renewed hopes for an interest rate cut can boost prices. The meeting is scheduled for December 9-10, during which one or two additional data points may be released. Nevertheless, if expectations for a rate cut do not increase, gold prices are likely to remain stagnant.
The market expects investment demand to remain stagnant until the Fed clearly outlines its path. We need to be cautious whether a longer pause could catalyze a larger outflow of funds from the precious metals market.
After two rounds of pullbacks and sharp rises on Friday, gold prices consolidated slightly around 4065 at the close. Currently, there's no clear distinction between upward and downward momentum, and the market is likely to remain range-bound. A clear direction is unlikely in the first half of next week, and we'll have to wait for data releases before making new trades. One key level to watch next week is the area around 4030, which is the potential entry point for our entry strategy on the second day of next week.
On the hourly chart, gold is currently holding above 4020. If a pullback doesn't break this level next week, we can wait for a pullback to enter long positions. Similarly, if there's an initial rise, we'll still look at the resistance at 4100. Without a clear trend, we can focus on range trading for now. Market conditions are volatile, so please follow our real-time trading strategies.
Short-term trading strategy:
Buy around 4025-4030, stop loss below 4020, take profit at the 4080-4100 resistance level.

XAUUSD – Consolidation Before Possible Upside ExtensionGold has been fluctuating within a broad corrective phase, and recent swings suggest buyers may attempt to regain control if the current stabilisation continues. A continuation to the upside becomes a viable scenario should momentum support a renewed push in the coming sessions.
Disclosure: We are part of Trade Nation's Influencer program and receive a monthly fee for using their TradingView charts in our analysis.

How will gold break out of its current predicament next week?
news:
On Friday, Williams, president of the New York Fed and one of the Fed's "Big Three," made a decisive statement, both setting the tone and saving the market from crisis. As a key figure sharing power with Powell and Jefferson, he bluntly stated that interest rates are "very likely to be adjusted further in the near future."
Of course, the hawks didn't back down either. Boston Fed President Collins was worried about inflation, while Dallas Fed President Logan was even tougher, questioning whether they should have voted on the previous two rate cuts, although Logan doesn't have voting rights this year.
technology:
Regarding the Golden Week holiday, the gold market experienced range-bound trading over the past week. The highest price reached was $4132, and the lowest was $4022, with an overall fluctuation range of approximately $110. However, for most of the week, gold prices fluctuated repeatedly within the $4040-$4110 range, with the fluctuation range narrowing to around $70.
Currently, after touching $4240, gold prices are temporarily in a second downward correction phase, and judging from the timeframe, this correction is not yet fully over. However, gold prices have twice found support and rebounded near the $4000 level, indicating that bulls have the potential for a short-term counterattack at this level.
Looking at the 1-hour chart, the short-term resistance level to watch is around 4110, while the support level is around 4020. Technically, the trend is more inclined towards a correction followed by an upward move. I will provide specific trading strategies in the channel, so please pay close attention.
Strategy Signals:
buy:4040-4035,SL:4025,TP:4080,4100

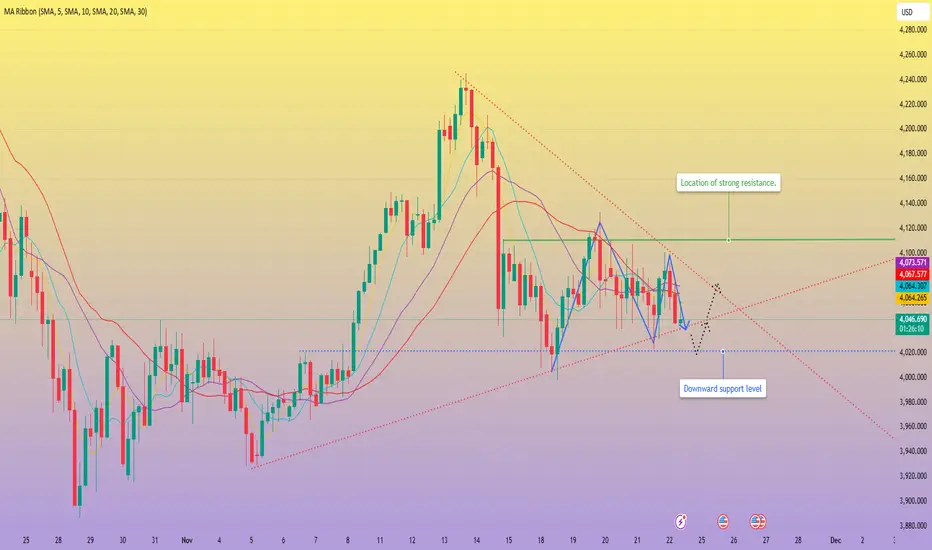
Gold trend in the last week of November⚔️1. Trendline
Descending Trendline (upper red line)
Acts as the main dynamic resistance.
Every retest results in rejection → the overall trend remains bearish.
The 4.150 – 4.160 zone is likely where price may retest the trendline before reversing lower.
Ascending Trendline (lower red line)
Previously the nearest dynamic support but has now been broken.
The downside breakout signals weakening momentum, favoring SELL setups.
⚔️2. Resistance Zones
Resistance 1: 4.148 – 4.150 (Fibo 0.5 – 0.618)
Confluence of Fibonacci retracement and the descending trendline.
High probability that price will retest this area and reject strongly.
Resistance 2: 4.245 – 4.250
The strongest resistance zone (Fibo 1.0).
Only reachable if a strong bullish pullback occurs.
⚔️3. Support Zones
Support 1: 3.995 – 4.000 & 4.028 – 4.030
Confluence of static support + psychological level.
A technical bounce may appear here.
Support 2: 3.890 – 3.900
The strongest support zone.
Main downside target if the price gets rejected from the upper resistance.
⚔️4. Price Scenarios
⭐️Primary Scenario (Bearish)
Price pulls back to 4.148 – 4.152, retests the descending trendline → rejection → moves down toward:
TP1: 3.995
TP2: 3.890
⭐️Alternative Scenario (Bullish)
Valid only if:
Price breaks above the descending trendline
Closes above 4.160
→ Next target: 4.250
TRADING RECOMMENDATIONS
BUY GOLD: 3890 – 3888
SL: 3878
TP: 100 – 300 – 500 pips
SELL GOLD: 4250 – 4248
SL: 4260
TP: 100 – 300 – 500 pips

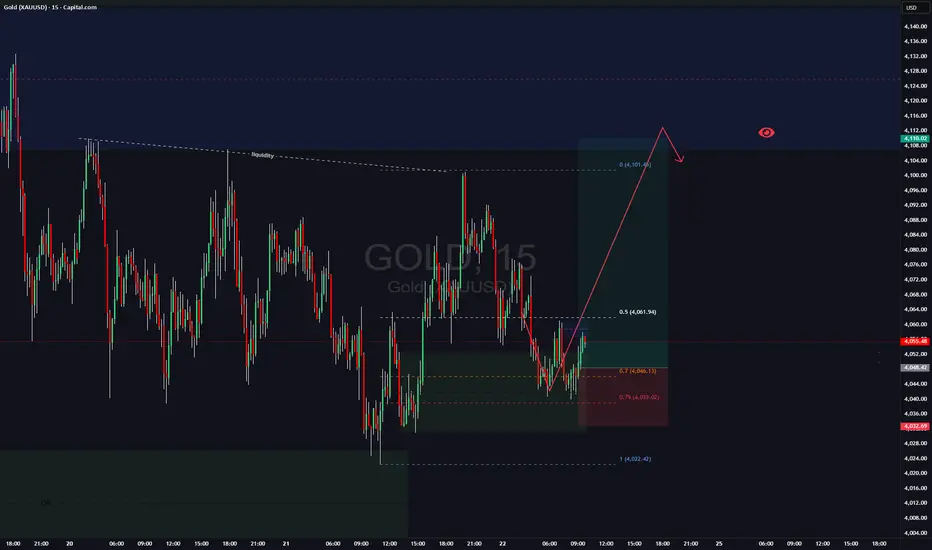
XAUUSD sell and buy level to look forXAUUSD was in range past week create a weekly inside bar after stong rejection week before.
As price closed with potentail further range bound possibility, there are couple of levels we can look on lowertimeframe for selling and buying opportunity througouth the week.
With Fed's possible rate cut in dcemember, which is the one of the most influencial driving force for GOLD to bounce, price may eventually could take off ffrom the weekly support fueled by end of year close which all could fuel GOLD to drive up this week after past week's slowdown
Therefore level's to look at based on 15mintues timeframe
As price broken out of dynamic resistance, it is now slowly moving teards the base line.
breaking above 4076.50 is high supply zone for sellers to look at
coming below 4000.00 is an extreme liquidity zone, to look for long on a rejection above 4000.00
with strong rejection can possibly break above 4100.00

GOLD UPDATE Gold has been behaving well and it would be best to always close partial profits where necessary to help secure the profits , it has huge potential to the upside to the recent highs
