Alphabet - The only surviving stock!🏅Alphabet ( NASDAQ:GOOG ) is clearly not bearish yet:
🔎Analysis summary:
The entire tech sector is currently collapsing. But Alphabet remains totally strong and is sitting close to new all time highs. But considering that current retest of the major resistance trendline, a short term pullback in the near future is more and more likely.
📝Levels to watch:
$350
SwingTraderPhil
SwingTrading.Simplified. | Investing.Simplified. | #LONGTERMVISION
Google (Alphabet)

Google Parent Alphabet Shares Are Down PremarketAlphabet’s shares (NASDAQ: NASDAQ:GOOG ) were down in premarket trading on Thursday after the company beat Wall Street’s expectations on earnings and revenue, with AI spending projected to increase hugely this year.
The Google parent shed 2.9% in premarket, after closing nearly 2.16% lower on Wednesday. After the bell, Alphabet reported $113.83 billion in revenue in the fourth quarter, above the estimated $111.43 billion from analysts polled by LSEG.
Its Google Cloud division earned $17.66 billion in revenue versus a forecast of $16.18 billion, according to Street Account. YouTube Advertising earned $11.38 billion in revenue versus the estimated $11.84 billion.
The tech giant said it would significantly increase its 2026 capital expenditure to between $175 billion and $185 billion — more than double its 2025 spend. A significant portion of capex spending would go towards investing in AI compute capacity for Google DeepMind.
What analysts are saying
Barclays analysts said in a note on Thursday that Infrastructure, DeepMind, and Waymo costs “weighed on overall Alphabet profitability,” and will continue to do so in 2026.
“Cloud’s growth is astonishing, measured by any metric: revenue, backlog, API tokens inferenced, enterprise adoption of Gemini. These metrics combined with DeepMind’s progress on the model side, starts to justify the 100% increase in capex in ’26,” they said.
Analyst Summary
According to 43 analysts, the average rating for GOOGL stock is "Strong Buy." The 12-month stock price target is $333.33, which is an increase of 0.09% from the latest price.

Google’s AI Pivot: The World’s Next Pharma GiantAlphabet recently shattered Wall Street expectations with its Q4 2025 earnings report. Management is aggressively increasing capital expenditure for 2026. This spending fuels a massive expansion of AI infrastructure. Investors now see a clear shift in Google's corporate strategy.
The Great Technological Pivot
Google is no longer just a search engine company. It is transforming into a dominant scientific powerhouse. DeepMind remains the crown jewel of this technological ecosystem. Their newest AI models now learn faster than any previous systems.
From AlphaFold to AlphaGenome
AlphaFold already solved the protein-folding mystery for global science. Now, AlphaGenome decodes the "dark matter" of the human genome. It processes a million DNA letters at once. This tool predicts gene regulation with unprecedented precision.
The Most Important Pharma Company
This technology transforms Google into a pharmaceutical powerhouse. Traditional drug discovery is notoriously slow and expensive. Google’s AI accelerates this process by several decades. They now own the digital blueprint of human biology.
Patent Analysis and High-Tech Moats
Google’s patent portfolio reveals a deep focus on biotechnology. They dominate the foundational algorithms for life sciences. This intellectual property creates an unassailable competitive advantage. No traditional pharmaceutical company can match this computational scale.
Geostrategy and Leadership
CEO Sundar Pichai is leading an "AI-first" biological revolution. This geostrategy secures Google's role in global health security. Management is prioritizing long-term scientific dominance over advertising growth. They are building a more resilient, high-tech business model.
Macroeconomics and Cybersecurity
Macroeconomic pressures do not hinder their scientific progress. Google secures sensitive genetic data with advanced cybersecurity. This trust remains vital for the future of medicine. Alphabet is becoming the ultimate architect of human longevity.

GOOG Alphabet Options Ahead of EarningsIf you haven`t bought GOOG before the recent rally:
Now analyzing the options chain and the chart patterns of GOOG Alphabet prior to the earnings report this week,
I would consider purchasing the 355usd strike price Calls with
an expiration date of 2026-4-17,
for a premium of approximately $17.80.
If these options prove to be profitable prior to the earnings release, I would sell at least half of them.

GOOGL Short-term analysis | Trading and expectationsNASDAQ:GOOGL
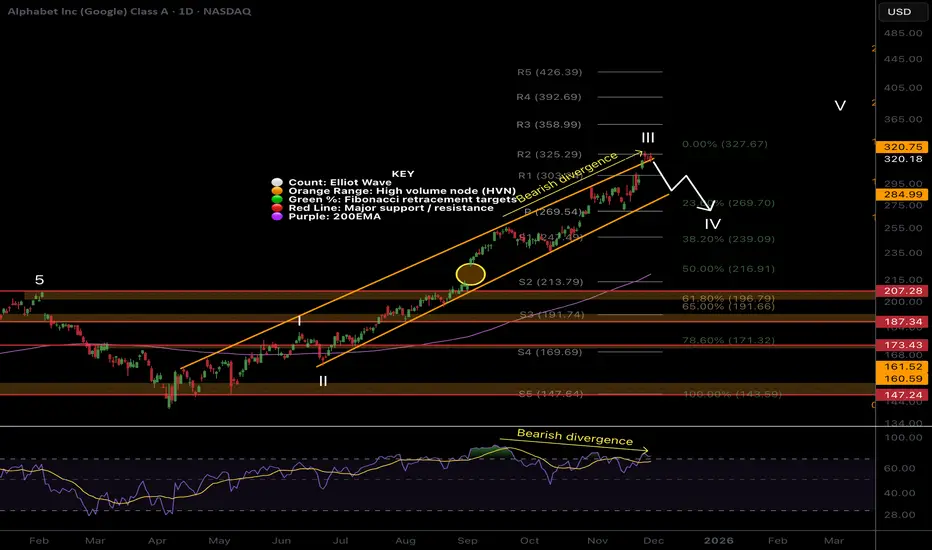
🎯 Wave III continued, price looks exhausted but just won’t stop rewarding investors. It may trap late trend-chasing investors, causing them to capitulate lower. Wave (B) of a corrective wave appears complete. Wave (C) has an initial target of the High Volume Node at $277, the 0.236 Fibonacci retracement. This is a likely area for a wave 4 correction to end in a bullish uptrend.
📈 Daily RSI has printed a bearish divergence from overbought for weeks
👉 Analysis is invalidated if price moves above wave III into all-time high
Volatility analysis | Expected range & extremities
🎯Google has been overheated for some time above the SD+3 threshold, where it is expected to spend <1% of the time. A large drop would not be surprising, but this sustained rally is reflecting the AI growth and could be setting google on a new, bullish path. Price is well above fv, not something I would be buying at this time
👉Fair value is ~$260
Safe trading

GOOGL Alphabet Options Ahead of EarningsIf you haven`t bought GOOGL before the rally:
Now analyzing the options chain and the chart patterns of GOOGL Alphabet prior to the earnings report this week,
I would consider purchasing the 305usd strike price Calls with
an expiration date of 2026-1-16,
for a premium of approximately $8.30.
If these options prove to be profitable prior to the earnings release, I would sell at least half of them.

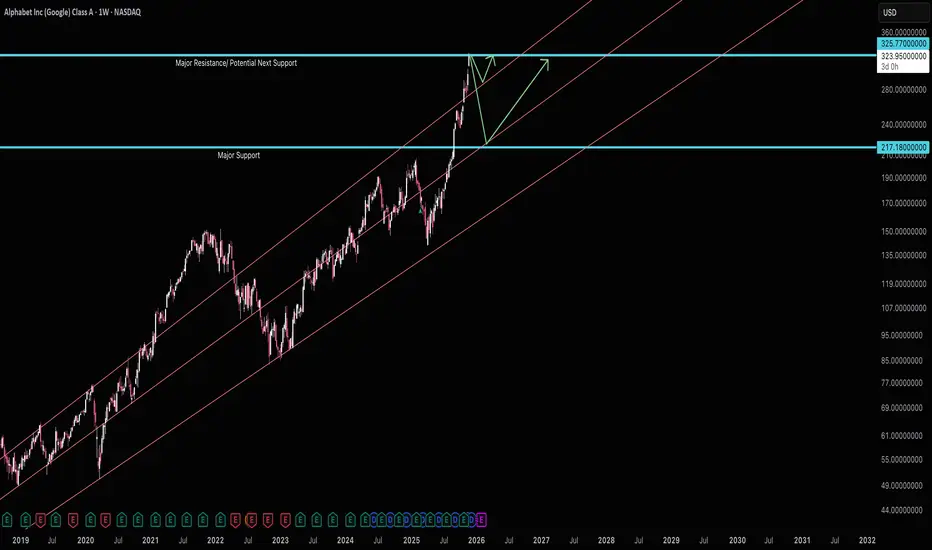
Is $GOOG breaking out to new highs?NASDAQ:GOOG is one of the best looking charts right now.
This week, price action pushed to new highs and retested resistance as support. If price keeps pushing higher, then I can see a potential move all the way up to the top target.
The move would need to happen quickly if it were to play out. Similar to the move in SNDK, AMD, ORCL, etc. A one day move of 20-40%.
I've bought some calls just incase this plays out as there is a ton of bullish flow.
Let's see what happens over the coming weeks.

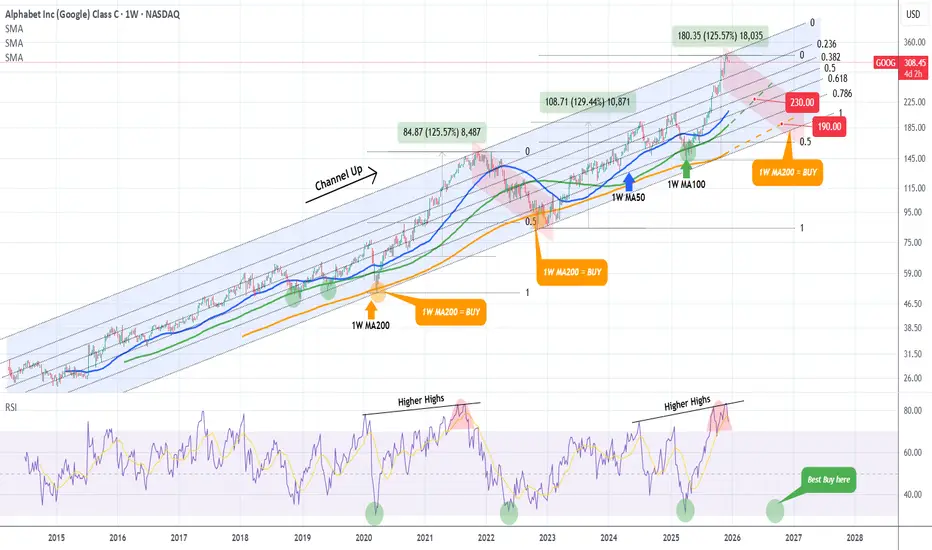
GOOGLE Is this the market Top??Google (GOOG) is now looking almost exactly like the November 2021 Top of the previous Bull Cycle. That was the one that made the first Higher High on its historic 12-year Channel Up.
The distinct signal is a double Higher Highs hit (November 24 2025 and today) similar to Aug - Nov 2021. This is a legitimate technical reason to expect that the 2023 - 2025 Bull Cycle has topped. The 1W RSI has even printed the same kind of peak formation it did in August 2021, completing an impressive rally from its oversold bottom at 32.00 (green circle), similar to the oversold bottom of the COVID flash-crash in March 2020.
So if this the start of a new Bear Cycle in 2026, same as the one in 2022, how low can the stock go before it bottoms and becomes a buy opportunity again?
We will answer that by going back to the multi-year Channel Up, where you can see that the 1W MA200 (orange trend-line) has acted as the ultimate Support, thus best buy entry, during the last three major market corrections: the March 2020 COVID crash, the October 2022 Inflation Crisis bottom and the April 2025 (almost) Tariff War. Before that, it was the 1W MA100 (green trend-line) that gave two excellent buy opportunities back-to-back.
As a result, even though the 2022 Bearish Leg correction bottomed on the 0.5 Fibonacci retracement level, this time we will 'limit' the new Bear Cycle to those MA trend-lines, the MA100 and MA200. If the price is contained on the MA100, its current trajectory shows a potential 'fair' contact around $235. If the market fails to rebound there, we expect a Q4 2026 bottom on the 1W MA200 around $195.
Regardless of that, we will also be looking at the 1W RSI. As we already mentioned, since the 2020 COVID crash, and those 3 in total major corrections that the Alphabet stock had, when the RSI hit the 32.00 level, it presented an objective buy opportunity, even though in 2022 it dipped even lower. As a result, if the 1W RSI hits 32.00 again before reaching any of the above Targets, we will be placing a buy regardless.
---
** Please LIKE 👍, FOLLOW ✅, SHARE 🙌 and COMMENT ✍ if you enjoy this idea! Also share your ideas and charts in the comments section below! This is best way to keep it relevant, support us, keep the content here free and allow the idea to reach as many people as possible. **
---
💸💸💸💸💸💸
👇 👇 👇 👇 👇 👇

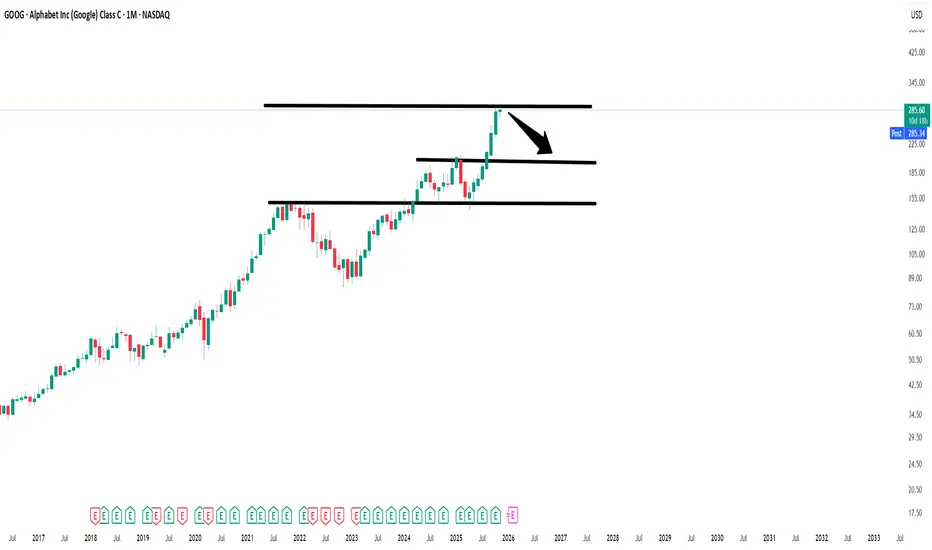
Alphabet - This stock is reversing now!🔪Alphabet ( NASDAQ:GOOG ) is reversing very soon:
🔎Analysis summary:
Alphabet created a textbook all time high break and retest back in mid 2025. The recent rally has therefore been totally expected. But now, Alphabet is totally overextended, retesting a major resistance trendline and about to also create bearish confirmation.
📝Levels to watch:
$300
SwingTraderPhil
SwingTrading.Simplified. | Investing.Simplified. | #LONGTERMVISION

GOOG / GOOGLE / ALPHABETGOOG - following a cycle of 47 months. It bottoms out or tops out in the zone highlighted. Since the breakout in September 2025; seems headed for 381/416. Would make sense to book out any investments if it reaches there and wait for levels of 250 or lower.

GOOG is trading at overhead resistance but chart is constructiveGOOG is pressing into overhead resistance near $325. The EMAs have turned bullish, with the shorter green EMA now above the longer orange EMA, and the RSI holding above 50. If momentum stays intact and the EMAs begin to widen with positive slope, the probability of a breakout above the resistance zone increases.
Noteworthy, Cantor Fitzgerald has turned bullish on Alphabet, arguing its AI edge will support further gains. The broker upgraded the shares to overweight with a higher $370 target, noting Gemini and Google’s wider AI stack remain under-appreciated. With regulatory pressure easing and revenue momentum building in search and cloud, Cantor thinks Alphabet’s competitive position is strengthening despite last year’s strong rally.

Alphabet - The exceptional short setup!🔒Alphabet ( NASDAQ:GOOG ) is reversing right now:
🔎Analysis summary:
Alphabet is clearly indicating a major bearish move. With the current retest of major resistance, Alphabet is slowly reversing. Since Alphabet is also massively overextended, really everything is pointing towards a move lower. Just give it a couple of days to reverse.
📝Levels to watch:
$300
SwingTraderPhil
SwingTrading.Simplified. | Investing.Simplified. | #LONGTERMVISION

Just In: Alphabet Inc. (NASDAQ: GOOG) Surging in Early PremarketShares of Alphabet Inc. (NASDAQ: NASDAQ:GOOG ) is experiencing a notable uptick of 0.63% in early market trading on Monday albeit market condition. The asset last close trading session was up 1.67% on Friday.
In recent news, A Spanish consumer rights association on Friday said it had launched preliminary legal action against Google for allegedly collecting sensitive personal data and violating their right to privacy.
The Association of Communication Users (AUC) says the US tech giant collected data about users' personal opinions, religion, sexuality and health through applications and the Android operating system, supporting their claim with a study by a Dublin-based university professor.
"Technology and the desire to provide a service have taken precedence over putting in place safeguards to protect people's privacy," AUC secretary general Bernardo Hernandez told AFP.
"The issue of privacy is extremely scandalous because not even the bare minimum is protected," he added, saying Google could have provided the same services without unnecessarily collecting "an excessive amount of data."
Analyst Summary
According to 44 analysts, the average rating for GOOG stock is "Strong Buy." The 12-month stock price target is $307.02, which is a decrease of -0.52% from the latest price.
Important Dates
The next estimated earnings date is Tuesday, February 3, 2026, after market close. The stock price has increased by +62.30% in the last 52 weeks.

GOOG - From Erections Come CorrectionsAnytime you get an erection, move like this on a chart, rest assured, a correction is right around the corner.
Buffet's purchase of 1% of his cash holdings does not justify hundreds of billions in market capitalization gains.
GOOG has now exploded 53% since Sept. if you were long. GREAT! Take your profits and run! If you are chasing, you will ultimately get burned.
Remember, no matter where the price goes, you are always 100% from ZERO!
I will be the first to tell you that the most & easiest profits are always made at the tops of markets. When everyone and their grandmother is bullish! Therein is the problem! TOP!
GTFO and STFO!
THANK YOU for getting me to 5,000 followers! 🙏🔥
Let’s keep climbing.
If you enjoy the work:
👉 Boost
👉 Follow
👉 Drop a solid comment
Let’s push it to 6,000 and keep building a community grounded in truth, not hype.

GOOGLE Bear Cycle has started and this is its ultimate blueprintWe made this chart on Google (GOOG) a little more than a month ago, warning of a potential market top on the Higher Highs trend-line of the multi-year Channel Up.
Well 3 weeks ago, the market hit that trend-line and we have a legitimate technical reason to expect that the Bull Cycle has topped. The 1W RSI has even printed the same kind of peak formation it did in September 2021.
We have extended the Channel Up on today's analysis all the way back to Google's IPO and the Fibonacci retracement levels serve absolute justice since the beginning to identify tops and bottoms.
You can see that the 1W MA200 (orange trend-line) has acted as the ultimate Support, thus best buy entry, on the last three major market corrections: the March 2020 COVID crash, the October 2022 Inflation Crisis bottom and the April 2025 (almost) Tariff War.
Before that, it was the 1W MA100 (green trend-line) that gave two excellent buy opportunities back-to-back.
As a result, even though the 2022 Bearish Leg correction bottomed on the 0.5 Fibonacci retracement level, this time we will 'limit' the new Bear Cycle to those MA trend-lines, the MA100 and MA200. If the price is contained on the MA100, its current trajectory shows a potential 'fair' contact around $230. If the market fails to rebound there, we expect a Q3 2026 bottom on the 1W MA200 around $190.
Regardless of that, we will also be looking closing at the 1W RSI. Since the 2020 COVID crash, and those 3 in total major corrections that the Alphabet stock had, when the RSI hit the 32.00 level, it presented an objective buy opportunity, even though in 2022 it dipped even lower.
---
** Please LIKE 👍, FOLLOW ✅, SHARE 🙌 and COMMENT ✍ if you enjoy this idea! Also share your ideas and charts in the comments section below! This is best way to keep it relevant, support us, keep the content here free and allow the idea to reach as many people as possible. **
---
💸💸💸💸💸💸
👇 👇 👇 👇 👇 👇
Stock Market Forecast | BTC TSLA NVDA AAPL AMZN META MSFTStock Market Forecast | CRYPTOCAP:BTC SP:SPX NASDAQ:NDX CME_MINI:ES1!
Mag 7 | TSLA NVDA AAPL AMZN META MSFT GOOGL

Google - A major correction starts now!🚽Google ( NASDAQ:GOOGL ) is now creating a top:
🔎Analysis summary:
Over the course of the past couple of months, we witnessed a major rally on Google of about +100%. This rally was totally expected, following the underlying bullish rising channel. But with the current retest of the trendline, Google is heading for a major correction.
📝Levels to watch:
$300 and $200
SwingTraderPhil
SwingTrading.Simplified. | Investing.Simplified. | #LONGTERMVISION

Google still going up in wave but hit 1.618 extensionNASDAQ:GOOGL Wave III continues, price looks exhausted but just won’t stop rewarding investors. It may trap late trend-chasing investors, causing them to capitulate lower.
Wave (5) of III is likely to complete with a throw-over of the upper channel boundary. Wave IV now has an expected retracement target of the 0.236 and daily pivot, $269. The gap remains unfilled.
📈 Daily RSI has printed a bearish divergence from overbought for weeks.
👉 Continued upside has a target of the R3 pivot
Safe trading
Alphabet Into $325 ResistanceGoogle/Alphabet has ripped through 217 and now at 325. The trouble with a fast move like this is there's heavy money looking for reversion to the mean. We are very far form any long term trend lines and up above the post-covid maximum trend line. Holding onto GOOG/GOOGL is highly risky here.
Major resistances like $217 almost always get checked back into so the risk of $217 is very high. I know google's revenue has been showing signs of accelerating, but not at fast enough rates that make me think it can fully avoid hitting 217.
So short resistance here 325 targeting 217.
Good luck!
Blue Skies or Elevator Down?Currently trading inside a chop zone.
The repeated holds on the downtrend algo suggest this entire area has been accumulation around PWH/PMH. With the Berkshire stake and the negative sentiment floating around, it’s hard to know their exact cost basis — but the structure hints accumulation took place near the 50-day (around 285) and along the downtrend algo, with the upside trigger lining up at 302.65 and BPS levels at 306.89/312+.
Key levels I’m tracking:
• Low-Vol ST 1: 290.58
• Low-Vol ST 1b: 323.20
• Buy/Defense Zones: 285 • 290.58 • 295
I trade intraday — pure scalps. My entire approach is finding the pressure points where one side gets trapped and putting them against the wall.
I’m a trading assassin. I hunt bulls. I hunt bears. I survive the market.
I see the chart, and I act.

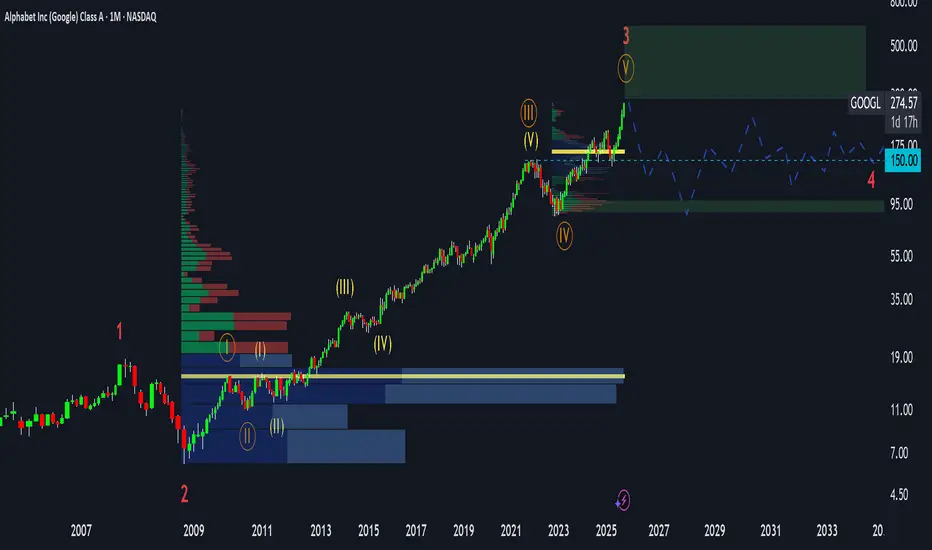
Is Google Entering Distribution? (GOOG, GOOGL Analysis)⚡ Overview
Recently, the charts of all major tech giants — Apple, Amazon, Google, Meta, and Microsoft — have started to look almost identical.
Each of them seems to be either topping out or entering what looks like a distribution phase.
In this post, I’ll share my technical and fundamental outlook on Google (GOOG, GOOGL), along with the key risks and price zones I’m watching as a trader.
💡 Fundamental View
From a fundamental perspective, Google still looks strong:
The P/E ratio has been growing steadily.
Revenue continues to rise.
The company has been aggressively buying back shares for years.
So fundamentally, this is not a bubble.
By Peter Lynch’s fair value formula, Google remains fairly valued, maybe even with a modest upside left.
However, strong fundamentals don’t always mean big growth ahead — especially when the market has already priced in perfection.
And that’s typically when the distribution phase begins.
📈 Technical View
According to Elliott Wave Theory, Google seems to be completing the fifth sub-wave within a larger third wave —
a structure that often marks the final stage before a distribution or correction phase.
On the long-term chart, price is now approaching the upper boundary of the rising channel,
with limited upside potential — possibly up to $430–$450, which represents the top zone.
Beyond that, the probability of continued growth drops sharply, while correction risk increases significantly.
⚙️ Market Structure
When analyzing the volume profile, the largest accumulation zone sits around $15 – $16 —
that’s where long-term investors entered 15 years ago.
Those early buyers are now sitting on massive unrealized profits,
and many are gradually distributing (selling) positions into current strength.
Meanwhile, retail traders often see the ongoing move as “more upside ahead.”
But in reality, this could be the final buying climax before a deeper correction.
🧩 Cycle Context
Interestingly, the same pattern is visible across Apple, Meta, Amazon, and Microsoft.
It’s not just about one stock — the entire Big Tech segment appears to be entering a similar maturity stage of the cycle.
That’s why I believe Google could soon transition from markup to distribution,
followed by a potential multi-quarter sideways or corrective phase.
💬 What’s your take? Do you think Google will reach $400 before correcting — or has the top already formed?
👇 Share your view in the comments.
Alphabet (GOOG) Set For Correction -RSI Shows Bearish DivergenceThis daily chart highlights an upside impulse in the making
Price action fits neatly within the orange uptrend
The major portion of the move appears complete with waves 1-3 finished as shown by the white labels
RSI displays strong bearish divergence against the higher highs on the chart
The large wave ((4)) is expected to unfold next
The downside target zone is shown by the pink box between 245 and 208 representing the 38.2-61.8% Fibonacci retracement of wave ((3))
The bottom of the smaller wave 4 sits within this zone at 237 and price often retests that level
And yes wave ((4)) could break down the uptrend
After that the final wave ((5)) should at least retest the wave ((3)) peak at 304
Good Luck!

Even The Most Accomplished Make Mistakes $Goog [Berkshire]Berkshire Hathaway made an entrance into the Mag 7 (Excluding Apple) with its purchase of Alphabet / Google I believe that this was a mistake solely based on the fact that the majority of the tech industry is extremely overvalued. While Googles Valuation at least in my opinion is justified considering how strong Its business model is with its High Margin Reoccurring Subscription models (Google Cloud),(YouTube Premium),(Google Workshop),(Google Play) to name a few and how Dominate it is in Ads with YouTube / Chrome. It also Dominates Web Search let alone the majority of people saying they will "Google something" it sounds stupid but its a good mental metric on how people think of search. Google has built Search / web ecosystem to complement each other and force you to use there services in one way or another you are using there web ecosystem everyday from Google maps, to Google Docs or Gmail, they made you dependent on there services, Especially the younger generation (GenZ) is growing very dependent on Google Maps which may be free but shows you the grip they have on peoples web use. The Primary issue I have with Berkshire Hathaway entering at these prices is generally the markets are indiscriminate if the mag 7 or tech industry has a red day no matter how strong Google may be that will bring them down too.
-----------------------
My Personal Thesis on Google:
I am very bullish on several areas of Alphabet Including but not limited to Google Cloud, YouTube, Its subscription Services, Its high Margin software business model. Most Importantly to me is There Robotics Section Deepmind and Gemini Robotics. Robotics is underappreciated and my personal belief is that it is the Next AI like boom but we are very early to this. Robotics has use cases in every industry from Solving lack of labor issues and an aging workforce / population especially in western countries Robots can easily pick up this slack and they will greatly benefit from Artificial intelligence Google / Alphabet has the money and cashflow to heavily invest in this area maybe not creating the physical humanoid robots but they can definitely excel in the software section of it. Segments like Waymo are also interesting and bullish. Google is also massively profitable has very little debt, and an extremely solid balance sheet.
-----------------------
Risks:
I Believe the biggest Risk for Alphabet once again is that The American Tech Sector is extremely Overvalued, I Also See moderate amount of risk being that Google is such a monopoly that leaves it open for Antitrust Suits.
-----------------------
Business Model:
Google Is Vertically Integrated its Business was closely tied to the AI Boom being one of the Big 3 with its AI spending. People Disregard its extremely impressive moat it possesses having one of the strongest moats in tech let alone in the history of business.
-----------------------
Fundamentals:
Cash: US$98.50b
Debt: US$26.60b
Equity: US$386.87b
Total Liabilities: US$149.60b
Total assets: US$536.47b
Net Margins: 32.23%
-----------------------
Metrics:
Return On Equity: 32.1%
Return On Assets: 22.5%
Return On Capital Employed: 28.8%
-----------------------
Valuation:
Price to Sales: 8.9x
Price To Earnings: 27.7x
Price To Book: 8.9x
-----------------------
Disclaimer: I am not Initiating buy, Sell or Hold Opinions. I Only make these posts for Conversation. I am not a financial Expert or an Analyst.