$M2 money printer is about to go brrrM2 money supply could see an increase in the near future due to several key factors. Central banks may adjust monetary policies to inject more liquidity into the economy, while new fiscal stimulus measures could further boost M2. Additionally, rising consumer and business spending might drive up the demand for money. Inflation concerns could also lead central banks to expand M2 to stabilize prices. Keep an eye on these developments as they unfold.
Growth

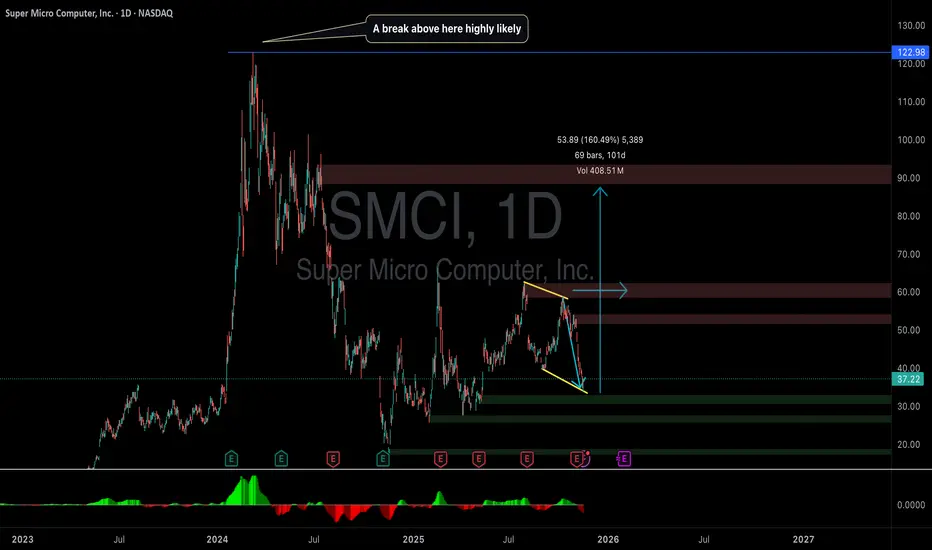
Bullish Case for SMCI: Why the Next Big Move Could Be ExplosiveSuper Micro Computer (SMCI) remains one of the most powerful AI-infrastructure plays in the market, and the bullish setup going into the next quarter looks exceptional.
1. Next Quarter Revenue Forecast: $10B — Up 100% QoQ
Analysts expect SMCI to report $10 billion in revenue next quarter — a 100% jump from the previous quarter.
This kind of acceleration is extremely rare for a company of SMCI’s size.
A triple-digit quarter-over-quarter growth rate signals:
Surging demand for AI servers
Rapid expansion of hyperscaler orders
Strong execution in supply chain and delivery
SMCI taking meaningful market share from Dell, HP, and legacy OEMs
Wall Street absolutely rewards revenue hyper-growth like this.
2. AI Infrastructure Demand Is Exploding
AI training and inference workloads are scaling at a pace never seen before. Every major AI company is racing to expand server capacity, and SMCI has positioned itself as:
Faster than competitors
Cheaper to deploy
Highly customizable
NVIDIA’s preferred partner for next-gen GPU systems
As long as AI accelerators remain the hottest commodity in tech, SMCI remains at the center of that demand.
3. Margins Are Expanding With High-End Configurations
High-performance racks built around H100, H200, B100, and next-gen NVIDIA/AMD GPUs carry much higher margins.
More customers are upgrading to fully-integrated racks rather than low-tier components.
This means earnings could beat expectations, not just revenue.
4. SMCI Is Becoming a Core AI Index Play
Funds that want exposure to AI infrastructure don’t have many pure plays available. SMCI is now viewed as:
A backbone of AI datacenters
A beneficiary of every new GPU cycle
A growth stock with real earnings, not hype
This attracts institutional inflows during AI-sector rotations.
5. Technical Setup Supports a Bullish Breakout
Although volatile, SMCI consistently builds higher lows over time.
With a $10B revenue forecast ahead, sentiment could flip extremely fast.
A strong earnings beat + raised guidance can trigger:
A major gap-up
Short covering
Renewed momentum buying
Bottom Line
SMCI is entering one of the strongest growth phases in its history. With revenue expected to double next quarter, rapidly expanding AI demand, and improving margins, the setup is highly bullish.
If the company delivers anything close to the $10B forecast —
the stock could reprice sharply to the upside.
Insight Enterprises | NSIT | Long at $92.10Insight Enterprises NASDAQ:NSIT
Technical Analysis
Price entered my "crash" simple moving average zone. Often, but not always, this is an area of algorithmic share accumulation and price reversal. A red flag, however, is that there are still open price gaps on the daily chart down to $50. A green flag is that there are open price gaps up to $215. While the price gaps below will likely get filled in the future, I am betting on a short-term reversal (if not longer-term one) given the prospective growth and its current P/E of 20x (electronic industry currently near 30x).
Insight AI
Stock enters the "crash" zone, and suddenly there is an generative AI announcement to drive revenue and EPS growth: www.businesswire.com . Intentional drive down of stock price for entry? Time will tell.
Revenue and Earnings-per-Share Growth into 2028
Revenue: $8.32 billion in 2025 to $9.88 billion in 2028 (+10.8%)
EPS: $9.64 in 2025 to $12.38 in 2028 (+28.4%)
Health
Debt-to-Equity: 0.9x (pretty good)
Quick Ratio / ability to pay current bills: 1.3 (1.5-3.0 is ideal, but still pretty good)
Alman's Z Score / risk of bankruptcy: 1.8 (3+ is ideal, so moderate risk)
EBIDTA: 5% to 7% range, which is generally considered healthy
Action
Given the "value", AI integration, technical analysis assessment, and growth, NASDAQ:NSIT is in a personal buy zone at $92.10. Caution if the stock dead-cat bounces and aims to drop further into the $50s, but I suspect fundamentals will have to dramatically change in the near-term for that to happen (or the economy crashes)...
Conservative Targets into 2028
$105.00 (+14.0%)
$117.00 (+27.0%)

High Growth Super APP at under 6 PEKaspi is a super app with ecommerce, fintech, mobile payments and more all in one.
High Profit margin, High growth potential and trading at a very low PE.
Not without risk, the stock is in Kazakhstan, right below Russia.
"Kaspi is like the Amazon + PayPal of Kazakhstan – one app for shopping, paying bills, and loans. Everyone uses it, so it keeps growing fast.
It makes a ton of money on every dollar it earns – 35 cents profit per $1 in sales, way better than most companies.
The stock is on sale – costs $71 but could be worth $489 next year if people see how fast it grows.
Grows earnings 18% every year – like your allowance doubling every 4 years, forever.
Almost no debt – only owes 27 cents for every $1 it owns, super safe.
Holds $2 billion cash – enough to buy back shares or expand without worry.
Bosses own 44% of the company – they win only if you win.
Expanding to Turkey – like opening new stores in a bigger mall.
Makes $6.74 free cash per share – could pay big dividends later or grow faster.
If growth stays, $71 today → $2,164 in 10 years – "

DUOLINGO AI MAXThe recent sentiment for Duolingo has been shaky. Leveraging AI to maximize content output has not exactly translated well for Duolingo. AI content is controversial, and tests lost some accuracy. They also wish extend their reach by offering different subjects now that they believe the content is ready to produce. Is it really necessary or could this be similar to what Meta tried to do when they pushed their Metaverse ambitions? Will mistakes need to be made first before finding something that makes sense? Despite the controversy and upset loyal users, growth companies will behave like visionaries until they are slapped back into reality.
According to documents from 2023 to 2025, Duolingo financials show consistent high growth numbers, stable but slightly compressing margins, and rapidly improving profitability.
On revenues, the company reports remarkable momentum driven primarily by subscription growth. ~+40% YoY, $754.7 this year so far.
User Metrics:
MAU = 135.3M, +20% YoY
DAU = 50.5M, +36% YoY
Paid Users = 11.5M, +34% YoY
Margins remain exceptionally high for a software subscription business, showing strong operating leverage, with mild compression due to AI-Driven product investment.
Gross Margins:
2025 YTD: 72%
2024: 73%
2023: 73%
Duolingo has entered a highly profitable scaling phase. The business is transitioning from growth-mode to cash-generative compounding mode. R&D and G&A is growing slower than revenue.
Given rising net income and expanding equity base, ROE is improving materially as operating leverage continues. ROC is surging upwards as the company shifts from R&D heavy to monetization heavy. In other words, low capital requirements and rapidly expanding operating income.
An intrinsic value of $260 - $345 aligns with its hard to replicate network effect, high FCF conversion, and growing margins.

Thinkific Labs (TSX: THNC) - Swing Trade💰 THNC — Swing Trade Breakdown (TSX)
🏢 Company Snapshot
Thinkific Labs (TSX: THNC) is a Vancouver-based SaaS company that enables creators and enterprises to build, market, and sell online courses. It’s been drawing attention recently after stabilizing near multi-month lows, with earnings on deck and improving cash flow signaling a possible turnaround setup.
📊 Fundamentals
THNC trades at roughly 180× earnings (TTM) — stretched versus typical software peers around 20–40×, though its profitability base is small.
P/B is ~2.4×, which is reasonable given its strong cash position (~C$71M) and minimal debt (D/E ≈ 0.04).
ROE sits around 1.6%, showing that profitability is still in the early stages of improvement.
It doesn’t pay a dividend, staying fully growth-focused.
Free cash flow sits near C$12M, giving it enough flexibility to reinvest while maintaining a solid liquidity cushion.
Summary: Fundamentally sound balance sheet and cash reserves, but expensive valuation and low profitability — typical for an early-stage SaaS recovery story.
📈 Trends & Catalysts
Revenue growth is soft but positive (+1.6% QoQ).
EPS has turned slightly positive — small profits are emerging, marking a potential inflection point.
Cash flow and liquidity continue improving, with consistent positive free cash flow.
Upcoming Q3 2025 earnings (Nov 12) could serve as a catalyst, especially if margins expand.
Risks include rich valuation, competitive pressure in the e-learning space, and lingering weakness in software sentiment.
🪙 Industry Overview
The software and e-learning sector has been mixed. Over the past month, THNC is down roughly 11%, lagging peers. Over 12 months, it’s down about 27%, underperforming the sector amid a shift toward profitability and AI-driven platforms. Short-term sentiment is neutral to slightly bearish, but any strong beat in earnings could quickly flip that tone.
📐 Technicals
THNC closed around C$2.11, sitting slightly above its 50-day SMA (~C$2.05) — an area of near-term support.
The 200-day SMA (~C$2.41) looms overhead as a key resistance marker.
Momentum has cooled, but the stock is consolidating tightly between C$2.00 and C$2.15, showing signs of base-building.
Support sits at C$2.00–2.10, resistance around C$2.40–2.70.
Volume remains light (~50–80k shares/day), so watch for a breakout day with strong volume to confirm demand.
Pattern: Tight consolidation near support after a steep decline — potential for a reversal or relief rally if volume spikes.
RSI(2): Neutral — no oversold or overbought signal currently.
🎯 Trade Plan
Entry Zone: C$2.05–2.15 — ideal for accumulation near support or a 50-SMA retest.
Stop Loss: C$1.95 — below key support; invalidates base.
Target: C$2.70 — aligns with resistance and 200-SMA retest.
Risk/Reward: Approx. 2.7× (solid swing setup).
Alternate Setup: Breakout above C$2.50 on strong volume could trigger a momentum continuation toward the high C$2s.
🧠 My Take
THNC offers a low-risk swing setup with improving fundamentals and technical stabilization. It’s cash-rich, debt-light, and forming a potential base around C$2.00. While long-term momentum remains bearish (still below 200-SMA), short-term traders can target a bounce back to C$2.70 if earnings or sentiment improve.
My bias: Cautiously bullish — watching for entry near C$2.05 with tight risk below support and a 2:1+ R/R toward the C$2.70 zone.

GPUS: Range Bound & Undervalued!AMEX:GPUS is quietly stacking value while trading in a range. At $0.35–$0.37, it's 61% below the estimated NAV of $1.02/share backed by $122M in cash + BTC vs. just $118M market cap (Nov 6 update).
Do your own research and trade at your own risk.
ASTS 4H: space internet or orbital dream?AST SpaceMobile (ASTS) is consolidating above the $61–69 zone, right near the 0.618 Fibonacci level of its last major rally. On the 4H chart, momentum shows early reversal signs: falling volume on pullbacks, stochastic turning up, and buyers defending local lows. The bullish setup holds as long as price stays above $61, with upside targets at $100 and $135 where the extension projection aligns.
Fundamentally , as of November 2025, ASTS stands out as one of the most promising yet capital-intensive players in the satellite telecom industry. The company completed deployment of its BlueWalker test constellation and is preparing for commercial rollout of direct-to-cell satellite connectivity. Successful phone-to-satellite calls using standard smartphones - validated with AT&T and Vodafone - mark a true technological milestone, positioning ASTS as a potential first-mover in global space-based mobile internet.
Revenue for the first nine months of 2025 reached roughly $55M, almost double last year’s level, but operating losses still exceed $300M due to high manufacturing and launch costs. The company holds about $180M in cash versus ~$260M in debt, continuing to rely on strategic partnerships and funding programs to maintain liquidity. The key upcoming catalyst is the commercial network activation in 2026 in cooperation with AT&T, Vodafone, and Rakuten, which could dramatically change valuation if successful.
With investor attention shifting back to space communications, competition with Starlink and Lynk Global is heating up, but ASTS’s advantage lies in using standard smartphones without extra hardware. Risks remain - high capital needs, launch delays, and dependency on partner timelines - yet the reward potential is extraordinary if execution holds.
Tactically, staying above $61 keeps the bullish structure alive with $100 and $135 as primary targets. A breakdown below $60 would negate the setup.
They’ve already connected phones to space - now let’s see if they can connect revenue to profit.

NOVAGRATZLOADED shares at $29.45 Friday. This is MSTR on steroids with actual revenue + AI data centers.
Just printed their best quarter ever ($505M net income, ~$29B rev) thanks to a $9B BTC whale trade 80k+ BTC sold OTC with minimal slippage + exploding trading volumes. But the real rocket fuel is HELIOS AI/HPC pivot: 800MW live, 2.7GW pipeline, NASDAQ:CRWV locked in for $435M+ annual EBITDA potential. Morgan Stanley calls it $30B terminal value. $1.15B convertible notes at 0.50%? Dirt-cheap capital to fund growth — not dilution yet. Catalysts: BTC >$120K (Galaxy amplifies 2-3x)
Helios revenue ramp H1 2026 On track for initial energization/power-up in December 2025
Technicals: Broke out of multi-month base
RSI cooling after dip (oversold bounce incoming)
Volume shelf at $29 = strong support $25 floor
Golden cross forming on weekly
This dip was the last shakeout post-notes FUD.
Add on dips around $30
Trail stops or take partials above $45
Full send to $60+ this year if BTC rips
Helios power-up = moonshot. Estimates backward-looking; if Helios hits + crypto cooperates, Q4 crushes again (revenue normalizes but margins fatten). $60+ YE

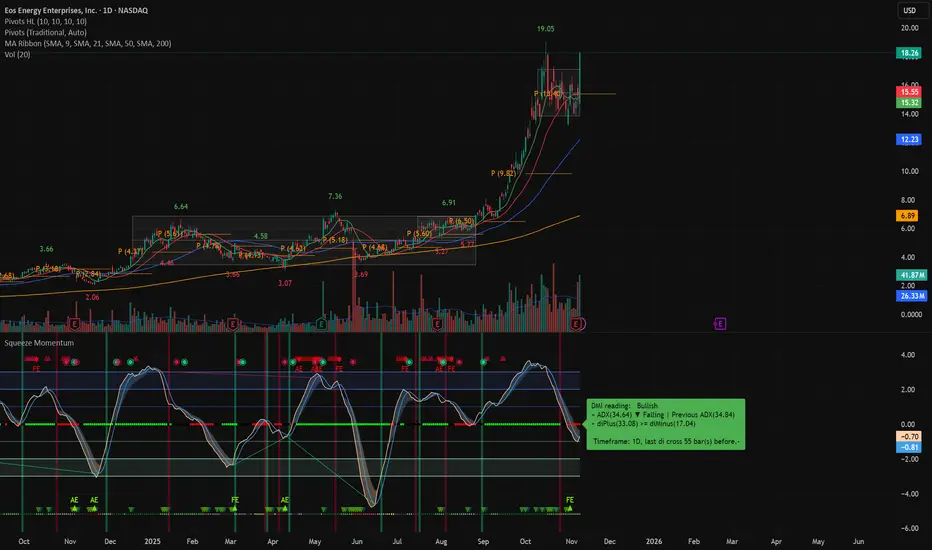
A SetupWhat qualifies as an A+ setup (Big Three)
Compression: A valid Big Three squeeze on your chosen timeframe.
Signal: Big Three Buy Signal present.
Trend filter: Price above the moving averages.
Multi-timeframe game plan
Anchor (bigger picture): Daily / 3-day squeezes to define backdrop & runway.
Trigger (trade timeframe): 2-Hour (or 30-min/15-min/5-min) A+ squeezes for entries.
Bias maintenance: Hold only while the price stays above the trailing stop and the structure stays bullish.
Pre-flight checklist (grade it fast)
Squeeze present on your entry timeframe (2h / 30m / 15m / 5m).
EMA stacked in order (no exceptions for A+).
Trend/structure: Uptrend or at least neutral turning up.
Bigger picture alignment: Daily / 3-day not fighting you; momentum not deeply negative.
Nearby “fuel” (levels): Key MAs (e.g., daily 50), pre-break accumulation, gamma call walls, and recent highs.
Entry & management (simple and consistent)
Entry trigger options
First break out of the squeeze range with structure and signal intact.
Or pullback-to-hold above trailing stop/MA inside the squeeze; buy the next higher low → higher high sequence.
Initial risk
Stop: just below the trailing stop or last pivot low inside the squeeze.
Positioning: size so a stop hit ≈ 0.5R of daily risk (or less).
Profit taking
Tier 1: prior swing high / measured move from squeeze range.
Tier 2: roadmap targets (recent highs, round numbers, and gamma walls).
Trail partial with trailing stop; roll or trim if momentum cools.
What cancels A+ mid-trade
Lose the buy signal and close below the trailing stop, 8 EMA.
Momentum rollover on your entry TF while higher TFs aren’t supportive.
Repeated failed reclaims of the squeeze top.
Plan
A+ vs “Almost A+” (how to decide)
A+ now = All four: Squeeze + Buy Signal + Above trailing stop.
Almost A+. Missing momentum.
Action: Stalk on lower TFs (5m/15m) for earlier entries, but only size up when the main TF prints full A+.
Execution guardrails (to keep your edge)
Don’t force entries before the squeeze/score/signal align—let it become A+.
If you take a starter on a lower TF, earn the add-on higher-TF confirmation.
Respect gaps: lock tiers into gap pushes from active squeezes.
Keep a daily max loss; after 2R down or 2 invalid setups, flatten and reset.
Screener:
www.tradingview.com
CANSLIM Overview📘 CANSLIM Overview — The 7 Traits of Big Stock Winners
CANSLIM is an acronym developed by William J. O’Neil, founder of Investor’s Business Daily (IBD) and author of How to Make Money in Stocks.
It describes the seven common characteristics shared by the biggest winning stocks before their major price moves.
The system blends fundamental growth, institutional behavior, and market timing—and is grounded in historical quantitative studies dating back to the 1800s.
🧩 The Acronym:
Letter Stands For Core Concept
C Current Quarterly Earnings Explosive short-term earnings growth
A Annual Earnings Growth Multi-year compounding of profits
N New Product, Service, or Management Innovation driving market leadership
S Supply and Demand Stock’s float size and institutional accumulation
L Leader vs. Laggard Relative strength and group leadership
I Institutional Sponsorship Quality fund ownership and buying pressure
M Market Direction Aligning with the general market trend
1️⃣ C — Current Quarterly Earnings: Big Growth, Not Modest Growth
“The biggest winners showed three consecutive quarters of 25%+ growth, but the best averaged 70%+ before their runs.”
Measure this quarter vs. the same quarter last year, not sequentially. This avoids seasonal distortions.
Ideal Growth Rate:
Minimum: +25% YoY EPS growth for 3+ quarters
Stronger filter: +70–100% or even triple-digit earnings growth
Combine with revenue growth of 30–50% or more.
Stocks with massive EPS and sales growth attract institutional attention early.
Modern Adjustment:
Today’s growth leaders (e.g., NVDA, TSLA, PANW) still show these patterns, though some use non-GAAP EPS or adjusted metrics. The concept—explosive profitability inflection—remains identical.
2️⃣ A — Annual Earnings Growth: Sustained Profitability
“Look for at least three years of annual earnings increases.”
Consistency is key. Accelerating growth adds conviction.
Avoid one-time spikes or negative earnings trends.
Favor firms with 3+ years of 20%+ annual EPS growth and positive forward analyst estimates for continuation.
Analyst Upward Revisions are particularly powerful—funds often buy on these changes.
Interpretation:
Multi-year profit acceleration shows management execution, competitive edge, and strong demand.
Example: O’Neil’s model studies (1952–2001) showed 73% of winners had +70% EPS growth the quarter before their breakout and 3+ years of rising annual profits.
3️⃣ N — New Product, Service, Management, or Market Catalyst
“You want the next Apple, not the next RCA.”
Innovation is the engine of multiple expansion. The “new” can take many forms:
Breakthrough product or service
Transformative business model
New leadership or management
Market share disruption
Examples (then and now):
Apple (iPhone), Tesla (EVs), Nvidia (AI GPUs), Uber (gig economy)
Earlier eras: IBM, Home Depot, Microsoft
Psychological angle: Human nature craves novelty. The market rewards perceived future dominance, not current stability.
4️⃣ S — Supply and Demand: The Float Matters (Less Now)
Originally, O’Neil favored smaller floats (≤50–70M shares) since limited supply + strong demand = sharp price moves.
“It’s less critical today—large caps can still double or triple. Focus on quality, earnings, and leadership over share count.”
The principle still holds but is muted due to:
ETFs, passive flows, and massive institutional liquidity
Widespread retail access and option leverage
The core idea remains: price rises when demand exceeds supply, visible via volume surges.
Modern adaptation:
Monitor volume spikes, accumulation/distribution, and relative volume ratios over absolute float size.
5️⃣ L — Leader vs. Laggard: The Power of Relative Strength (RS)
“Buy the strongest stocks in the strongest groups during a confirmed uptrend.”
O’Neil found each bull cycle is led by 2–3 dominant industry groups (e.g., semiconductors, software, solar).
Within those, only the top few names outperform meaningfully.
Key Filters:
Relative Strength (RS) Rating: 85–99 (top 15% of market)
Leading groups by RS, EPS growth, and fund buying
Avoid laggards even within strong sectors.
Modern context:
Institutional algorithms still chase relative momentum. RS-based filters would be Ideal.
“When you have the strongest stocks, in the strongest sectors, in an uptrend—and you use disciplined stop-losses—it’s very hard not to make money.”
6️⃣ I — Institutional Sponsorship: The Smart Money Footprint
“70% of market volume comes from institutions—follow their footprints.”
Institutions (mutual funds, hedge funds, pension plans) create sustained demand that drives major trends.
Key things to watch:
Rising number of institutional holders quarter-over-quarter
Presence of high-quality funds (e.g., Fidelity Contra, Vanguard Growth)
Volume patterns on charts confirming accumulation
Quantitative Significance:
Example: Zoom (ZM)—278 funds → 1,413 funds within 7 quarters (5× increase)
Enphase (ENPH)—160 → 1,008 funds in 8 quarters
Such surges often precede parabolic price advances.
7️⃣ M — Market Direction: The Most Critical Factor
“If you don’t get the M right, nothing else matters.”
O’Neil’s data showed:
3 out of 4 stocks follow the general market trend.
Even perfect fundamentals fail in bear markets.
Core Rule: Only buy aggressively during a confirmed market uptrend.
The signal is the Follow-Through Day (FTD)—a +1.5% or greater gain on strong volume, typically 4–10 days after a market low.
When the Market Is Choppy or Bearish:
Reduce exposure or move to cash (cash is a position).
Focus on capital preservation over prediction.
⚠️ Risk Management — The “Eighth Principle”
“You can be right 1 out of 3 times and still make a fortune—if you cut losses fast.”
O’Neil borrowed from Jesse Livermore and Bernard Baruch’s philosophy:
Max loss per trade: 7–8% (ideally 5%)
Never average down; if it fails the breakout, sell immediately.
Emotional capital matters as much as financial capital.
Risk Math:
Loss Required Gain to Break Even
7% +7.5%
20% +25%
50% +100%
→ The deeper the drawdown, the harder recovery becomes — and the worse your discipline gets.
Cutting losses early keeps both capital and confidence intact.
Advanced Discipline:
Always use stop-losses near pivot points
Size positions so that total portfolio risk ≤1–2% per trade, and the Reward is 3x your risk.
Expect that most trades won’t work; winners will more than offset losers
🔢 Practical CANSLIM Checklist
Step Criterion Target Metric
C Current quarterly EPS growth ≥25%, ideally 70%+
A Annual EPS growth 3 consecutive years ≥20%
N Innovation or catalyst New product/service/management
S Supply-demand imbalance Volume > average, low float optional
L Leadership RS ≥85; top 3 names in top sector
I Institutional ownership Increasing QoQ, ≥2 top-tier funds
M Market trend Confirmed uptrend via FTD
Risk Stop loss 5–8% below entry, always enforced
🧠 Psychological Cornerstones
Human nature never changes. Fear and greed drive every cycle—from 1800s railroads to 2020s AI stocks.
Discipline beats prediction. Entry precision is less important than loss limitation.
Conviction comes from quality. Big winners are clear leaders with strong fundamentals.
Cash is a position. Avoid trading in “cold decks” (sideways or down markets).
Emotion control = longevity. Protect your confidence as much as your capital.
🧩 Modern CANSLIM Adaptations
While CANSLIM’s DNA remains timeless, modern quantitative investors integrate:
Relative Volume & RS Ranking (machine-scored)
EPS revision momentum (analyst upgrades)
Institutional rotation data (13F filings, ETF flows)
Macro context: liquidity cycles, Fed policy, credit spreads
Technical refinements: base patterns, volume dry-ups, and volatility contraction setups (VCP).
💬 Summary Insight
“Nothing has changed since the 1800s—only the tools.
Human nature and crowd behavior are constants.”
CANSLIM is a structured behavioral framework for spotting institutional accumulation of fundamentally superior companies at the right time in the market cycle.
Its greatest edge lies not in stock-picking, but in discipline—knowing what not to touch, when to cut, and when to press.
Here is the Screener I use.
www.tradingview.com
Rolls-Royce is Going to the Moon (Literally)Its Friday night and here I am with nothing better to do than write an article on what I think is one of the most interesting companies on the market. I am absolutely enamored by Rolls-Royce for reasons I am going to explain in depth. I don't want my idea to be long and boring so I'm going to get straight to the point and explain as best as I can in a few paragraphs. There's a lot of information I want to share with you about this company so I will break the idea up into sections for an easier and more enjoyable reading experience.
Normally I would start my idea writing about the intrinsic value, I'm going to skip that because this company is incredibly overvalued as per the numbers I ran. By the end of this idea hopefully you might learn something new or find value in my writing, I am writing this idea for educational and entertainment purposes. In no way does this idea constitute financial advice but rather provide you with the all the information required to make intelligent and rational financial decisions based on facts, I am not one to be speculating about the market, I prefer to have good reasons to make investments.
As a capitalist, one of the most important things I think about before making a financial decision, is how does the company I am interested in make financial decisions. In this section I will write about how Rolls-Royce uses capital primarily to fund long-term strategic investments in R&D, advanced manufacturing, and new technologies (e.g., SMRs, electric systems), and for efficient working capital management to support day-to-day operations and a strong balance sheet.
A significant portion of capital is invested in R&D to maintain a competitive advantage and innovate. This includes developing new engine technologies (like the UltraFan and the Pearl engine family), improving engine efficiency and durability ("time on wing"), and exploring lower-carbon solutions such as sustainable aviation fuels (SAF), hybrid-electric propulsion, and small modular nuclear reactors (SMRs).
Rolls-Royce invests in property, plant, and equipment. Recent examples include investments in its manufacturing facilities (such as the £300 million investment at the Goodwood facility) to enhance capabilities for bespoke projects and improve operational efficiency.
The company focuses on the efficient management of short-term assets and liabilities to ensure robust liquidity and the ability to meet day-to-day expenses. Key aspects include:
- Inventory management: Balancing stock levels to support production and MRO (Maintenance, Repair, and Overhaul) services while avoiding excess inventory.
- Receivables collection and payables management: Optimizing cash flow by managing customer relations and supplier payments strategically. The business model for civil aerospace, where revenue comes from engine servicing based on flying hours (Long-Term Service Agreements), heavily influences its working capital dynamics and provides a stable cash flow stream.
Rolls-Royce makes strategic portfolio choices, using capital for acquisitions in key growth areas (e.g., a yacht automation business) and using proceeds from divestitures of non-core activities to reallocate resources to higher-return segments.
A primary goal is maintaining a strong balance sheet with an investment-grade profile. Once this strength is assured, capital is used for shareholder distributions, including reinstating and growing dividends and engaging in share buybacks (e.g., a £1 billion share buyback announced for 2025).
Rolls-Royce is currently executing a share buyback program to return up to £1 billion to shareholders. The program was announced on February 27, 2025, and is expected to be completed no later than December 31, 2025.
The buyback aims to repurchase up to £1 billion worth of shares by the end of 2025. As of July 31, 2025, £0.4 billion (£400 million) had been completed. The purpose is to reduce share capital and fulfill obligations from employee share plans, which should increase earnings per share. UBS AG London Branch is managing the purchases on the London Stock Exchange and other exchanges, operating under the authority granted at the 2024 Annual General Meeting. This share buyback is part of a larger capital return strategy, including a reinstated dividend, reflecting the company's financial turnaround.
Now I will write about what I find interesting to me about Rolls-Royce;
Rolls-Royce has a partnership with NASA and the UK Space Agency to develop micro-nuclear reactors for lunar habitation and exploration. While a full reactor is not yet built, the collaboration is focused on design, development, and testing phases to have a functional system ready for the Moon by the early 2030s.
Key details about the partnership include;
To provide a reliable, continuous, and powerful energy source for a future human lunar base, especially in permanently shadowed regions of the lunar South Pole where sunlight is scarce or non-existent. Rolls-Royce is developing a small, lightweight nuclear fission micro-reactor that measures about 1 meter wide and 3 meters long. This system would produce around 40 kilowatts (kW) of power, enough for a lunar outpost's life support, communications, and scientific experiments.
Roles in the lunar program;
Rolls-Royce: Responsible for the design and development of the reactor concept itself, leveraging its expertise from decades of building nuclear power plants for the UK's submarine fleet.
NASA: Leads the overall Fission Surface Power project and has awarded separate contracts to multiple industry partners (including Rolls-Royce North American Technologies, General Electric, and Brayton Energy) to develop specific components, such as power converters that turn the reactor's heat into electricity.
UK Space Agency: Provides significant funding to Rolls-Royce for research and development, aiming to get a demonstration model on the Moon by 2029 or the early 2030s.
A conceptual model of the micro-reactor has been unveiled. The focus is currently on detailed design stages and developing power conversion technology, with an open solicitation planned for Phase 2 of the project in 2025. The technology is seen as a crucial stepping stone not only for the Moon but also for powering human missions to Mars and for potential commercial and defense applications on Earth, such as providing clean energy to remote locations.
Under CEO Tufan Erginbilgiç, the company has undergone a "miraculous" transformation from a "burning platform" to a robust, cash-generating business. This has resulted in soaring profits, strong free cash flow, and a significantly strengthened balance sheet.
Rolls-Royce operates in industries with high barriers to entry due to the specialized technology, safety regulations, and huge capital requirements involved. Its large, established base of engines ensures a stable stream of aftermarket revenue.
Management has a history of setting conservative forecasts and then outperforming them, which suggests potential for future positive surprises for investors.
In summary, Rolls-Royce offers a compelling investment case for growth oriented investors willing to pay a premium for a high-quality company with a strong competitive position and clear catalysts for future growth.

ESPR 1W: cholesterol therapy for patients and investors alikeEsperion Therapeutics (ESPR) has broken its long descending trendline and retested the $2.4–$2.6 support area, forming a solid triple bottom with rising volume. The stock is now holding above key moving averages, signaling accumulation. While above $2.5, the technical setup points to a move toward $6.4, aligning with major resistance and the 200-week MA.
Fundamentally, the company enters one of its strongest phases in years. Following earlier liquidity struggles, Esperion has stabilized its operations and regained investor confidence. The core growth driver is Nexletol (bempedoic acid), a non-statin cholesterol-lowering therapy for patients intolerant to statins. In 2025, combined Nexletol and Nexlizet sales jumped over 45% year-on-year, surpassing $170 million for the first nine months. Recent safety data were positive, leading to new approvals across Europe and Japan - expanding partnerships and licensing revenues. Cash position strengthened via milestone payments from Daiichi Sankyo and Viatris, reducing debt and supporting R&D without new dilution. Challenges remain: profitability is still out of reach, as marketing and development expenses stay high, though liquidity provides breathing room. The broader biotech sector’s rebound amid rate-cut expectations adds tailwind to revenue-backed small caps like Esperion.
Tactically, holding above $2.5 keeps the bullish trajectory intact toward $6.4. A weekly close below $2.3 would negate the setup and re-test lower support, though current accumulation favors the upside.
Esperion helps reduce cholesterol - ironic that its chart still raises investors’ heart rate.

I Think GE Aerospace is BrilliantThis is one of my favorite companies on the market. I really have a deep fascination for aviation and all things, planes. Naturally it makes sense for me to have exposure to the sector. I do not have many companies in my portfolio but I'm going to share my reasons for why I have been buying GE stock over the last few months.
The value of the shares are, in my opinion overvalued right now at this price. I am going to explain why I still think this is a good investment despite the numbers coming back negative. The intrinsic value of the stock as per my model is $250. Indicating a significant overvaluation, I think my reasons for not selling and possibly buying more are sufficient fundamentally to still hold the stock in my portfolio.
The primary reasons I like this company above all the others is because of how they are using capital in their business;
GE Aerospace invests heavily in developing future technology, including advancements in Open Fan engines, hybrid electric propulsion, and hyper sonics. The company is investing in its supply chain, facilities, and suppliers to meet rising demand and improve production and service capacity. Capital is used to help customers update and expand their fleets, supporting the demand for GE Aerospace's products and services.
The company plans to return approximately 70–75% of available funds to shareholders through dividends and share buybacks, a significant increase from previous levels. This capital return strategy is intended to generate incremental value for shareholders, in addition to the company's expected growth.
A significant portion of capital is dedicated to increasing its global capacity for servicing engines to meet growing demand and support its engine platforms for decades. After the spin-off of GE Vernova, GE Aerospace retained a strong cash position that was used to fund the new company. As part of its launch as a standalone public company, GE Aerospace awarded one-time equity awards to employees to make them owners of the business.
That is all the reasons why I think this company is a good investment, fundamentally.

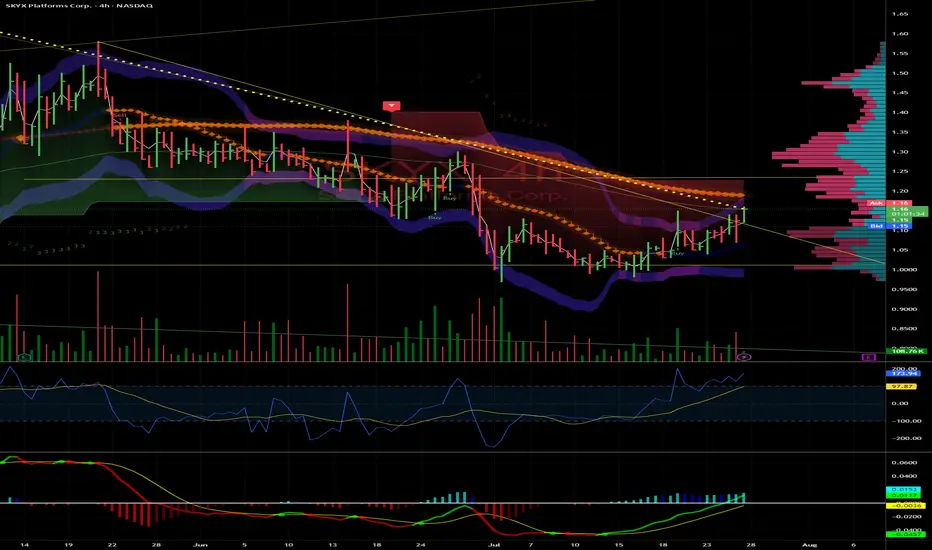
SKYX: Breakout to $1.58 and Potential Triple on Small-Cap Surge
SKYX Platforms Corp. (NASDAQ: SKYX) is primed for a run to $1.58 and could triple to $3.30 by year-end, driven by small-cap strength, e-commerce demand, and strong fundamentals. Here’s why SKYX is a must-watch.
Technicals: Clear Shot to $1.58
Trading at $1.10 , SKYX is coiling for a breakout. Resistance at $1.25 (psychological) and $1.40 (prior high) should fall easily with rising volume and a bullish MACD crossover. $1.58 is achievable by August, with $3.30 (200%+ gain) in sight if momentum holds.
Fundamentals: Smart Home Leader
With 97 patents and 60+ e-commerce websites, SKYX’s plug-and-play smart home platform is gaining traction. Their $3B Miami smart city deal (500,000+ units) and Profab Electronics partnership signal scalability . E-commerce sales, projected to hit $8T globally by 2027 , fuel SKYX’s growth.
Market Tailwind
The Russell 2000, which SKYX joined in June 2025, is breaking out, up 10% YTD . TNA’s 30% spikes amplify this . With a $138.61M market cap and 38 institutions adding shares (e.g., Susquehanna, 478,024 shares) , SKYX is set to ride this wave.
Risks
SKYX isn’t cash flow positive until H2 2025, and Q1 revenue missed ($20.1M vs. $21.15M). Small-cap volatility is a factor, but 12.4% YOY growth and the Russell breakout mitigate risks.The Play
SKYX hits $1.58 soon, clearing $1.25 and $1.40, then triples to $3.30+ by December on e-commerce, smart city deals, and small-cap momentum. I’m buying—thoughts, board?
Summary: Targets: $1.58 near-term, $3.30+ year-end.
Resistances: $1.25, $1.40.
Catalysts: Russell 2000/TNA breakout, e-commerce, smart city deal.
Risks: Cash flow, revenue misses, volatility.
Disclaimer: Not financial advice. Do your own DD. Stocks are volatile.
~Sherwood Coast's Group
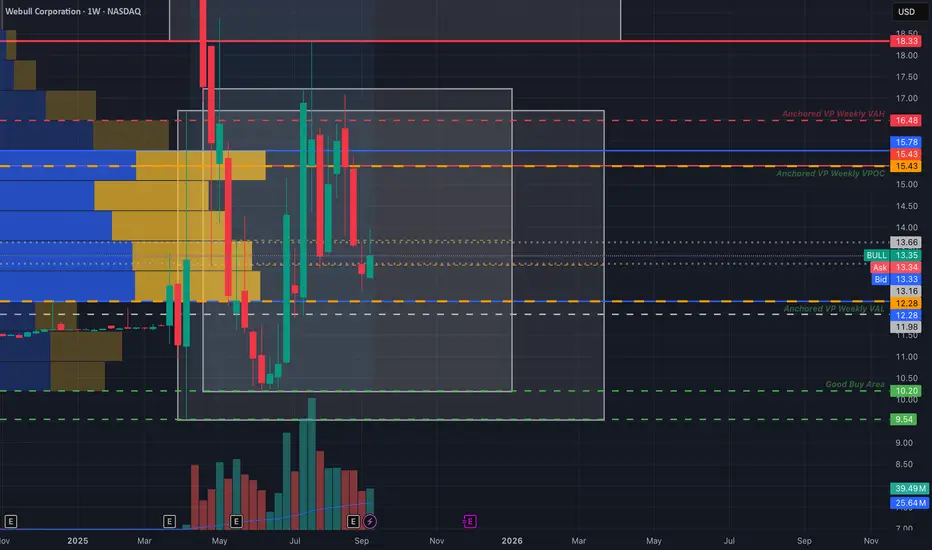
Webull Chart - Robinhood Competitor?Calling all matadors, we got a bull to corral.
I've charted some levels of interest for a speculative hold. Many view webull as a potential competitor for robinhood, although fundamentally, bull is in no-where near in the financial position that hood is in terms of free cash flow and expenses (or innovation as far as I've seen).
This could make a great swing trade on pure technicals. If the brokerage industry sees a period of exuberance(like we've seen in the quantum space), bull could catch a bid. This could also occur if we see a rotation out of hood.
I would love to pick up some shares or calls if the name completes a look below and fail of the anchored volume profile's value area low(around $12.28). or a LBAF of the box bottom @ $10.20.
So far webull has been consolidating. I believe a hold above the VPOC (volume point of control @ $15.43), a breakout of the lower boxes and reclaim of the larger upper box around $18.33-$18.87, could see a push to the mid 20s and 30s at least.
If we are following box rules for that potential trade, then I would not be surprised if bull goes to the box midpoint @ $48.97.
If this thing holds above the VPOC around $15.43 or does a LBAF of either $12.28 or $10.20 it's ripe for picking imo.
Now this is pure speculation, and my analysis could be a shack of shit, who knows, BUT if these set ups present themselves, I would like to roll the dice.
~ The Villain
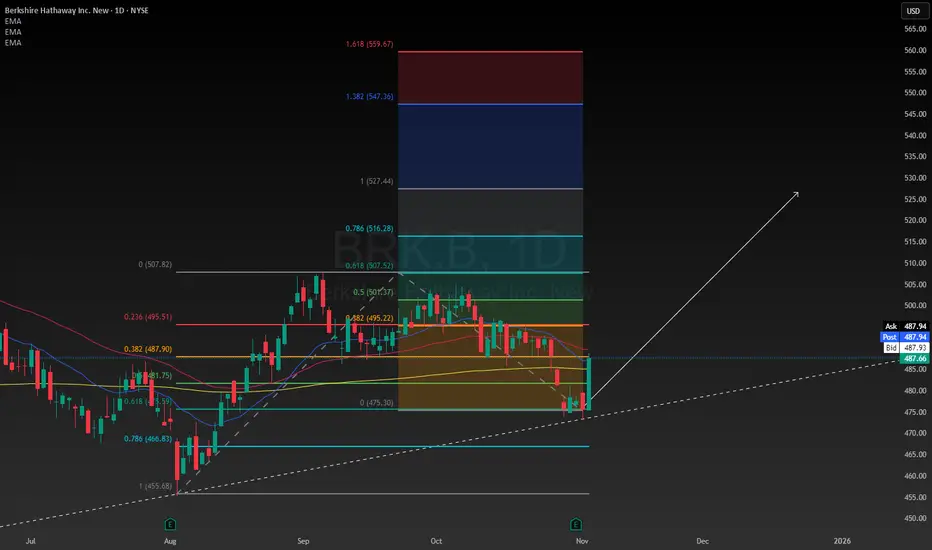
Strategically Investing in Berkshire HathawayI'm going to write about what makes Berkshire a good company, and why I am buying it. Since it is such a huge company I might not be able to define every single detail but I will do my best to cover the most important aspects of the company for you. I hope you enjoy my idea, I am using my time to write this for your benefit and entertainment. If your deciding whether or not you want to buy Berkshire shares maybe this idea can help you to be more informed without having to do a ton of research.
One of the most appealing things to me right now about the shares, is that they are significantly undervalued. The best way to determine the intrinsic value for this company would be to use the discounted cash flow calculation. Projecting 5 years into the future, based on how much money the company will be expected to generate over this period of time, it is reasonable to assume the intrinsic value of the shares to be approximately $560. I think it could take some time to get there so I'm estimating about one or two years from now Berkshire will be worth $560 or more.
Looking at how the company actually uses its capital is important. When the market is at all time highs, investors typically rebalance their portfolios into undervalued, less risky, more stable companies. Berkshire fits the narrative here, and I'm going to explain why.
-Berkshire reallocates capital to its diverse portfolio of businesses, including railroad, energy, manufacturing, and service and retail companies. This can involve funding growth and "bolt-on" acquisitions for subsidiary companies.
-A significant portion of capital is used to purchase equity securities, such as stocks in companies like Apple, American Express, and Coca-Cola, either for a full stake or a "part interest".
-The company holds a large amount of cash and short-term investments to be prepared for market opportunities, which can include waiting for the right time to make large acquisitions or investments.
-Berkshire's core insurance operations generate "float"—money taken in as premiums before claims are paid—which is then invested in other businesses and securities.
-Berkshire uses debt very sparingly and prioritizes equity and its insurance float as its primary sources of capital.
-While individual businesses manage their daily operations, top management, led by Warren Buffett, makes the major capital allocation decisions to ensure capital is deployed where it can generate the highest returns. However as many of you know, Warren Buffett will step down as CEO and leave Greg Abel in charge, I don't think this will change much in the core operations of the business.
All of these factors contribute to this being a low risk, undervalued investment opportunity despite unfavorable market conditions with the US500 being at all time highs. I have rotated some capital in Berkshire class B shares as a way to reduce my risk but also stay exposed to the market. Berkshire is a great defensive stock that can be added to a diversified portfolio to grow and protect it.
Think Long TermI'm not claiming to be a good trader, or even a decent investor! But those of us who have decided to leave short-term trading and pursue longer-term trading, things start to show that they are better than they appear.
Also, it's wayy less stressful 😂
Keep your head up. We're in a support zone, which means this is the best place to buy. In terms of growth, now that LTC is getting its first ETFs we should be able to see LTC make it back to its all-time high and maybe even higher. This should only take a couple years at most, especially seeing that it took less time for BTC and ETH to return to near all-time highs post-ETF. Might take some time due to the somewhat disappointing initial inflows to the beforementioned LTC ETFs, but what I'm trying to say is that LTC will grow over time. Just gotta give it some time. Buy now, hold for a year or so, and we should make it beyond $300 in no time 🙂
Of course, all of this is just my opinion 😂

How To Trade NEW ALTS - SECRET PATTERN !!New Alts - a Pattern
Newly released alts all seem to follow the same pattern, at least for the first few weeks. From the frontpage chart, you'll notice a very interesting "fractal" if we can call it that.
It goes something like this:
🚀 Opening Candle 💥 Top Out 👇 Hard Drop ❕ Re-enters opening price or goes under 🔁 Bottoms out (HERE IS WHERE YOU BUY) 🚀 Higher Highs follow.
With this said, it seems evident that you should WAIT to buy a coin that has just been released on the exchange. Although you could try to jump in to the moving train, the risk is simply too high if you do not already have a position.
ALTS that have already retraced, bottomed out and establishing higher lows. These alts you could easily preset TP targets from 15% onwards, depending on your risk appetite.
📈HERE are some examples:
JTO, almost there:
RVF, full retracement and beyond (This could be a warning sign as a liquidity drain)
RAY, clear bottom, full retracement, approaching re-accumulation zone:
ADA, full retracement, hard bounce, approaching key re-accumulation zone:
ALWAYS remember to take caution in the volatile world of crypto with a SL and reasonable targets. Remember that trading newly released alts and memecoins greatly increase the risk on top of the existing risk of crypto.
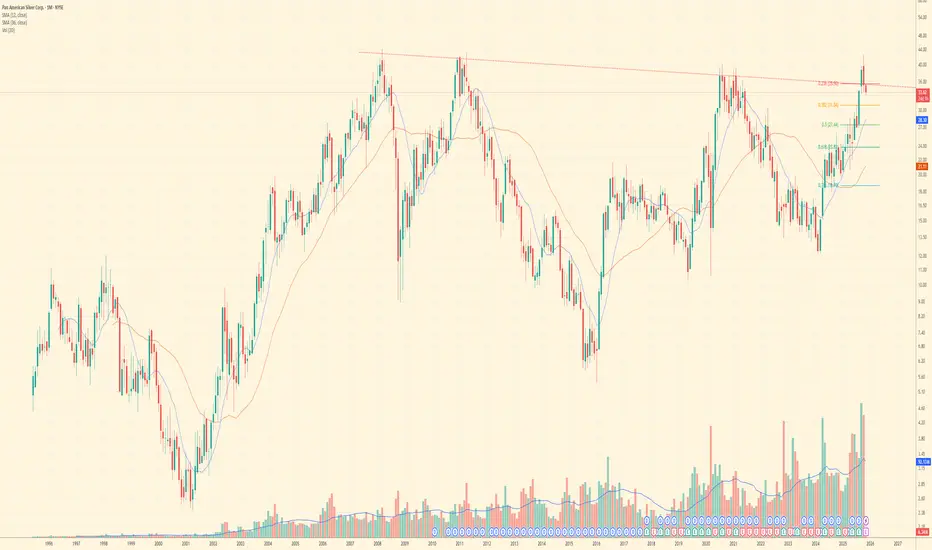
Did PAAS confirm breakout?PAAS is at a crucial inflection point.
- Long-Term Breakout: Price recently broke out above the multi-year descending trendline (red dashed line) with strong volume.
- Price Target: A confirmed breakout opens the door for a potential double in price, aiming towards the all-time highs and beyond ($70.00+).
This technical signal is strongly backed by the company's recent performance:
- Silver Rally: Spot silver trading above $42/oz, driven by industrial (solar) and investment demand.
- Financial Strength: PAAS reported $1B+ cash and a 20% dividend increase tied to net cash.
- Growth Driver: The low-cost Juanicipio asset will boost silver production by 34% and significantly lower all-in sustaining costs next year.
The combination of a strong technical setup and robust fundamental catalysts makes PAAS a prime breakout candidate. Watch the closing price carefully!
Disclaimer: This is not financial advice. Trade responsibly.
$SHOP: A 4-Year Pattern Breakout Before EarningsWith the AI bubble looking frothy, investors are hunting for the next big rotation. The consumer holiday play looks like the perfect switch, and all eyes are on $SHOP.
This is looking like a clean breakout from a massive 4-year rounding bottom—a pattern this big is a major deal.
The setup couldn't be more critical:
• Catalyst: Earnings are tomorrow (Nov 4) pre-market.
• Sector: AMZN just hit a record high. The e-commerce holiday season is the clear narrative right now.
• History: SHOP has a strong track record of beating revenue estimates for the last two years.
• Momentum: The stock is already up over 60% YTD and the RSI is high, showing strong buying interest.
• High Beta: The stock's beta is over 3.5. This thing is built to move on a catalyst.
You have a long-term technical break, a major sector rotation, and a huge earnings catalyst all hitting at the same time. This is a powerful combination. Watching this one very, very closely today.

$BTC Liquidity Spigot = RRP > TGA > FED BSThe RRP is tapped out.
The Fed Balance Sheet is irrelevant.
Now is time for the TGA to shine.
