500$ +40% DB RALLYA close above 372$ area to look for the move up on the weekly, likely catalyst earnings coming up on 9/11 analysts project revenue around $5.35 billion up 12% YoY and non-GAAP EPS of ~$4.50-$4.60 driven by Creative Cloud and Firefly AI adoption. Chart looks amazing to back it up, software is not dead and they're implementing a lot of AI to further their growth not to be put out of business by it. Daily has some trend resistance around 360 and 50 100 MA above that the neckline for double bottom at last local top of 420 will also need to be smashed, pretty much in the clear after that besides a back test, this will take a while to play out but there's a decent shot with all these software companies bottoming at the same time. NYSE:CRM NYSE:NOW NYSE:HUBS
ADBE has also bought back a record 12B in stock this year while it looks like there's a mix of hedge funds open/closing q1. Profitable, growing and lowest valuation in a decade, Firefly might be 29.99/ month but it's safe and makes money compared to some of its free competition, the earnings hopefully show a LARGE increase over expected for subscriptions or a major acquisition.
Growth

₿ BTCUSDT 1H TIMEFRAME🔍 Structure | Trend | Key Reaction Zones
Bitcoin is currently trading around 116,400 💹 after a sharp drop from the ATH region near 124,000. Price moved from bullish accumulation into consolidation and is now testing a potential breakdown or fake-down zone.
🧠 Market Overview:
🔻 Previous move: Accumulation → Breakout → Rally into ATH 🏔️
🔁 Current structure: Consolidation followed by breakdown pressure ⚡
🔼 Resistance: 117,293 → 118,132
📉 Support: 115,956 → 113,813 zone
🎯 Key Scenarios:
🔼 Bullish Continuation Possibility 🚀
If BTC reclaims 117,293–118,132,
then upside momentum could push toward 120,000+ liquidity.
🔻 Bearish Breakdown Possibility 📉
If price fails to hold above 115,956,
then deeper downside may open toward:
🔹 113,813
🔹 111,920 (major support)
📌 Current Levels to Watch:
Resistance: 117,293 → 118,132 → 120,000
Support: 115,956 → 113,813 → 111,920
⚠️ Disclaimer: This analysis is for educational and informational purposes only. It is not financial advice. Please conduct your own research before trading.

USDZAR - Forecast, Outlook and Market WatchHello fellow Market Watchers ☕
Today I'll take a top-view look at the USDZAR chart. And since I am in South Africa, this pair is of particular interest to me.
Now recently, the US introduced a 10% baseline tariff on most imports and lifted metals tariffs to 25%. Additionally, citrus, nuts, grapes and wine have been subjected to 30% duties since Aug. 7.
There is no doubt that in the short term, this will cause ripple effects throughout the economy but in the long run, South Africa will find new trading partners - this is how trade works. This will likely extend to Asian markets. The priority is to export more to China, where duty-free access has already been secured for five types of fruit (unsure which fruits these are).
South Africa will continue to strengthen ties with other countries to lessen reliance on the US for exports. Therefore, this is merely a short term hurdle.
From the monthly perspective, we see a clear peak. A double top marks the price where sellers are ready to dominate:
Although we've had two bearish micro-cycles (lasting just over two years and a year respectively), the multiyear trend has been bullish - almost "up only" since August 2011.
July US inflation cooled, so markets still expect the Fed to cut rates in September. Futures point to a strong chance of a 25 bps cut, and the dollar has lost some momentum. When rate-cut odds rise and inflation-adjusted US bond yields fall, higher-beta currencies like the rand often firm up.
However on a bullish note for the Rand, the South African Reserve Bank (SARB) cut the repo to 7.00% in July and said it aims at the bottom of the 3–6% target band, while June CPI printed 3.0%. This is optimistic news for the Rand, and further supports a decline on the chart.
What to watch next
• Fed path into September. Base case: a 25 bps cut.
• DXY (the US dollar index). Softer DXY tends to help ZAR.
• US real yields from the Treasury’s par real yield curve. Drifting lower is rand-friendly.
• Powell at Jackson Hole. A tougher tone on inflation could cap rand gains.
10 Year Treasury Inflation-Indexed Security - Lower US real yields usually lift demand for higher-yielding EM assets, leading to Rand strengthening.
DXY - A softer DXY = less broad USD strength, ZAR increases/strengthens
Gold and Platinum - If these increase, that supports SA's exports and likely helps the Rand considering the export volume. It should be noted that platinum gains will be limited by the new metal tariff at 25% if exporting to the US . In 2023, South Africa exported approximately $16.2 billion worth of platinum globally. Of this, about $3.42 billion went to the US. That works out to roughly 21% of South Africa’s total platinum exports being destined for the U.S.
I asked my friend GPT to put it in a table and got this helpful result:
So to summarize:
As of today (18 Aug 2025), markets still lean toward a Fed rate cut in September, with odds around the mid-80s, which has taken some heat out of the dollar and kept real Treasury yields anchored near ~1.9%—a mix that’s usually rand-friendly.
Locally, SARB’s July move left the repo at 7.00% while June CPI printed 3.0%, so South Africa still offers positive real carry. Firm gold prices and subdued equity volatility also help sentiment. The main offset is trade policy risk, with the new 30% US tariff on many South African imports clouding the export outlook and current account. Net-net, if US data stay calm into Jackson Hole, the bias tilts to a softer USD against ZAR.

Ripple's new patent US10902389B1Ripple's new patent, the correct number of which is US10902389B1 and titled Network computing system executing programmatic adapters to implement asynchronous communications, could help maintain the bullish trend in this cryptocurrency.

Bitcoin’s Power Law Curve — Fairly Valued With Room to RunThis chart applies a Power Law Rainbow Model to Bitcoin using a long-term logarithmic regression fitted to BTC's historical price action. Power laws are mathematical relationships often found in nature, science, and network systems — and Bitcoin is no exception.
Rather than relying on arbitrary trendlines, this model fits a curve based on the equation:
Price = a × t^b
Where:
t is the number of days since inception
a and b are constants optimized to Bitcoin's growth
Bands represent log-scaled standard deviation zones from the curve
🌈 Interpreting the Chart
The center white curve reflects Bitcoin's "fair value" according to its adoption-based trajectory.
Colored bands represent ±1σ, ±2σ, ±3σ from the model, creating a "valuation rainbow."
Historically, Bitcoin's cycle bottoms have touched the lower bands (blue/purple), while euphoria tops align with the upper bands (orange/red).
✅ Current Outlook
BTC is trading just under the fair value curve , suggesting it's fairly valued or slightly undervalued from a long-term perspective.
This position has historically preceded major upside moves, especially in post-halving environments.
From a Smart Money Concepts angle, we're in a potential accumulation or markup phase , with institutional and informed capital likely already positioning.
🧠 Why Power Laws Work for BTC
Bitcoin adoption follows network effects — more users = more value — which naturally follows a power law.
Unlike linear trends, power law curves scale with time , making them ideal for modeling exponential assets.
They offer a more objective long-term valuation framework , avoiding emotional cycle chasing.
⚠️ Disclaimer
This is not financial advice . The model reflects historical behavior and is a tool to support long-term perspective — not short-term prediction. Always do your own research and risk management.

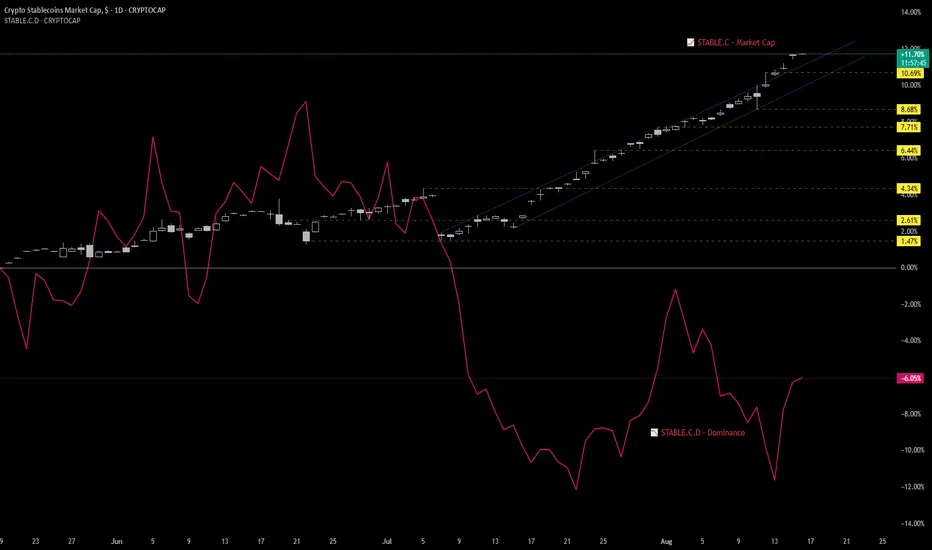
Stablecoins as the New Macro Liquidity ProxyFor years, macro liquidity in crypto was gauged through broad monetary metrics like M2 or Total Market Cap. But those days are fading.
With the rise of regulated stablecoins—and new TradingView tickers like CRYPTOCAP:STABLE.C (Stablecoin Market Cap) and CRYPTOCAP:STABLE.C.D (Stablecoin Dominance)—we now have real-time, on-chain liquidity metrics that better reflect how institutional and retail capital enters the crypto ecosystem.
🔑 Why These Tickers Matter
• STABLE.C = Capital injection.
→ Tracks aggregate growth of major stablecoins, serving as a proxy for dry powder entering the system.
• STABLE.C.D = Sentiment signal.
→ Measures stablecoin dominance relative to the crypto market.
→ Rising dominance = risk-off (capital parked).
→ Falling dominance = risk-on (capital deploying).
Together, they offer a macro lens on risk appetite and capital inflow , updated in real-time—something no traditional metric can match.
🔍 How We Use Them
These metrics are now integrated into our Crypto Macro Cockpit , where:
• Stablecoin cap growth signals liquidity expansion or contraction
• Dominance slope helps identify regime shifts (risk-on vs risk-off)
We're beginning to see consistent patterns:
➤ Surges in STABLE.C precede market rallies
➤ Spikes in STABLE.C.D often align with rotation tops or periods of caution
📎 Implication
Stablecoins are no longer just trading tools—they’re macro indicators.
If ETFs are the Trojan horse for institutional entry, stablecoins are the bloodstream.
As we transition into a new cycle, these tickers might become the most important charts you’re not watching.
💬 Would love to hear from others—are you using STABLE.C or STABLE.C.D in your analysis? What signals are you seeing?
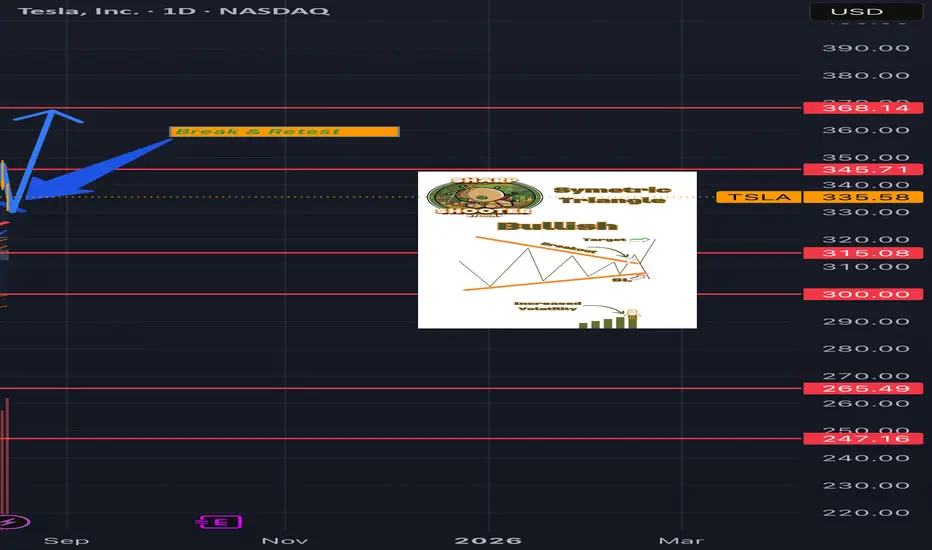
TSLA…..Triangle Breakout!!!TSLA "Tesla"
- Symmetric Triangle (Break & Retest)
- Big FSD update next month!!!
(Closest to FSD Unsupervised we've seen yet)
- Future sources of revenue undervalued (Energy, Robotics/Al, CyberCab)

TSLA……Triangle Breakout!!!TSLA “Tesla”
- Symmetric Triangle (Break & Retest)
- Big FSD update next month!!!
(Closest to FSD Unsupervised we’ve seen yet)
- Future sources of revenue undervalued
(Energy, Robotics/AI, CyberCab)
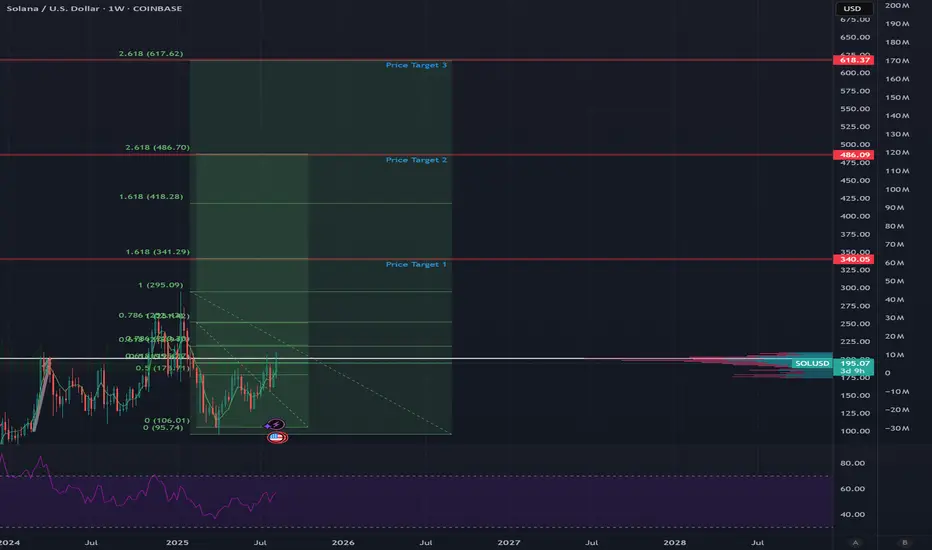
Hype is building, but is this market any different than perviousMany in they crypto community see the new ATH of BTC and know Alt season is a thing and coming. Maybe even here. In the past we have 4 year cycles based on what BTC does. ETH, SOL, and others are beginning to surge up as BTC hits new ATH. However be aware that the signs of a top are starting to show. With main stream news talking about new ATH and more influencers getting on board with got to buy now before New highs. We know the end of the bull market is near, or is it?
This is the first time laws and regulation have been opening friendly with crpytocurrency. More liquidity is about to be available to the market and more companies are indirectly getting exposure to the now more mainstream asset class. This market could easily surge very high with the bullish news. So the quesiton is, do we see the end of the bull cycle around October/November? Based on previous cycles we see cycles last and peak around 1000 days +/- a month or more. Do we see the bull cycle come to a massive correction again or do we see a small one and a more stable value over time?
No one will know and should be cautious with the growing buzz around the crypto asset. Short time I believe we will see some moderate to very high values followed by a correction of 30-80% for non blue coins or at least anything not in the top 25 assets. I believe massive profits will be taken but there is a good chance with a crypto friendly US government we could see more stability in the prices.
Not finacial advice just thoughts on the current sentiment of the market.
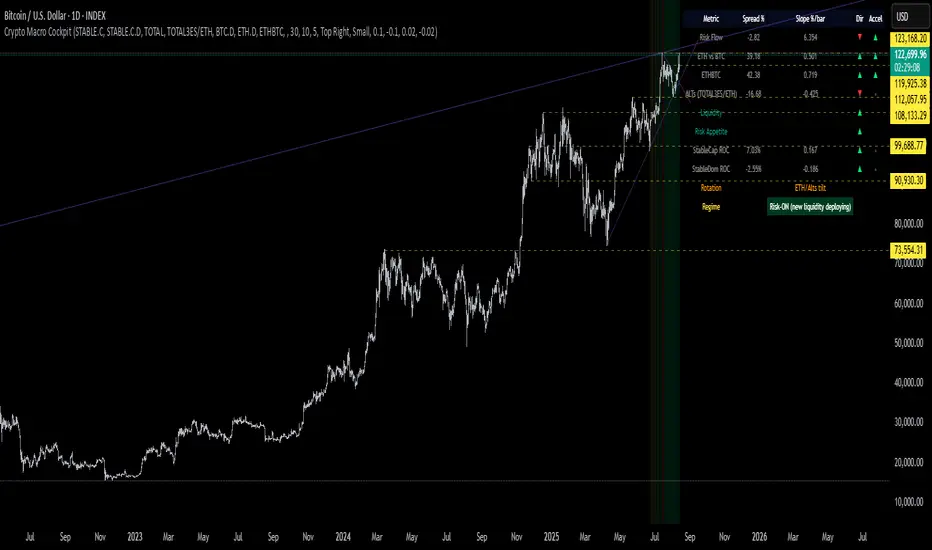
Crypto Macro Cockpit: Risk-ON Regime ConfirmedThis chart presents a live macro overlay for crypto markets using the new Crypto Macro Cockpit, a Pine Script-based dashboard that blends traditional flow metrics with institutional-era proxies.
We're currently reading a Risk-ON regime as fresh liquidity deploys into the system—confirmed across stablecoin metrics and sector rotation.
🔍 Key Insights
Risk Flow: Stablecoin cap is rising slower than total market cap → suggests active deployment (Risk-ON)
Liquidity Context: StableCap ROC at +7%, confirming real dry powder growth
Rotation: ETH vs BTC and ETHBTC both accelerating upward → ETH/Alts tilt
TOTAL3ES/ETH ratio: Softening short-term → confirms engineered altseason with ETH as the core liquidity channel
Macro Regime: Risk-ON (new liquidity deploying)
🧠 Thesis
This aligns with the Trojan Cycle thesis:
Institutional liquidity enters through safe, regulated channels (e.g. stablecoins), while synthetic altseasons are engineered to engage and extract liquidity from retail participants.
Legacy macro tools like M2 are no longer as effective. In today’s structure, stablecoin metrics offer real-time, blockchain-native liquidity signals.
- Stablecoin Market Cap reflects actual capital inflow (dry powder entering)
- Stablecoin Dominance proxies sentiment: declining = risk-on, rising = risk-off
- Their spread vs Total Market Cap reveals whether capital is being deployed or parked
As institutions and ETFs reshape market dynamics, this cockpit adapts.
M2 is out. Stablecoins are in.
⚠️ Disclaimer
This is not financial advice.
This script and dashboard are informational tools meant to support macro-level context and regime awareness—not trade signals.
Always do your own research.
Evolent Health | EVH | Long at $9.45While 2025 is expected, and has been, a bad year for Evolent Heath NYSE:EVH , the growth prospects look very, very promising. However, I will caution that the price could almost be cut in half from its current trading value ($9.45) with another poor earnings in 2025. This definitely isn't an "it's only up from here" stock. The price entered my "crash" simple moving area (green lines) twice and a third time could occur before the end of the year ($4-$5 range as of this writeup).
Regardless of bottom predictions, earnings for NYSE:EVH are expected to rise from $1.9 billion in 2025 to $3.2 billion in 2028. EPS predicted to rise from $0.26 in 2025 to $1.18 in 2028. Debt-to-equity = 1.2x (okay, below 1 is best), Quick Ratio, or the ability to pays current bills is = 1x (okay, between 1.5 and 3 is best), and bankruptcy risk is relatively high (but reduced interest rates may help). Insiders have purchased over $11 million in shares this year with a cost average (~$23): much higher than it's current trading price.
So, while it seems there could be some short-term risks for Evolent Health, the future beyond 2025 is bright (based on company projections). Thus, at $9.45, NYSE:EVH is in a personal buy zone with potential downside risk near $4-5 in the near-term.
Targets into 2028:
$15.00 (+58.7%)
$20.00 (+111.6%)

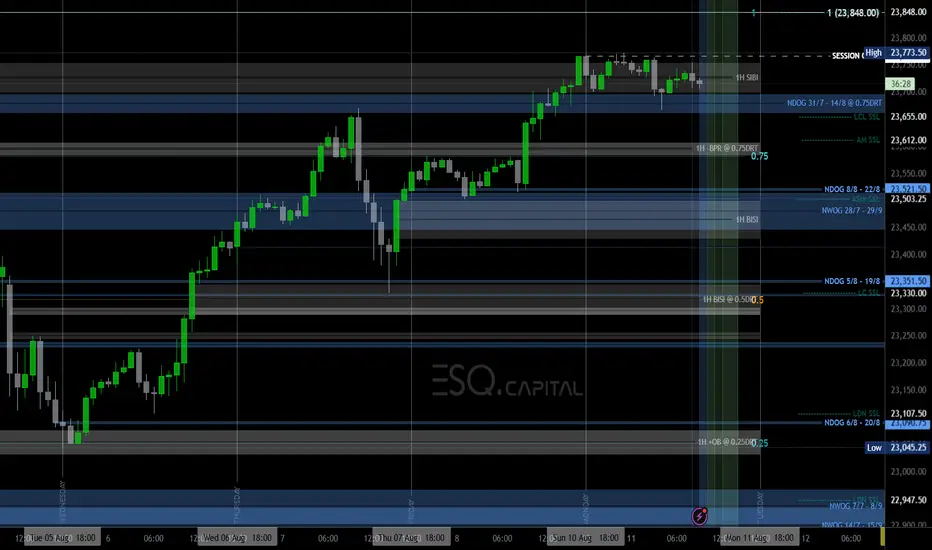
MNQ INTRADAY - COULD WE SEE PRICE AT 23,450 AGAINAt the time of this Idea - Before the Opening Bell on Monday 11th August 2025, CME_MINI:MNQU2025 appears to be respecting the Premium-High it finds itself in.
This could mean that price may MOVE OUT of a buyside-program where higher highs are achieved, as buyside liquidity is sought, and into a sell-side program where discount areas of interest are engaged and a descent in price occurs.
Could we see CME_MINI:MNQU2025 reach down towards 23,450 during this trading session, or will tomorrow's pending core inflation figures cause today's price action to stall in anticipation of the release of the reports?
Also look out for U.S. trade tariff related developments that may pull up any surprises.
Profitable trading guys!
PLTR 1D — When the tea is brewed and the handle’s in placePalantir’s daily chart is shaping up a textbook cup with handle pattern — one of the most reliable continuation setups in technical analysis. The cup base was formed over several months and transitioned into a consolidation phase, building a rectangle structure where smart money likely accumulated positions before a breakout.
Now here’s the key: price has not only broken out — it’s settled above all major moving averages, including EMA 20/50/100/200 and MA 50/200. The breakout candle was supported by surging volume, signaling strong participation from institutional buyers. When all the averages start bending upwards, it's usually not by accident.
The breakout above the $121 resistance zone unlocked a pathway toward a target at $187 , derived by projecting the height of the cup upward from the breakout level. This kind of structure, once confirmed, often fuels aggressive continuation — and this one’s got the setup locked in.
From a fundamental perspective, Palantir is holding solid ground: strong earnings reports, expanding government and commercial contracts, and aggressive development in AI services. Institutional interest is rising steadily, and that momentum is visibly reflected in price action.
To sum it up: price has launched cleanly out of the consolidation zone, pierced all critical MAs and EMAs, and continues to gain momentum. While the market sips its tea, this cup is boiling hot. Just don’t forget your stop loss — this is a trading desk, not a tea party.
If you enjoy posts like this, drop a like, share it around, and let’s hear your thoughts below. It keeps ideas moving and the content flowing — free, sharp, and relevant.

ICPUSD on Buying ZoneInternet Computer Protocol, a giant sleept, has a big potential to up + 1000% , but being objective, right now is probably that go down little bit more before the big up .
The best long oportunity would be at 4.340 - 3.385 USD but is probably that never going there, because we are on the buying zone . The real target is on 40-50 USD per crypto
But actually, ICP has the potential to be a top 3 markep cap crypto

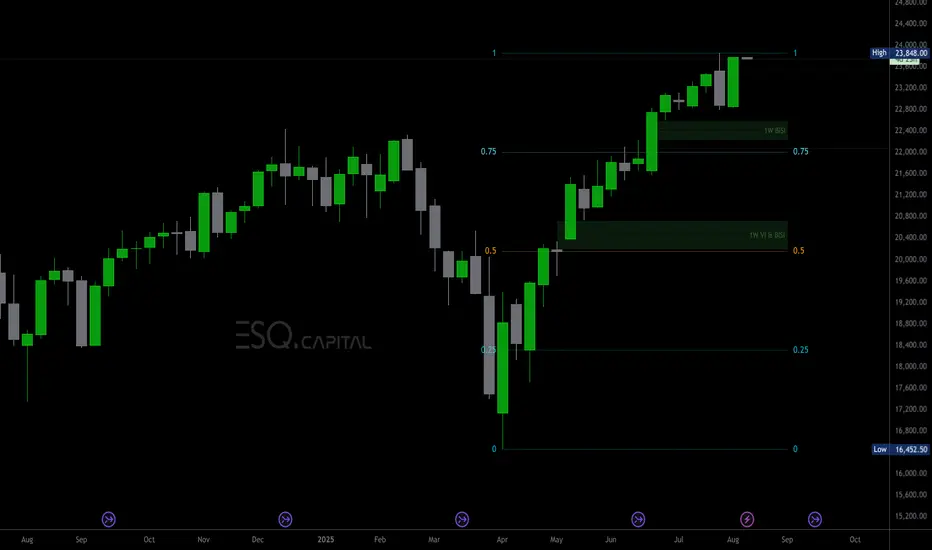
MNQ SET TO MAKE MORE NEW HIGHS, BEWARE OF THE STRONG PULLBACKSWe are very likely to witness CME_MINI:MNQU2025 (and of course NQ) reaching for new highs in the not too distant future.
However it is wise to bare in mind that price having made a high in the previous week of may experience a deep retracement into an area of weekly price inefficiency:
This general area sits nicely above the lower end of the Premium-High of the current weekly Dealing Range (0.75 DRT).
It is also feasible to expect price to revisit the Equilibrium of the current weekly Dealing Range (0.5DRT) as depicted in the chart at a general area of over the next month or so before seeing sustainable new highs being achieved.
Lets keep a keen look out for the release of this week's economic reports (especially inflation related) that may help drive price lower in the short term before we see it achieve a season of further new highs.
Figs Inc | FIGS | Long at $5.24Figs Inc $NYSE:FIGS. Technical analysis play first, fundamentals second.
My selected historical simple moving average lines have converged with the stock price, which often leads to sideways trading and a reversal in the downward trend (i.e. future price increase). The downward trend is flattening, but that doesn't mean post-earnings drop to $1.50-$2.00 isn't out of the question...
The FIGS brand is growing within the healthcare world with significant opportunities overseas. While economic headwinds may impede near/medium-term growth, revenue is anticipated to grow into 2027. EPS is expected to rise from 0.01 in 2024 to 0.20 by 2027. While this is not a "value" play and there is high risk for rug pulls, something may be brewing within the chart for a move up. Tread lightly, however...
Targets
$6.00
$6.40
$7.00
$8.00

Sabre Corporation (Revised) | SABR | Long at $1.76This is a revised analysis of Sabre Corp NASDAQ:SABR as seen here
-------
Full disclosure: I am still a holder of shares at $2.06 and newest entry at $1.76. My stop was triggered near $3.00 (original entry) a few days ago. If the price rises above $2.06, I plan to sell out of that entry a keep my lowest position moving forward.
This is a ***highly risky*** trade given the recent news around slower earnings growth and slump in travel demand in certain areas the company caters to. Do your own due diligence.
-------
NASDAQ:SABR stock took a major hit today after the company reported revenue growth below its projections in Q2 2025. Revenue was $687 million, down 1% year-on-year, missing the company's own guidance of "low single-digit" growth. They also significantly lowered full-year guidance for 2025, expecting Air Distribution Volumes to grow between 4-10% and full-year Adjusted EBITDA between $530-$570 million, down from previous projections. The company's higher exposure to corporate and government travel, including a decline in U.S. government and military travel, negatively impacted its performance.
From a technical analysis perspective, the price dropped today to an area 6 standard deviations away from the historical simple moving average zone (which rests now at $1.69 - blue line). While there may be a dead-cat bounce then further drop to near $1.00, the stock is behaving as expected given the bad news. However, a drop in interest rates will significantly benefit this company's debt burden. NASDAQ:SABR consistently ranks as one of the top players in the global travel technology landscape, so while I think the future is bright for the company given earnings projections (beyond 2025) and analyst estimates, 2025 will absolutely be a tough year.
So, at $1.76, I am buying the fear. Last entry near $1 if it gets there and the overall fundamentals do not change. Whatever my lowest entry is, I will be holding that and selling all previous entries near even to limit exposure.
Revised Targets into 2028:
$2.20 (+25.0%)
$2.90 (+64.8%)

OSCR - When in Doubt, Zoom out.When in doubt, Zoom out. Here we are at the current low point of NYSE:OSCR . As long as this holds which hopefully will, as it holds alot of weight to it, we have only UP from here. Holding alot of Cash, maintaining & raising Guidance marginally are clearly good signs.
What we have to take into account is that the Healthcare Sector as a whole has negative Sentiment, this will eventually change soon. Once it breaks the Green Line, the next resistance is at 26-28.
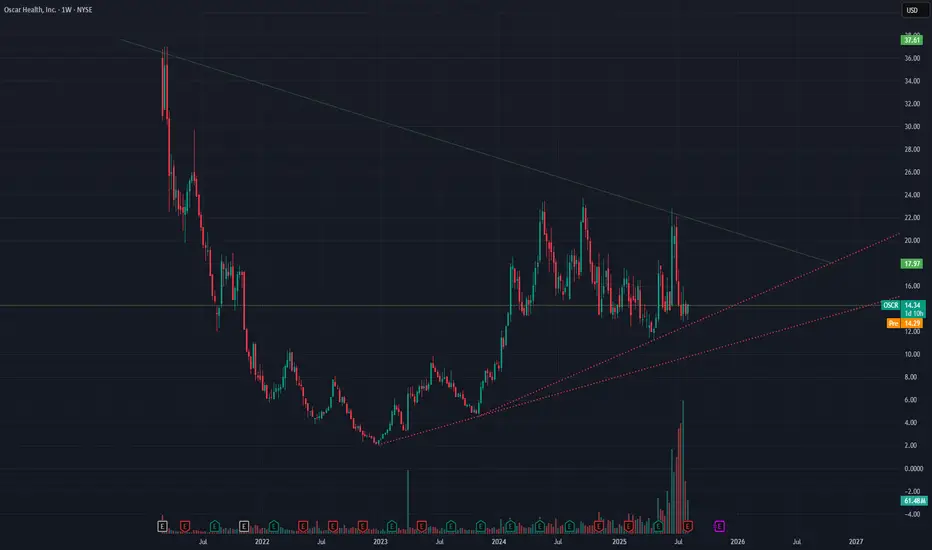
BTC Top NFA, DYOR.
Food for Thought: Rate Cut - Geopolitical Tension - BTC is up how much from the bottom? - Coinbase App Store - Retail hopping on Solana.
Enjoy.

LTC Adoption CurveThere was adoptions like this: TV, color TV, refrigerator, phone, mobile phone, pc. Now it's time for crypto. It's 7% today, summer 2025.

Bumble | BMBL | Long at $8.34Arguably, Bumble NASDAQ:BMBL , Match NASDAQ:MTCH , and Grindr NYSE:GRND have an enormous amount of *highly* valuable data on its past and current users. Like any industry, it often simply takes time for this recognition by market makers to occur before price aligns with the "true" future value. If you are an AGI company looking to enhance user companionship with machines and AI bots, these companies hold the keys.
NASDAQ:BMBL has low debt, paying users are still growing (caution if recession begins), and revenue is rising. Personally, the value is in the company's data.
From a technical analysis perspective, my historical simple moving average lines are working their way toward the price. Often, this means a rise in price as the lines flatten and then inevitably rise with the trend reversal. However, I would not be surprised if there were some shakeouts in the near-term if the price suddenly dropped near $5 post-earnings, etc. Regardless, it will personally likely be an opportunity to gather more shares. Thus, at $8.34, NASDAQ:BMBL is in a personal buy-zone.
Target #1 = $12.00
Target #2 = $15.00
Target #3 = $22.00

Agilon Health (Revised) | AGL | Long at $0.76This is a revised analysis of Agilon Health NYSE:AGL as seen here:
-------
Full disclosure: I am a holder of shares at $2.36, $0.76, and $0.79. Last entry planned near $0.50 if it reaches that level. Current cost average is near $1.11.
Let me be clear: This is a ***highly risky*** trade given the recent news regarding the CEO, securities fraud investigation, suspension of FY guidance. Do your own due diligence.
-------
The link above/previous writeup details some of the basic fundamentals of Agilon Health NYSE:AGL . As predicted, the price fell below $1 after the most recent earnings call. This was due to:
Revenue down 6% to $1.4B, Medicare Advantage membership at 498,000.
CEO Steve Sell resigning, Ron Williams appointed Executive Chairman.
2025 guidance suspended due to market challenges.
New securities fraud investigations.
I think the challenges NYSE:AGL is going through will extend through 2025 in into early 2026. If you look at the healthcare sector, it has taken a beating mostly due to Medicare and Medicaid cuts / rising healthcare costs. NYSE:AGL is not profitable and wasn't expected to become profitable until 2028 - but that may get revised....
However, the company focuses on senior patients, primarily through Medicare Advantage and ACO REACH programs, targeting value-based care for older adults across 31+ communities in 12 states. The need for services targeting the Baby Boom population is going to rapidly increase in the next few years. NYSE:AGL may become a leader in this area, but the company needs to regroup and focus on a model that returns money to investors - a dirty game. So, while the near-term is doom and gloom, the future could be very, very bright with NYSE:AGL if they are able to turn things around with this new leadership shakeup. Time will tell. It's a gamble. One I am, personally, willing to take.
Revised Targets into 2028:
$1.60 (+110.5%)
$3.00 (+294.7%)

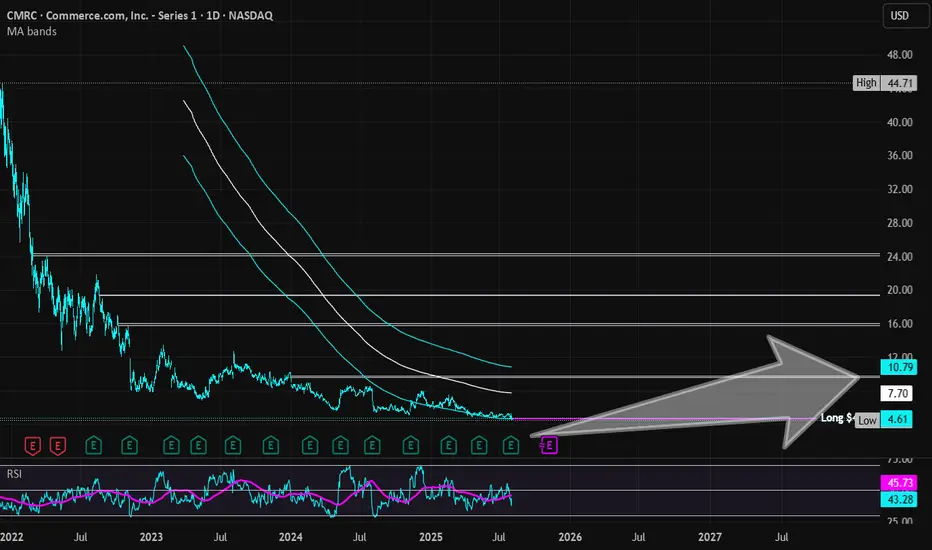
Commerce.com | CMRC | Long at $4.68BigCommerce recently rebranded to Commerce.com NASDAQ:CMRC . Full disclosure: I am an initial stockholder at $7.15, but grabbing more shares below $5 - average current holding is $5.68.
During the most recent earnings call for NASDAQ:CMRC , the company announced AI-driven partnerships with Google Cloud (Gemini) and PROS Holdings to enhance product discovery and pricing. They are now focused on "agentic commerce" (a new paradigm in online shopping where AI-powered agents autonomously handle the entire shopping process, from product discovery to purchase, on behalf of users) and B2B growth (Quick Start Accelerator program). The shift of this company focusing away from standard shopping experiences to new AI-powered ones is a major catalyst for me believing this company can grow significantly. Companies like NASDAQ:URBN , NYSE:TPR , NYSE:DELL , NYSE:VFC use NASDAQ:CMRC and others will surely hop on board if the AI shopping enhances consumer experiences.
However, the economy is VERY shaky right now and consumers are spending less. There is a chance the growth outlook for NASDAQ:CMRC (4.6% annual revenue growth through 2028) may not occur. Thus, this is a **highly speculative** investment. I would not be surprised if the economy flips and this tanks to near or below $1 in the near-term. With that in-mind, this is a long-term position build for me until targets are hit. If I have to hold for years, I am okay with that as long as the major fundamentals do not change. Those without thick skin should stay away...
From a technical analysis perspective, the price has entered and is riding my historical simple moving average area. This usually signifies the accumulation phase of a stock cycle and is what I will be doing - which is why I am adding shares at $4.68.
Targets into 2028:
$7.00 (+49.6%)
$9.50 (+103.0%)