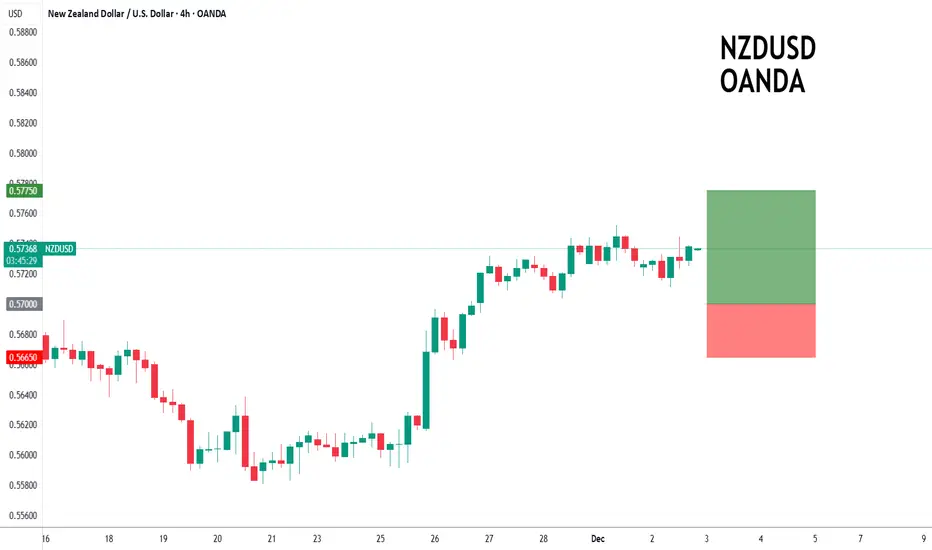
NZDUSD to continue in the upward move?NZDUSD - 24h expiry
There is no clear indication that the upward move is coming to an end.
Although we remain bullish overall, a correction is possible with plenty of room to move lower without impacting the trend higher.
Risk/Reward would be poor to call a buy from current levels.
A move through 0.5750 will confirm the bullish momentum.
The measured move target is 0.5800.
We look to Buy at 0.5700 (stop at 0.5665)
Our profit targets will be 0.5775 and 0.5800
Resistance: 0.5750 / 0.5775 / 0.5800
Support: 0.5725 / 0.5700 / 0.5675
Risk Disclaimer
The trade ideas beyond this page are for informational purposes only and do not constitute investment advice or a solicitation to trade. This information is provided by Signal Centre, a third-party unaffiliated with OANDA, and is intended for general circulation only. OANDA does not guarantee the accuracy of this information and assumes no responsibilities for the information provided by the third party. The information does not take into account the specific investment objectives, financial situation, or particular needs of any particular person. You should take into account your specific investment objectives, financial situation, and particular needs before making a commitment to trade, including seeking, under a separate engagement, as you deem fit.
You accept that you assume all risks in independently viewing the contents and selecting a chosen strategy.
Where the research is distributed in Singapore to a person who is not an Accredited Investor, Expert Investor or an Institutional Investor, Oanda Asia Pacific Pte Ltd (“OAP“) accepts legal responsibility for the contents of the report to such persons only to the extent required by law. Singapore customers should contact OAP at 6579 8289 for matters arising from, or in connection with, the information/research distributed.
H-setup
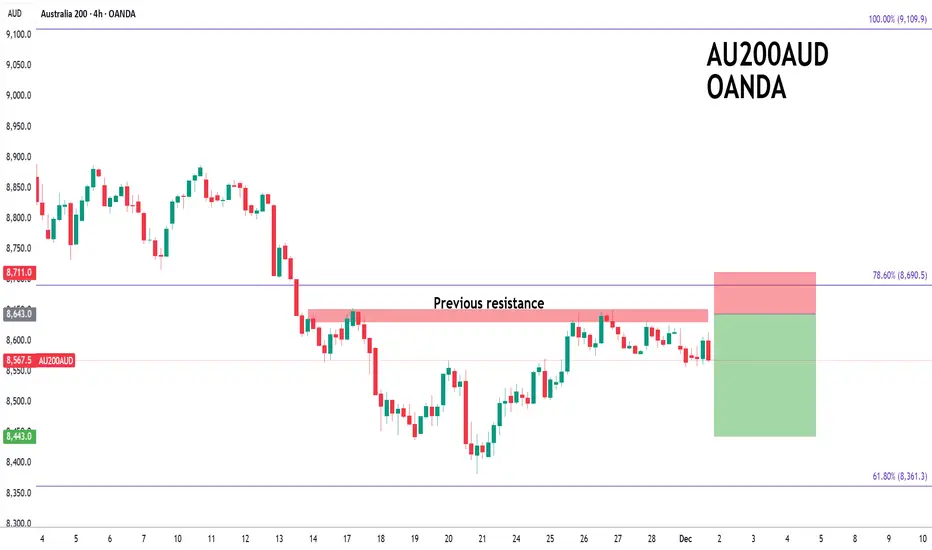
ASX200 to continue in the downward move?AU200AUD - 24h expiry
8649 has been pivotal.
20 1day EMA is at 8657.
Daily signals are bullish.
Our short term bias remains negative.
Price action continued to range between key support & resistance (8560 - 8640) although we expect a break of this range soon.
We look to Sell at 8643 (stop at 8711)
Our profit targets will be 8443 and 8403
Resistance: 8620 / 8649 / 8700
Support: 8556 / 8500 / 8410
Risk Disclaimer
The trade ideas beyond this page are for informational purposes only and do not constitute investment advice or a solicitation to trade. This information is provided by Signal Centre, a third-party unaffiliated with OANDA, and is intended for general circulation only. OANDA does not guarantee the accuracy of this information and assumes no responsibilities for the information provided by the third party. The information does not take into account the specific investment objectives, financial situation, or particular needs of any particular person. You should take into account your specific investment objectives, financial situation, and particular needs before making a commitment to trade, including seeking, under a separate engagement, as you deem fit.
You accept that you assume all risks in independently viewing the contents and selecting a chosen strategy.
Where the research is distributed in Singapore to a person who is not an Accredited Investor, Expert Investor or an Institutional Investor, Oanda Asia Pacific Pte Ltd (“OAP“) accepts legal responsibility for the contents of the report to such persons only to the extent required by law. Singapore customers should contact OAP at 6579 8289 for matters arising from, or in connection with, the information/research distributed.
Review and plan for 1st December 2025 Nifty future and banknifty future analysis and intraday plan.
Stock analysis- KAYNES
This video is for information/education purpose only. you are 100% responsible for any actions you take by reading/viewing this post.
please consult your financial advisor before taking any action.
----Vinaykumar hiremath, CMT

NZDJPY to continue in the rally?NZDJPY - 24h expiry
There is no clear indication that the upward move is coming to an end.
Offers ample risk/reward to buy at the market.
15min EMA is at 89.45.
Our outlook is bullish.
Our bespoke resistance of 89 has been clearly broken.
We look to Buy at 89.45 (stop at 89.05)
Our profit targets will be 90.65 and 90.95
Resistance: 89.56 / 90.00 / 90.50
Support: 89.00 / 88.65 / 88.40
Risk Disclaimer
The trade ideas beyond this page are for informational purposes only and do not constitute investment advice or a solicitation to trade. This information is provided by Signal Centre, a third-party unaffiliated with OANDA, and is intended for general circulation only. OANDA does not guarantee the accuracy of this information and assumes no responsibilities for the information provided by the third party. The information does not take into account the specific investment objectives, financial situation, or particular needs of any particular person. You should take into account your specific investment objectives, financial situation, and particular needs before making a commitment to trade, including seeking, under a separate engagement, as you deem fit.
You accept that you assume all risks in independently viewing the contents and selecting a chosen strategy.
Where the research is distributed in Singapore to a person who is not an Accredited Investor, Expert Investor or an Institutional Investor, Oanda Asia Pacific Pte Ltd (“OAP“) accepts legal responsibility for the contents of the report to such persons only to the extent required by law. Singapore customers should contact OAP at 6579 8289 for matters arising from, or in connection with, the information/research distributed.

XRP/USDT Analysis. Long Setup
XRP shows weak selling pressure, while cumulative delta is rising on the entire decline, indicating background buying activity.
We expect a test of the $2.17–$2.154 buy zone. If a reaction appears, we consider a long position toward the nearest local high.
This publication is not financial advice.

ASX200 to find buyers at previous support?AU200AUD - 24h expiry
Although the bears are in control, the stalling negative momentum indicates a turnaround is possible.
Short term oscillators have turned positive.
Previous support located at 8570.
50 4hour EMA is at 8572.
Dip buying offers good risk/reward.
We look to Buy at 8571 (stop at 8499)
Our profit targets will be 8771 and 8791
Resistance: 8653 / 8700 / 8750
Support: 8574 / 8500 / 8447
Risk Disclaimer
The trade ideas beyond this page are for informational purposes only and do not constitute investment advice or a solicitation to trade. This information is provided by Signal Centre, a third-party unaffiliated with OANDA, and is intended for general circulation only. OANDA does not guarantee the accuracy of this information and assumes no responsibilities for the information provided by the third party. The information does not take into account the specific investment objectives, financial situation, or particular needs of any particular person. You should take into account your specific investment objectives, financial situation, and particular needs before making a commitment to trade, including seeking, under a separate engagement, as you deem fit.
You accept that you assume all risks in independently viewing the contents and selecting a chosen strategy.
Where the research is distributed in Singapore to a person who is not an Accredited Investor, Expert Investor or an Institutional Investor, Oanda Asia Pacific Pte Ltd (“OAP“) accepts legal responsibility for the contents of the report to such persons only to the extent required by law. Singapore customers should contact OAP at 6579 8289 for matters arising from, or in connection with, the information/research distributed.

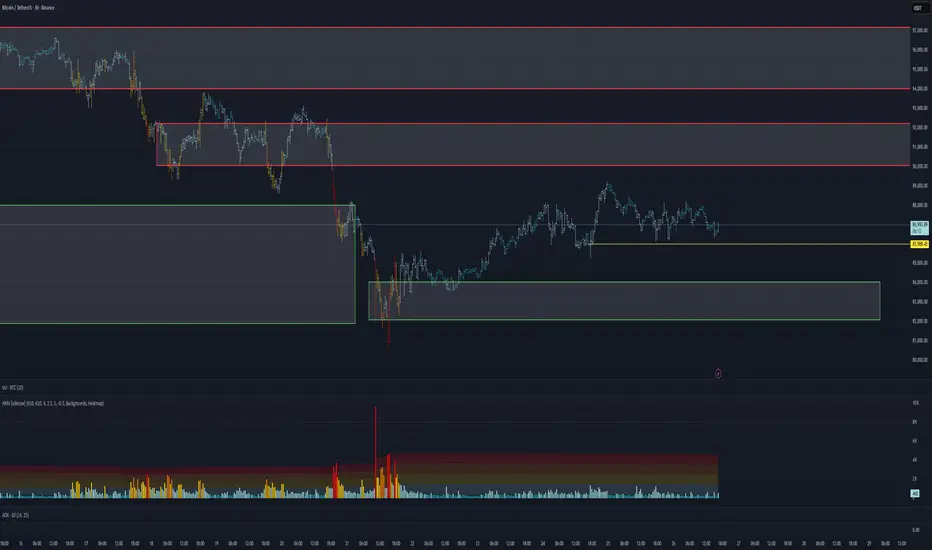
BTC/USDT Analysis. Local Long Setup
Hello everyone! CryptoRobotics trader-analyst here, and this is your daily market update.
Since yesterday, Bitcoin has failed to break above the $88,000 level mentioned in the previous analysis, resulting in continued consolidation within a narrow range.
When analyzing this local range, we see dominant selling pressure on cumulative delta, but it has not produced any meaningful downside result — sellers are active, yet unable to push the price lower. Additionally, a notable delta anomaly has formed around $86,000, suggesting the presence of a limit buyer.
A local long setup becomes valid if liquidity is swept below the local lows followed by a test of $86,000, with a stop-loss below $85,200. The upside potential is attractive — the next resistance zone we highlighted earlier becomes the primary target.
If no reaction appears at $86,000 and buyers fail to step in, we expect further downside movement toward a stronger support zone below.
Buying Zones:
• $86,000 (local selling absorption)
• $84,000–$82,000 (volume anomalies)
Selling Zones:
• $90,000–$92,300 (high-volume zone)
• $94,000–$97,500 (high-volume zone)
• $101,000–$104,000 (accumulated volume)
• $105,800–$106,600 (local resistance)
This publication is not financial advice.
TLT - A long-term outlookIf price is moving up, we look for support structure, which in this case is a Real Swing Low (RSL).
An RSL is confirmed when the most recent Real Swing High (RSH) is broken.
What we’re seeing here is the beginning of a stair-step move to the upside, including short-term support.
Even the CIB has been broken, which suggests that a shift in market behavior is underway.
Our statistical probability of hitting the centerline is roughly 80%. That implies we can look for a longer-term play in TLT.
However, keep a close eye on the 1/4 line. It isn’t exactly friendly, as the rejections we’ve seen so far make clear.
I probably go with ITM LEAP options with a
Delta of around 70–80 and a over 120 DTE.
Happy profits, and for those in the U.S., wishing you a happy Thanksgiving.

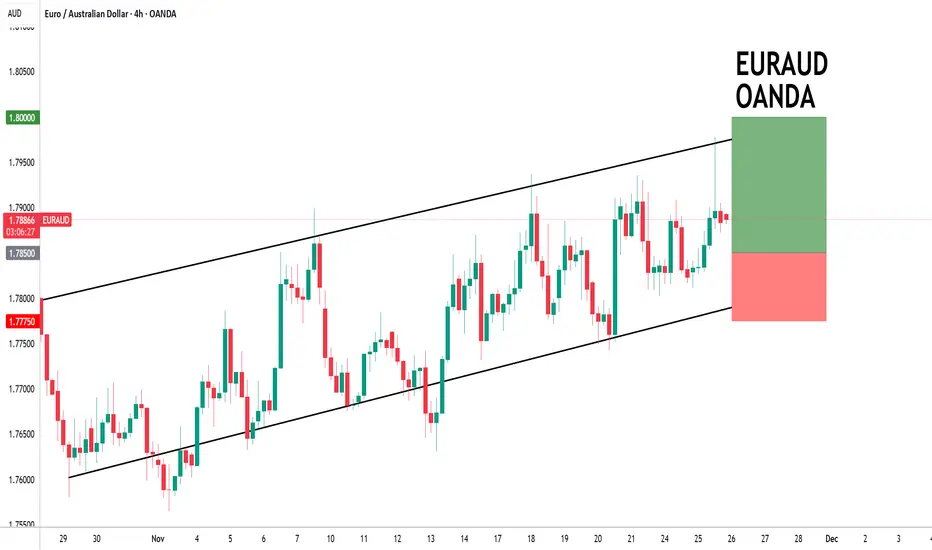
EURAUD to continue in the upward channel?EURAUD - 24h expiry
Indecisive price action has resulted in sideways congestion on the intraday chart.
Pivot support is at 1.7700.
Risk/Reward would be poor to call a buy from current levels.
A move through 1.7900 will confirm the bullish momentum.
The measured move target is 1.8025.
Our profit targets will be 1.8000 and 1.8025
Resistance: 1.7900 / 1.7950 / 1.8000
Support: 1.7850 / 1.7800 / 1.7775
Risk Disclaimer
The trade ideas beyond this page are for informational purposes only and do not constitute investment advice or a solicitation to trade. This information is provided by Signal Centre, a third-party unaffiliated with OANDA, and is intended for general circulation only. OANDA does not guarantee the accuracy of this information and assumes no responsibilities for the information provided by the third party. The information does not take into account the specific investment objectives, financial situation, or particular needs of any particular person. You should take into account your specific investment objectives, financial situation, and particular needs before making a commitment to trade, including seeking, under a separate engagement, as you deem fit.
You accept that you assume all risks in independently viewing the contents and selecting a chosen strategy.
Where the research is distributed in Singapore to a person who is not an Accredited Investor, Expert Investor or an Institutional Investor, Oanda Asia Pacific Pte Ltd (“OAP“) accepts legal responsibility for the contents of the report to such persons only to the extent required by law. Singapore customers should contact OAP at 6579 8289 for matters arising from, or in connection with, the information/research distributed.
GBPAUD forming a top?GBPAUD - 24h expiry
Posted a Double Top formation.
A Doji style candle has been posted from the high.
The bearish engulfing candle on the 4 hour chart is negative for sentiment.
50 1day EMA is at 2.0338.
Offers ample risk/reward to sell at the market.
We look to Sell at 2.0315 (stop at 2.0388)
Our profit targets will be 2.0095 and 2.0045
Resistance: 2.0327 / 2.0366 / 2.0400
Support: 2.0253 / 2.0200 / 2.0116
Risk Disclaimer
The trade ideas beyond this page are for informational purposes only and do not constitute investment advice or a solicitation to trade. This information is provided by Signal Centre, a third-party unaffiliated with OANDA, and is intended for general circulation only. OANDA does not guarantee the accuracy of this information and assumes no responsibilities for the information provided by the third party. The information does not take into account the specific investment objectives, financial situation, or particular needs of any particular person. You should take into account your specific investment objectives, financial situation, and particular needs before making a commitment to trade, including seeking, under a separate engagement, as you deem fit.
You accept that you assume all risks in independently viewing the contents and selecting a chosen strategy.
Where the research is distributed in Singapore to a person who is not an Accredited Investor, Expert Investor or an Institutional Investor, Oanda Asia Pacific Pte Ltd (“OAP“) accepts legal responsibility for the contents of the report to such persons only to the extent required by law. Singapore customers should contact OAP at 6579 8289 for matters arising from, or in connection with, the information/research distributed.

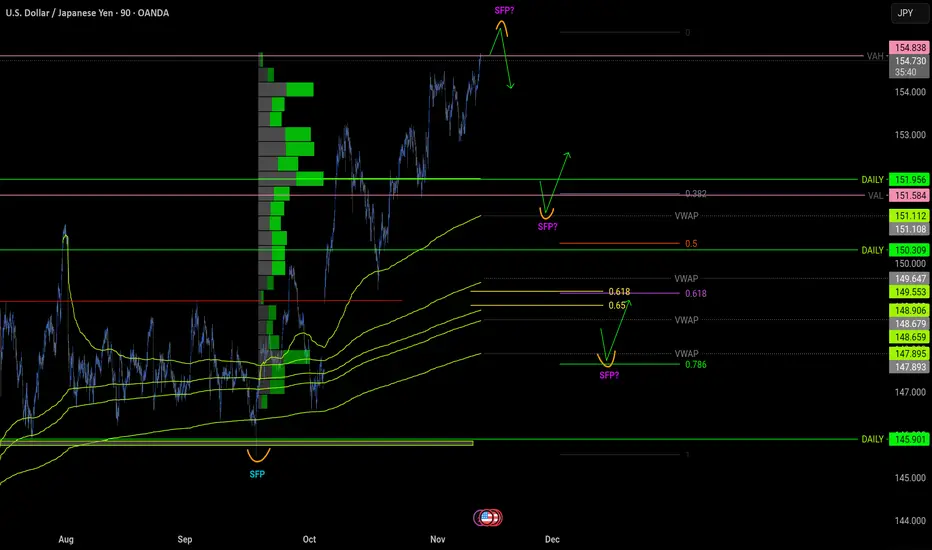
USDJPY idea 12.11.2025I'm primarily following two scenarios in this market: a short position would be possible when the SFP is above the value high. I would like the nearest long when the price drops somewhere around 151.2, where there is a nice confluence. The 0.382 fibo value low level and the daily level are converging. I would like another potential long only after the gap is filled.
If Nasdaq can crack the pressure line then...🔱 We have a Hagopian on the down-move. 🔱
Price was (so far) not able to reach the L-MLH of the red fork.
If buyers can eat through the pressure cheese, then the Long-Play is on.
Most often we see price breaking the pressure line and then coming back to it, scaring out the early longs, just to rush upwards again. So don’t panic if this happens. Place a proper stop and you're good.
As for targets, there is the red Centerline and the white Centerline.
On a break of the red CL, we have a high chance to see the same scenario as with the pressure line: UP-Down-MoreUp.
First snow in Switzerland arrived and Santa is preparing the reindeer to bring us some dough ;-)
Wish you all a profitable Friday.

AU200 to find buyers at 61.8% pullback?AU200AUD - 24h expiry
Early pessimism is likely to lead to losses although extended attempts lower are expected to fail.
Trading volume is increasing.
We look for a temporary move lower.
We have a 61.8% Fibonacci pullback level of 8362 from 7151 to 9110.
Dip buying offers good risk/reward.
We look to Buy at 8365 (stop at 8265)
Our profit targets will be 8665 and 8715
Resistance: 8519 / 8580 / 8653
Support: 8437 / 8400 / 8362
Risk Disclaimer
The trade ideas beyond this page are for informational purposes only and do not constitute investment advice or a solicitation to trade. This information is provided by Signal Centre, a third-party unaffiliated with OANDA, and is intended for general circulation only. OANDA does not guarantee the accuracy of this information and assumes no responsibilities for the information provided by the third party. The information does not take into account the specific investment objectives, financial situation, or particular needs of any particular person. You should take into account your specific investment objectives, financial situation, and particular needs before making a commitment to trade, including seeking, under a separate engagement, as you deem fit.
You accept that you assume all risks in independently viewing the contents and selecting a chosen strategy.
Where the research is distributed in Singapore to a person who is not an Accredited Investor, Expert Investor or an Institutional Investor, Oanda Asia Pacific Pte Ltd (“OAP“) accepts legal responsibility for the contents of the report to such persons only to the extent required by law. Singapore customers should contact OAP at 6579 8289 for matters arising from, or in connection with, the information/research distributed.

NZDUSD to continue in the downward move?NZDUSD - 24h expiry - We look to Sell at 0.5625 (stop at 0.5650)
There is no clear indication that the downward move is coming to an end.
Although we remain bearish overall, a correction is possible without impacting the trend lower.
Risk/Reward would be poor to call a sell from current levels.
A move through 0.5600 will confirm the bearish momentum.
The measured move target is 0.5550.
Our profit targets will be 0.5575 and 0.5550
Resistance: 0.5625 / 0.5650 / 0.5675
Support: 0.5600 / 0.5575 / 0.5550
Risk Disclaimer
The trade ideas beyond this page are for informational purposes only and do not constitute investment advice or a solicitation to trade. This information is provided by Signal Centre, a third-party unaffiliated with OANDA, and is intended for general circulation only. OANDA does not guarantee the accuracy of this information and assumes no responsibilities for the information provided by the third party. The information does not take into account the specific investment objectives, financial situation, or particular needs of any particular person. You should take into account your specific investment objectives, financial situation, and particular needs before making a commitment to trade, including seeking, under a separate engagement, as you deem fit.
You accept that you assume all risks in independently viewing the contents and selecting a chosen strategy.
Where the research is distributed in Singapore to a person who is not an Accredited Investor, Expert Investor or an Institutional Investor, Oanda Asia Pacific Pte Ltd (“OAP“) accepts legal responsibility for the contents of the report to such persons only to the extent required by law. Singapore customers should contact OAP at 6579 8289 for matters arising from, or in connection with, the information/research distributed.

GBPAUD has formed a double top.GBPAUD - 24h expiry
Posted a Double Top formation.
We look for a temporary move higher.
The bearish engulfing candle on the 4 hour chart is negative for sentiment.
The overnight rally has been sold into and there is scope for further bearish pressure going into this morning.
Risk/Reward would be poor to call a sell from current levels.
We look to Sell at 2.0305 (stop at 2.0381)
Our profit targets will be 2.0085 and 2.0045
Resistance: 2.0260 / 2.0343 / 2.0400
Support: 2.0150 / 2.0100 / 2.0030
Risk Disclaimer
The trade ideas beyond this page are for informational purposes only and do not constitute investment advice or a solicitation to trade. This information is provided by Signal Centre, a third-party unaffiliated with OANDA, and is intended for general circulation only. OANDA does not guarantee the accuracy of this information and assumes no responsibilities for the information provided by the third party. The information does not take into account the specific investment objectives, financial situation, or particular needs of any particular person. You should take into account your specific investment objectives, financial situation, and particular needs before making a commitment to trade, including seeking, under a separate engagement, as you deem fit.
You accept that you assume all risks in independently viewing the contents and selecting a chosen strategy.
Where the research is distributed in Singapore to a person who is not an Accredited Investor, Expert Investor or an Institutional Investor, Oanda Asia Pacific Pte Ltd (“OAP“) accepts legal responsibility for the contents of the report to such persons only to the extent required by law. Singapore customers should contact OAP at 6579 8289 for matters arising from, or in connection with, the information/research distributed.

EURAUD dips continue to attract buyers.EURAUD - 24h expiry
Indecisive price action has resulted in sideways congestion on the intraday chart.
Pivot support is at 1.7600.
Risk/Reward would be poor to call a buy from current levels.
A move through 1.7850 will confirm the bullish momentum.
The measured move target is 1.7875.
We look to Buy at 1.7775 (stop at 1.7700)
Our profit targets will be 1.7925 and 1.7950
Resistance: 1.7850 / 1.7900 / 1.7950
Support: 1.7800 / 1.7775 / 1.7750
Risk Disclaimer
The trade ideas beyond this page are for informational purposes only and do not constitute investment advice or a solicitation to trade. This information is provided by Signal Centre, a third-party unaffiliated with OANDA, and is intended for general circulation only. OANDA does not guarantee the accuracy of this information and assumes no responsibilities for the information provided by the third party. The information does not take into account the specific investment objectives, financial situation, or particular needs of any particular person. You should take into account your specific investment objectives, financial situation, and particular needs before making a commitment to trade, including seeking, under a separate engagement, as you deem fit.
You accept that you assume all risks in independently viewing the contents and selecting a chosen strategy.
Where the research is distributed in Singapore to a person who is not an Accredited Investor, Expert Investor or an Institutional Investor, Oanda Asia Pacific Pte Ltd (“OAP“) accepts legal responsibility for the contents of the report to such persons only to the extent required by law. Singapore customers should contact OAP at 6579 8289 for matters arising from, or in connection with, the information/research distributed.

BTC (MBT) on the way ot 86'000Price reacted very well at the white and red fork lines (see arrows).
We have left the white centerline, and now price is hovering around the red one. If we get an open and close below it, we’ll have a new target: the WL1 of the white fork, which unsurprisingly, lines up with the red L-MLH.
Rough times ahead...

TSLA 1D: bounced at 380, now 412 decides if 530 is on the tableTesla pulled back precisely into the 380 area, lining up with the 0.5 Fibonacci retracement and the daily trendline, and bounced, confirming 360–380 as a key buy zone. This region combines the prior breakout range, trendline support and fresh accumulation. The next critical step for bulls is a clean breakout and hold above 412 dollars - the main resistance of the recent corrective leg and the local cap for the last swing. A sustained move above 412 unlocks room toward 450 and then the major upside target near 530 within the broader ascending channel.
Company: Tesla is the global leader in EVs, battery systems and energy solutions, combining manufacturing, software, autonomous driving and large-scale storage infrastructure.
Fundamentally , as of November 16, Tesla is in a transition phase: auto margins are lower than during the previous peak cycle due to price cuts and stronger competition, yet volume growth, scaling of the energy segment and improved factory efficiency help to stabilize profitability. Cash flow remains strong, the balance sheet is solid, energy and services are taking a larger share of total revenue, and long-term expectations are anchored by FSD progress and the robotaxi roadmap. For the market, Tesla is still the flagship brand of the EV sector, and any signs of margin stabilization tend to bring institutional money back quickly.
Tactically , as long as price holds above 380 and doesn’t break below 360, the retest-before-continuation scenario remains the base case. A confirmed breakout above 412 becomes the technical trigger toward 450 and then the 530 target along the upper channel. A loss of 360 would shift the picture into a deeper correction, but the current structure still looks more like a pause within an uptrend than a top.
Tesla loves to scare everyone with sharp red candles, then casually act like it was just warming up for the next leg.

ETH Support Bounce With Target at 3250Ethereum is trading above a key support level after a strong downward move. Price is showing early signs of a potential bullish correction, with projections pointing toward a possible recovery target around $3250. A break above minor resistance could confirm upward momentum.

EUR/USD - Repeat of 2015 Cycle?🔁 Is History Repeating Itself on EUR/USD?
(Monthly timeframe breakdown — impulse, consolidation, sweep, impulse, pullback… all lining up again)
Your chart highlights two major market cycles, years apart, that look almost identical in structure. Let’s walk through it clearly.
✅ 1. First Cycle (2015–2018)
A) Consolidation Phase (Orange Box)
Price moved sideways for months.
No clear direction — accumulation/distribution.
Market was building energy.
B) Sweep / Manipulation
Price dipped below consolidation lows (labelled X).
Classic liquidity grab.
Smart money entry zone.
C) Impulse Phase (Green)
Strong bullish move immediately after the sweep.
Buyers stepped in aggressively.
Market structure shifted bullish.
D) Pullback Phase (Red)
First correction after the strong impulse.
Healthy sign — market resetting before continuation.
This forms the classic 4-step macro cycle:
👉 Consolidation → Sweep → Impulse → Pullback
✅ 2. Current Cycle (2023–2025)
Your right-side circle mirrors the exact same pattern.
A) Consolidation Phase (Orange Box)
Range-bound market identical to 2015–2016.
Energy building again.
B) Sweep / Manipulation
Price runs liquidity under the range.
Same "grab the lows before reversing" behaviour.
C) Impulse Phase (Green)
Strong bullish run out of the sweep.
Again, identical structure as the previous cycle.
D) Pullback Phase (Red)
Market currently correcting.
Exactly like the 2017 correction before continuation.
🔥 3. Are We Literally Repeating the Same Playbook?
Yes — the structure is almost a 1:1 replica.
Both cycles show:
✔ Long consolidation
✔ Sweep of the lows
✔ Major bullish impulse
✔ Initial corrective pullback
This suggests that EUR/USD is following the same macro script it used last time before rallying even further.
📈 4. What This Might Mean for Traders
If history continues to rhyme:
The current pullback may be the “reset” before another bullish leg.
The last time this pattern formed, price continued higher for months.
Smart money behaviour (sweep → impulse → pullback) indicates bullish continuation is likely, unless the pullback breaks the previous swing low.
🎯 5. Bottom Line
Yes — history is repeating itself.
The same 4-stage macro cycle is unfolding again:
Consolidation → Sweep → Impulse → Pullback → (Potential continuation)
Your chart perfectly highlights the symmetry, and traders should take note:
📍 If the macro structure remains valid, EUR/USD may be gearing up for another HTF bullish continuation.

NZDUSD forming a bottom?NZDUSD - 24h expiry
Price action looks to be forming a bottom.
Risk/Reward would be poor to call a buy from current levels.
A move through 0.5675 will confirm the bullish momentum.
Short term RSI has turned positive.
The measured move target is 0.5725.
We look to Buy at 0.5650 (stop at 0.5625)
Our profit targets will be 0.5700 and 0.5725
Resistance: 0.5675 / 0.5700 / 0.5725
Support: 0.5650 / 0.5625 / 0.5600
Risk Disclaimer
The trade ideas beyond this page are for informational purposes only and do not constitute investment advice or a solicitation to trade. This information is provided by Signal Centre, a third-party unaffiliated with OANDA, and is intended for general circulation only. OANDA does not guarantee the accuracy of this information and assumes no responsibilities for the information provided by the third party. The information does not take into account the specific investment objectives, financial situation, or particular needs of any particular person. You should take into account your specific investment objectives, financial situation, and particular needs before making a commitment to trade, including seeking, under a separate engagement, as you deem fit.
You accept that you assume all risks in independently viewing the contents and selecting a chosen strategy.
Where the research is distributed in Singapore to a person who is not an Accredited Investor, Expert Investor or an Institutional Investor, Oanda Asia Pacific Pte Ltd (“OAP“) accepts legal responsibility for the contents of the report to such persons only to the extent required by law. Singapore customers should contact OAP at 6579 8289 for matters arising from, or in connection with, the information/research distributed.

EURAUD to find buyers at current market price?EURAUD - 24h expiry
Indecisive price action has resulted in sideways congestion on the intraday chart.
Pivot support is at 1.7600.
Risk/Reward would be poor to call a buy from current levels.
A move through 1.7750 will confirm the bullish momentum.
The measured move target is 1.7875.
We look to Buy at 1.7700 (stop at 1.7625)
Our profit targets will be 1.7850 and 1.7875
Resistance: 1.7750 / 1.7800 / 1.7850
Support: 1.7725 / 1.7700 / 1.7650
Risk Disclaimer
The trade ideas beyond this page are for informational purposes only and do not constitute investment advice or a solicitation to trade. This information is provided by Signal Centre, a third-party unaffiliated with OANDA, and is intended for general circulation only. OANDA does not guarantee the accuracy of this information and assumes no responsibilities for the information provided by the third party. The information does not take into account the specific investment objectives, financial situation, or particular needs of any particular person. You should take into account your specific investment objectives, financial situation, and particular needs before making a commitment to trade, including seeking, under a separate engagement, as you deem fit.
You accept that you assume all risks in independently viewing the contents and selecting a chosen strategy.
Where the research is distributed in Singapore to a person who is not an Accredited Investor, Expert Investor or an Institutional Investor, Oanda Asia Pacific Pte Ltd (“OAP“) accepts legal responsibility for the contents of the report to such persons only to the extent required by law. Singapore customers should contact OAP at 6579 8289 for matters arising from, or in connection with, the information/research distributed.

The Power of One Setup: Variety Kills ConsistencyMost traders chase new strategies, indicators, and secret signals. Progress rarely comes from adding more. It comes from mastering one thing deeply.
The fastest path to consistency is one setup traded a thousand times, until execution becomes automatic.
Every setup has a rhythm. Market conditions, timing, management. When you rotate through styles, you reset the learning curve repeatedly.
Specialization compresses uncertainty. You see the same context, the same triggers, the same mistakes, which tightens execution and accelerates feedback.
Switching setups leads to inconsistent entries, inconsistent risk, and mixed data. You cannot tell what actually works because the sample is polluted.
Professionals remove variables. They keep the market changing while the method stays constant.
Turn the setup into a rulebook.
• Market conditions: trend, range, volatility threshold, session.
• Structure: levels, pattern shape, invalidation logic.
• Entry: trigger candle, confirmation, timing window.
• Risk: stop location, size per trade, max daily loss.
• Management: partials, move to break even, trail or fixed target.
Mastery does not come from more information. It comes from repetition and refinement.
You do not need more strategies. You need fewer distractions.
