Hang Seng: it's time tu rise The price
The price is back above the EMA200 on daily time frame after 9 months of downtrend. In fact, since the index has scored new absolute highs above 33000 points, the price has started to fall until the support around 24500 points and from here it has restarted.
Technical analysis
Technically the price is now above the new dynamic support (identified by the EMA200) and from the static one formed by 38.2% of the Fibonacci retracement, respectively at the price of 27400 and 27700 points approximately: until the price remains above these levels , this index will tend to be lateral/bullish with target on the resistance placed at 30,000 points. If both supports yield, it will test again the area of 24000 points.
Our forecast
In the very short term it is very likely that the rising of price is the most valuable hypothesis, in line with the other main global indices. The returns to the bearish side is expected on the second quarter/half of 2019 when the markets will again be affected by the restrictive policies of the banks plants.
Hangsengindex

HSI Upper TargetHSI is currently in a very strong uptrend.
If it breaks the upper resistance 28350 and 28525, the upper target would be 29000.

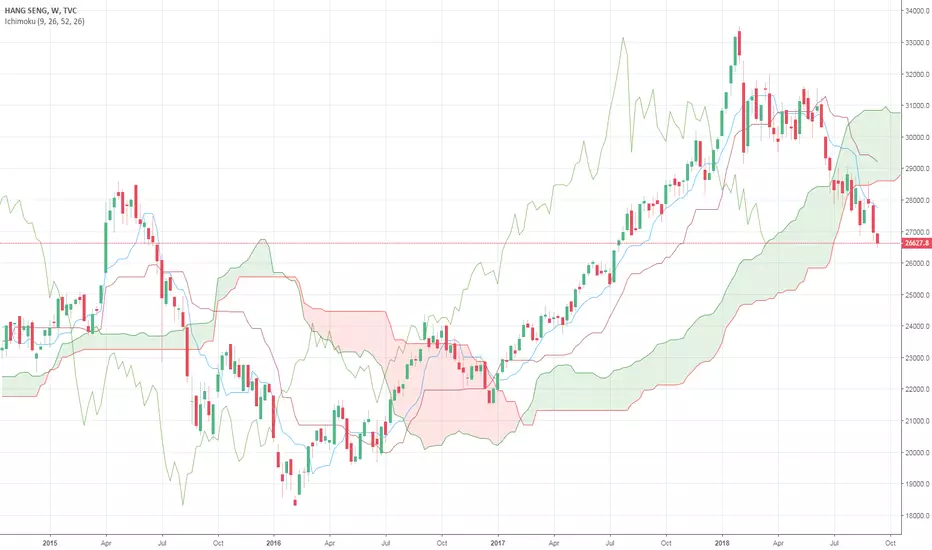
Hang Seng Index Too Much for this rally - Ichimoku and other indShorter term:
1. RSI overbought
2. MACD bearish reversal for shorter and middle term
3. KDJ overbought, bearish reversal for shorter term
Ichimoku for this rally:
1. conversion line up-crossing the base line well below the cloud
2. candle up-crossing the conversion line below the cloud, and the baseline in the middle of the cloud
3. relatively small candle breaking up the cloud with half immersed; cloud rather thin
4. magnetic effect from the currently flat baseline
Bullish Ichimoku signs:
5. Lagging span well above the price 26 days ago
6. Both spans for the cloud going upwards

HSI approaching resistance, potential drop!HSI is approaching our first resistance at 28057(horizontal swing high resistance, 38.2% Fibonacci retracement , 61.8% Fibonacci extension ) where a strong drop might occur below this level pushing price down to our major support at 26592 (50% Fibonacci retracement , 61.8% Fibonacci extension)
Stochastic (34,5,3) is also approaching resistance where we might see a corresponding drop in price.
Trading CFDs on margin carries high risk. Losses can exceed the initial investment so please ensure you fully understand the risks.

HSI approaching resistance, potential drop!HSI is approaching our first resistance at 29081(horizontal pullback resistance, 50% & 61.8% Fibonacci retracement ) where a strong drop might occur below this level pushing price down to our major support at 27135 (50% Fibonacci retracement , horizontal pullback support)
Stochastic (55,5,3) is also approaching resistance where we might see a corresponding drop in price.

HSI review in 2018 and the prospect in 2019In bearish market, starting from Q2 of 2018, the Hang Seng Index (HSI) enters bearish market. According to EW Theory, bearish waves either move in 5 or 3 smaller waves. Waves are impulsive if they move in 5, or corrective if they move in 3. In 5, we will denote the waves in 1-5, while ABC are used for corrective waves. I am betting the HSI will have 5 waves to go since the prices have been edged down past 250 MA which is one of the indicators showing it's a bearish market.

Rejection from Fibbs and trendline1. Good RR with stoploss above structure
2. Pin bar rejection from the fibb level
3. Volume is low on the pullback
4. Rejection from trend line.
5. Lower close of previous low in 1hour time frame. Good reason for entry

Hang Seng Index 2019 Forecast - POLAR BEAR emerges AF DOUBLE TOPHang Seng Index HSI over the last 18 years looks generally Rangy.
We have seen a recent failure DOUBLE TOP movement at its all-time high level near 32,000
Current price action looks trending in bearish momentum, the Global stock market is also recently taken a hit since the price no longer
makes higher low and higher high of what it feels like bull market over recent years.
Any price pullback should see a possible Head & Shoulder resistance formed at the recent horizontal line drawn above the current price.
We should see the price eventually heads towards Target 1 potentially before Target 2 should a global meltdown happens in 2019.
The good side of this Hang Seng Index is that the overall price is rather rangy over the last 18 years despite it is trading a big band high and low.
Recent low at 24500 is key to the downtrend, as soon as price closes below this key support, the price should escalate quickly towards T1.
We are not that bearish on HSI but China and US Market is likely to create financial turmoil for 2019.
#Disclaimer, this is just a forecast. Happy trading and good luck for 2019 - FTD

Hang Seng Index - Daily Key Elements Key levels to look out for when analysing Hang Seng Index, please refer to our 4 hour chart for a strategic view!

Hang Seng IndexThe Hang Seng index should have a sharp wave 4 rebound as wave 2 is a sideway movement. we should aim for 27200-28000 target.
then a wave 5 again. so wait for the sweet spot for sell or buy into to the rebound now.

Where Will Be Hang Seng Index In Coming DaysAs Per My Views On HSI:HSI :
Patterns On Day Chart:
1.Support From Upward Trend line
2.Head And Shoulder Pattern
3.Strong Horizontal Support At 27200
Breakout above 26940 on daily charts will be bullish for hang Seng index traders can go long above that with target of 28400 with stop of 26570

Hang Seng Stock Index - Strong +ve sign if manage a close aboveThe Hang Seng Stock Index (Hong Kong) is trading better recently. It is currently testing the daily ichimoku cloud, and will be a strong positive sign should it manage a close above the cloud. Is this just shortcovering ahead of the meeting between Trump and Xi at the G20 Summit or is it something more?

HSI ShortsPrice is revisiting previous swing high levels. Although resistance is around 26400, price can definitely continue to increase further before coming down. Thus it is only logical to place your Stop Loss above the previous Swing Highs. The Stop Loss level of 26800 is part of my strategy. If you are following this trade, do not adjust the stop loss. Rather, adjust your lot sizing instead. This is one of the very few Low Risk, High Reward Trade. Personally I have increasing my risk for 1% to 5% (thus 5x the usual profits).
Trade with care everyone and have a good week ahead. If you find my trades and analysis helpful, please visit my Patreon to support me :)

BagHODLersLooks like we choose the wrong market to get involved in.
"The sharper the move up the slower the downfall". Might be some truth to that...
Sure, "simple people" got extra excited and a huge adrenaline rush 1 year ago, but after 1 year, the chemicals left their bodies?
Are these "simple people like you and me that drive a tractor" so "simple and down to earth" that it takes XXtra long for their mind to process information.
AAAAAH I CAN'T TAKE THE WAITING ANYMORE SOMEONE HUG ME AND TELL ME EVERYTHING WILL BE ALLRIGHT BAGHOLDERS WILL GTFO A MARKET THEY DON'T BELONG TOO AND VOLATILITY WILL COME BACK.
Ps: I would wait 50+ years until the day I die before I go long on Bitcoin 0.72% if I have to, I have other things to trade meanwhile, but BagHODLers put all their money in this one thing and are stuck due to low 'IQ , let's see who loses patience first.
A shame... only asset I can trade and have negative fees (as mm on bitmex ).

uncertain HangSeng Hk33 HKDWidely expected to correct downwards after such a long period of growth.
However end of last week's movement proved there are still some steam left in the furnace. It might be range bound for a little while.
Be careful of this false break. Close of the market attempt to support break suggest some big funds at play or a large algo group going for a kill.


Hang Seng Stock Index: Bearish Outlook in months aheadHang Seng Stock Index looks extremely bearish on the weekly chart. It could trade to the low 20,000s in the months ahead. Look out below!
Resistance, Resistance, ResistanceThe Hang Seng Index has been running in the range of 27800 - 29000 since July.
Last Friday, we saw a +400 points of strong rebound after hitting a lower low of 27745.
The daily turnover has also increase from 70 billion to 100 billion, which may indicate support and potential reversal.
From the 1-hour chart, we see that the index has reached the top of the downward trendline, i.e. around 28220.
The next trading day would be critical. If the index goes beyond 28330 (top of downward trendline of 1-hour chart with wick), we may see a breakout pushing the index further to the next resistance level.
From the chart, we also see levels and levels of resistance ahead if the index goes up.
During a time which the trade war is progressing and China is under heavy capital control, we do not think that the index would break through these resistance levels.
Our trading strategy:
- SHORT position if the index does not stand above 28330.
- If the index goes beyond 28330, monitor at resistance levels and look for SHORT position
- The target would be around 27330, which is 1000 points from 28330.
Feel free to leave comments / share your idea!

Bear Unleashed Hang Seng Update.A little update on this Index that is perfectly consistent with the February "Bear Unleashed Hang Seng" chart.
Best wishes to all.

Hang Seng Elliott Wave Analysis: Correction HappeningHello Traders,
In this Elliott Wave Analysis, we will have a look at the Hang Seng Index.
Short-term view suggests that the rally to 31521.13 high on 6/07/2018 peak ended blue wave (2). Down from there, the decline to 27990.45 low is proposed to have completed blue wave (3).
The internals of blue wave (3) unfolded as Elliott Wave Impulse structure with extension. This suggests the sub-division of each wave lower (i.e. red wave 1, 3, and 5) unfolded as 5 waves structure. Below from 31521.13 high, Red wave 1 of blue wave (3) ended in 5 waves at 30874.1 and red wave 2 of (3) ended at 31242.86 high.
Then down from there, red wave 3 of (3) took place in extended 5 waves & ended at 28169.1. Up from there, red wave 4 of (3) ended at 28962.29 high, and red wave 5 of (3) ended at 27990.45 low. Above from there, the index is correcting cycle from 6/07 peak in blue wave (4) bounce.
The internals of that bounce is expected to unfold as an expanded flat. As far as a pivot from 6/07 peak (31537) peak stays intact, the index is expected to fail 1 more time within blue wave (5) towards 27588-26540 target area next.
Afterward, the index is expected to find buyers there for larger 3 wave reaction higher at least. We don’t like selling the Index

Looking for Breakout in HSIThe Hang Seng Index has been in a downward trend for one month (since 8 June) and currently undergoing a downward channel.
The US and China tariff and trade war issue has been affecting market environment as well as investor sentiments for the period.
We have finally come to 6 July, the effective date of the US tariff, and we witnessed some heavy rebound in the trading day.
Looking for a breakout and the big move on the direction in the next trading day.
Will it be a chance of REVERSAL or CONTINUING WITH THE TREND?
Feel free to leave comments / share your idea!
Long Entry: 28500
Short Entry: 28100

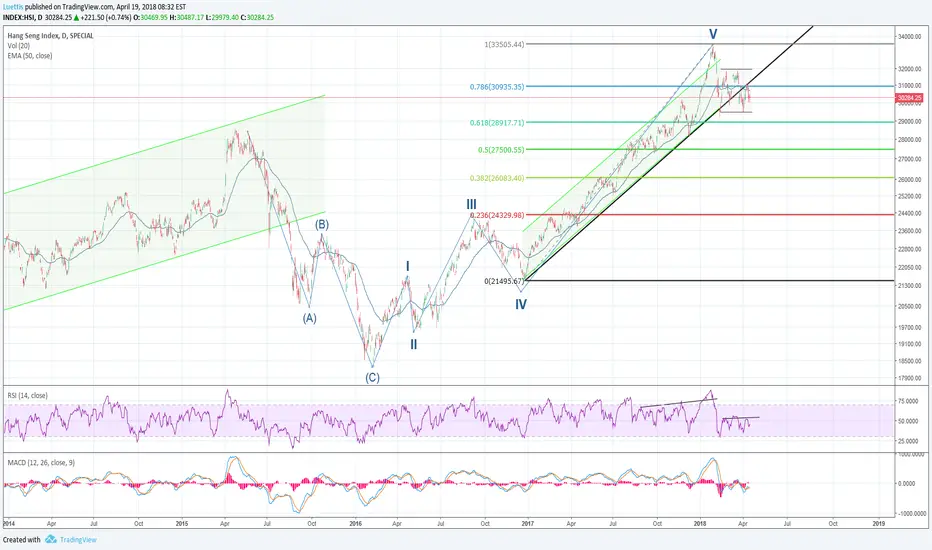
HSI in new channel to the sideHSI has reached ATH at 33484 on jan 29. Probably it was the end of wave 5.
After having passed the ATH it fell down on to the lower limit of the existing ascending trend channel.
In the next weeks this limit has been tested till it broke to the bottom.
We can now analyse that the new trend was installed when the index fell on the lower limit of the old trend channel. And we´re in a neutral trend channel with high volatility now.
The fib retracement 78.6% at 30.935 is the actual resistance.
RSI is below 50 with a little positive trend but MACD is negative and trigger line is just about to cross the signal line.
= negative sign
In my view the market is nervous and could surprise the investors with unexpected movements.
Time to take profits and to be cautios.
HSI would show new bullish signs when a) the resistance is taken and b) the upper limit of the trend channel is broken to the top
Upside on 10Y yield20MA past 50MA seems to be an important indicator of the near-term upside of the 10Y yield. We have to be more cautious on equity market in May.. Long VIX.
