17.02.26 Daily ForecastPairs on Watch -
FX:GBPAUD
A short overview of the instruments I am looking at for today, multi-timeframe analysis down to what I will be looking at for an entry. Enjoy!
Harmonic Patterns

How to Spot Altseason: The Capital Rotation Relay ExplainedEvery bull run I get the same DM:
“When altseason bro?”
There is no magic altseason button. There is capital rotation. BTC → ETH → top alts. And the switch is visible right in the structure, if you know what to watch.
Forget indicators for a second. Just imagine the market as a relay race.
First runner: BTC
Second runner: ETH
Third runner: top alts (SOL, BNB, majors)
Then maybe the meme trash at the very end.
The trick is to see exactly when the baton changes hands.
How BTC structure looks when it’s “dominant”
- Clear higher highs and higher lows on daily
- Strong impulsive candles, shallow pullbacks
- BTC dominance making higher highs
- ETH and alts going up less or just chopping
In this phase, chasing alts is like trying to overtake a Ferrari on a bicycle. Funny, but painful.
Then the first switch: BTC → ETH
Here’s what usually happens in structure:
- BTC stops trending cleanly. You start seeing:
- Ranging at the top
- Fake breakouts
- First lower high on 4H or daily
At the same time ETH starts acting different:
- ETHUSD holds a higher low while BTC is retesting deeper
- ETH breaks its range high while BTC is still stuck
- ETHBTC (very important) breaks a downtrend or range to the upside
That ETHBTC chart is like the “who is boss now” chart.
If BTC is flat and ETHBTC is climbing - money is literally rotating into ETH.
Then the second switch: ETH → top alts
Replay the same logic:
- ETH has already had a good move, starts to range
- Wicks both sides, no clean follow through up
- ETHBTC cools off or starts forming lower highs
And suddenly top alts start showing life:
- After months of downtrend, you see first clear higher low on daily
- Break of structure: coin stops making lower lows and finally closes above the last lower high
- While BTC and ETH are moving sideways, some majors are quietly doing +10-20% days
That’s not “random pump”. That’s rotation.
My simple rule of thumb:
- BTC vertical - focus on BTC
- BTC ranging, ETHBTC strong - focus on ETH
- ETH ranging, majors breaking downtrends - scan top alts
Maybe I’m wrong, but I think “altseason” is just a lazy name for a very readable sequence: BTC runs, cools, ETH takes over, cools, majors take over.
Next time market is moving, don’t just stare at one chart. Put BTCUSD, ETHUSD, ETHBTC and 2-3 top alts side by side and literally ask:
“Who is making higher highs while others are sleeping?”
That’s usually where the baton is - and where the fresh money is flowing.

ETH – $1,500 & $3,000 are Magnets… Which One First?ETH has been hovering inside a clear range around the $2,000 round number.
This range is taking the shape of a symmetrical triangle, meaning compression is building and a breakout is approaching.
As long as price remains inside the triangle, it is just noise within consolidation.
If we get a confirmed break above the upper bound, a bullish expansion toward the $3,000 supply zone becomes the next logical target.📈
If the triangle breaks downward, expect one more bearish impulse toward the $1,500 support zone.📉
Now the question is:
Which level will get tested first?
⚠️ Disclaimer: This is not financial advice. Always do your own research and manage risk properly.
📚 Stick to your trading plan regarding entries, risk, and management.
Good luck! 🍀
All Strategies Are Good; If Managed Properly!
~Richard Nasr

BITCOIN The 0.382 Fibonacci consolidation rule.We have already shown on various recent analyses how Bitcoin (BTCUSD) is replicating the Bear Cycle of 2022. Our latest finding is a very unique feat that BTC does after every major Low.
As this chart shows, when the 1W RSI turns oversold (below 30.00), Bitcoin starts a lengthy consolidation that extends primarily up to the 0.382 Fibonacci retracement level. This range (0.0 - 0.382 Fib) constitutes a Consolidation phase. It was even present on the last Low before the Bull Cycles of 2021 and 2025 topped.
Right now it appears we have just started the 2nd Consolidation phase of the Bear Cycle following the early February crash (RSI again oversold even below 20.00). So far this '0.382 Fib consolidation rule' has been validated as the initial rebound tested the 0.382 Fib and got rejected back into range.
So will the market confirm this rule once more and trade sideways for a month before the next Low? Feel free to let us know in the comments section below!
---
** Please LIKE 👍, FOLLOW ✅, SHARE 🙌 and COMMENT ✍ if you enjoy this idea! Also share your ideas and charts in the comments section below! This is best way to keep it relevant, support us, keep the content here free and allow the idea to reach as many people as possible. **
---
💸💸💸💸💸💸
👇 👇 👇 👇 👇 👇

BUY BITCOIN NOWBITCOIN (BTC/USD) has recently dropped in price but struggled to break through a major support level (the yellow trend line aka the downward trend channel) which is currently holding the price. A few weeks ago the price also broke a strong resistance level (the white trend line shown on the chart) - The price is currently bouncing off the major support zone and likely to go back to the upside and hit the take profit level (drawn on the chart). Time to Buy BTCUSD now!

NASDAQ The unavoidable Bearish Cross..Nasdaq (NDX) is about to form a 1D MA50/ 1D MA100 Bearish Cross the first is almost 1 year (since March 19 2025). That is a very bearish pattern, which before that was last seen at the beginning of the 2022 Bear Cycle.
As we've examined in prior analyses, we see many similarities (mostly in long-term cyclical terms) between the price action of the past 4 months (since the October 30 2025 High) and the start of the 2022 Bear Cycle.
As you can see, Nasdaq currently has a Double Top pattern, which was also formed in late 2021 before the 1D MA50 (blue trend-line)/ 1D MA100 (green trend-line) Bearish Cross. We have currently come very close to testing the 1D MA200 (orange trend-line) and if it breaks, then most likely the 2026 Bear Cycle will be confirmed. Both fractals also exhibit identical 1W RSI patterns, with Channel Down Bearish Divergencies.
This looks like the technical build up for a massive correction. So how low could that be? Well the 2022 dropped by -37.70%, bottoming marginally above the 1W MA250 (red trend-line). That was below the 0.382 Fibonacci retracement level from the previous Bear Cycle bottom. Essentially the 1W MA200 (black trend-line) and the 1W MA250 created a 3-month Buy Zone.
As a result, even though a new -37.70% correction seems like a more extreme scenario as this time it would be significantly below the 1W MA250, a 0.382 Fibonacci retracement test at 18500 wouldn't be unrealistic at all. It would also make a nearly perfect test on the 1W MA200. This time perhaps the Accumulation Zone could be between 19100 - 18500.
---
** Please LIKE 👍, FOLLOW ✅, SHARE 🙌 and COMMENT ✍ if you enjoy this idea! Also share your ideas and charts in the comments section below! This is best way to keep it relevant, support us, keep the content here free and allow the idea to reach as many people as possible. **
---
💸💸💸💸💸💸
👇 👇 👇 👇 👇 👇

EURUSD – Bullish Structure, Buy the Pullback?EURUSD has been overall bullish, printing higher highs and higher lows within a rising structure.
Now price is approaching a key intersection:
• The lower blue trendline defining the overall direction
• A strong demand zone acting as support
As long as this intersection holds, we will be looking for trend-following longs in line with the broader bullish momentum.
Trend is up.
Pullbacks are opportunities... until proven otherwise.
⚠️ Disclaimer: This is not financial advice. Always do your own research and manage risk properly.
📚 Stick to your trading plan regarding entries, risk, and management.
Good luck! 🍀
All Strategies Are Good; If Managed Properly!
~Richard Nasr

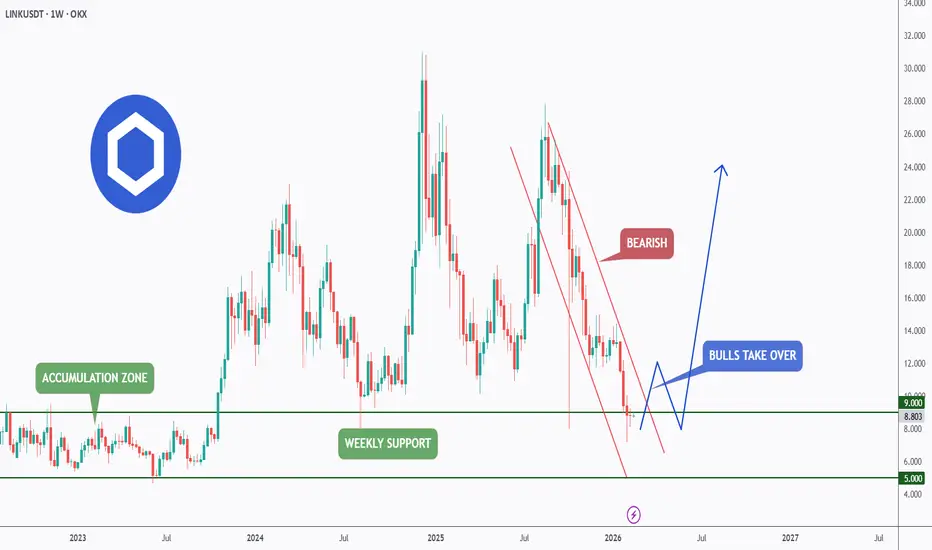
LINK – Weekly Support in PlayLINK is now diving into a major weekly support zone , the same area that previously acted as accumulation.
This is a key level.
As long as this weekly support holds , we will be looking for long-term longs, positioning for the next potential upside cycle.
However , for the bulls to truly take over and kickstart the next impulse, a clear break above the falling red channel is needed.
- Support first.
- Structure break second.
- Impulse follows.
⚠️ Disclaimer: This is not financial advice. Always do your own research and manage risk properly.
📚 Stick to your trading plan regarding entries, risk, and management.
Good luck! 🍀
All Strategies Are Good; If Managed Properly!
~Richard Nasr
PEPE Reclaims Support After Deviation with Bullish StructurePEPE price action is showing constructive signs after completing a deviation below high-timeframe support and quickly reclaiming that level. This move appears to have acted as a liquidity sweep rather than a true breakdown, flushing out weak hands before a sharp reaction higher. The reclaim was confirmed by a strong bullish engulfing candle, which invalidated the recent bearish continuation.
From a market structure perspective, this engulfing candle also broke the sequence of lower highs, signaling a potential shift away from short-term bearish control. Price is now trading back above the key high-timeframe support, which is critical for maintaining bullish momentum in the immediate term.
The next technical level to monitor is the value area low (VAL). A reclaim and acceptance above this level on a closing basis would confirm acceptance back into value and significantly increase the probability of a rotational move higher. In that scenario, the point of control (POC) becomes the next upside objective, acting as the primary resistance within the broader trading range.
As long as PEPE holds above reclaimed support, downside continuation risk remains reduced. While some consolidation is possible, the current structure favors stabilization and further upside exploration rather than renewed breakdown.

Bullish bounce off overlap support?EUR/USD is falling towards the support level which is an overlap support and could bounce from this level to our take profit.
Entry: 1.1779
Why we like it:
There is an overlap support level.
Stop loss: 1.1733
Why we like it:
There is an overlap support level that aligns with the 61.8% Fibonacci projection.
Take profit: 1.1915
Why we like it:
There is a pullback resistance level.
Enjoying your TradingView experience? Review us!
Please be advised that the information presented on TradingView is provided to Vantage (‘Vantage Global Limited’, ‘we’) by a third-party provider (‘Everest Fortune Group’). Please be reminded that you are solely responsible for the trading decisions on your account. There is a very high degree of risk involved in trading. Any information and/or content is intended entirely for research, educational and informational purposes only and does not constitute investment or consultation advice or investment strategy. The information is not tailored to the investment needs of any specific person and therefore does not involve a consideration of any of the investment objectives, financial situation or needs of any viewer that may receive it. Kindly also note that past performance is not a reliable indicator of future results. Actual results may differ materially from those anticipated in forward-looking or past performance statements. We assume no liability as to the accuracy or completeness of any of the information and/or content provided herein and the Company cannot be held responsible for any omission, mistake nor for any loss or damage including without limitation to any loss of profit which may arise from reliance on any information supplied by Everest Fortune Group.

Selelna | Xauusd Market Analysis Structure Buy MondayPEPPERSTONE:XAUUSD
Market Overview:
Price pulled back into a strong demand zone after rejecting 5,100 resistance.
Holding above 4,920 keeps the short-term bullish continuation bias intact.
TP1: 5,040
TP2: 5,100
Entry: 4,950 – 4,980
Stoploss: 4,900
(For educational purposes only.)

Shiba Inu Holds Monthly Support as Oversold Bounce DevelopsShiba Inu price action has stabilized after an impulsive sell-off pushed price into deeply oversold territory. The recent downside move briefly drove SHIB below a key monthly support level, but price has since reclaimed this zone and confirmed it with a bullish retest. This behavior often signals seller exhaustion rather than a sustained breakdown.
Following the reclaim, SHIB is now consolidating around the value area low of the prior trading range. This area represents the lower boundary of fair value and is a critical level for continuation. As long as price continues to hold above this region on a closing basis, it supports the idea that buyers are absorbing supply and defending the reclaimed support.
From a momentum perspective, oversold conditions that developed during the sell-off are beginning to ease. This typically allows room for a relief rally, especially when combined with a successful support reclaim. While this does not yet confirm a full trend reversal, it does increase the probability of a rotational move higher.
If bullish volume continues to build, the next upside objective sits near the value area high, where prior resistance is expected. Failure to hold above current support would weaken the setup, but for now, structure favors stabilization and short-term upside potential.

ETH Holding Major Support – 2040 Reclaim Opens Path to 2090ETH Holding Major Support – 2040 Reclaim Opens Path to 2090
ETH is reacting strongly from a well-defined support zone around 1935–1950, which has now been defended multiple times.
The repeated wicks into this area show clear buyer interest and absorption after the sharp sell-off from the highs.
As long as the strong support base holds, the short-term bias remains bullish.
Key levels to watch:
2040
2090
A clean break and consolidation above 2040 would confirm momentum continuation and likely open the move toward 2090 liquidity. Failure to hold support would invalidate the bullish structure and shift momentum back to sellers.
You may find more details in the chart.
Thank you and good luck! 🍀
❤️ If this analysis helps your trading day, please support it with a like or comment ❤️

Btc and the midterm election cycles2026 sees the midterm election over in the USA, these midterms seem to have an adverse effect on the bitcoin price as you can see from what I've drawn.
I've looked back to the last 2 midterms, 2018 and 2022 and both have the same conclusion, large drawdowns. 2018 saw an 84% price decrease on bitcoin and in 2022 a 77% decrease, if we say the drawdowns are decreasing by 7% from the last 2, then we could see a drawdown of 70% from our $126k top to around $38k area. These drawdowns also seems to start around a year prior to the midterms give or take a month or 2.
This isn't any guarantee, this is theory but the theory seems to be at this point rhyming, we could of course go lower than 70% or we could bounce on any good news from anywhere, you all know how this works, but this is just my idea, I've also added a harmonic into this drawdown, but we could also be looking at an ABCD correction.
I didn't want to add to many drawings onto the chart, I try and keep these clean of other distractions, but there is an ABCD corrective harmonic in there. You can also draw these drawdowns on the S&P and the NAS, they also have something similar but not as deep as the bitcoin corrections.
Just a little more info, we have 2 CME gaps on the 4hr chart 1 being between $39,450 and $39,350, the other is lower (I personally don't think we'll hit it, but posting for reference) this is at $21,110 and $20,145
As always, this isn't financial advice, this is my personal idea of how I'm looking at things from my perspective......
Private idea

TRXUSDT with a bearish cross on MACDhi traders
TRX looks toppy here.
Bearish cross on MACD.
It had a great bull run but it's time to cool down.
Target is shown on the chart.

#XAUUSD: 1500+ Intraday Trading Idea, Let's See How It GoesDear Traders,
Gold has been declining since market opening at 4950. We believe the price is likely to continue falling around $4700 which is a strong indication.
Please exercise risk management while trading gold and consider using small target sizes initially such as 300 pips before increasing the target as the trade progresses.
Best regards,
Team Setupsfx

AUDUSD LONG VIEWS!!The Australian dollar rose to around $0.70 on Monday, snapping a two-session losing streak, as investors turned their focus to the upcoming release of the latest minutes from the Reserve Bank of Australia.

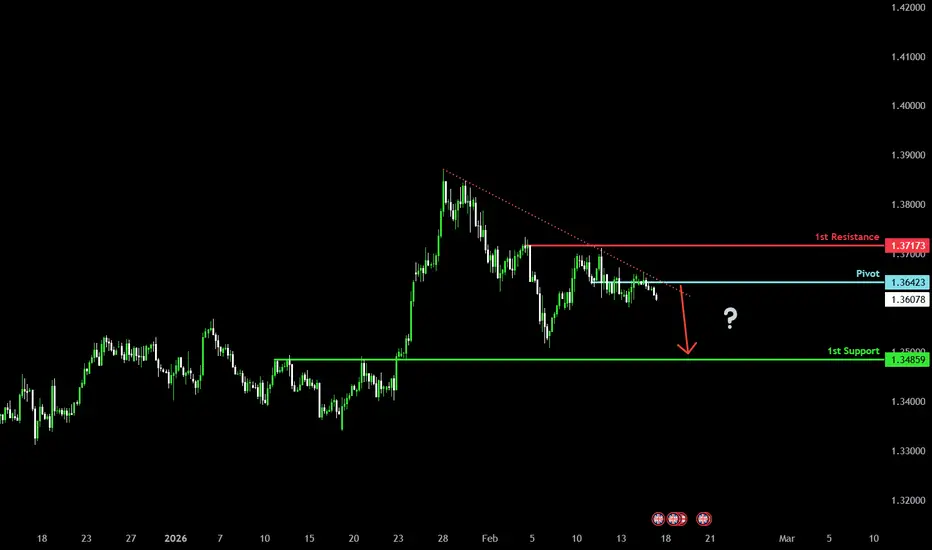
Bearish reversal setup?Cable (GBP/USD) has rejected off the pivot and could drop to the 1st support.
Pivot: 1.3642
1st Support: 1.3485
1st Resistance: 1.3717
Disclaimer:
The opinions given above constitute general market commentary and do not constitute the opinion or advice of IC Markets or any form of personal or investment advice.
Any opinions, news, research, analyses, prices, other information, or links to third-party sites contained on this website are provided on an "as-is" basis, are intended to be informative only, and are not advice, a recommendation, research, a record of our trading prices, an offer of, or solicitation for, a transaction in any financial instrument and thus should not be treated as such. The information provided does not involve any specific investment objectives, financial situation, or needs of any specific person who may receive it. Please be aware that past performance is not a reliable indicator of future performance and/or results. Past performance or forward-looking scenarios based upon the reasonable beliefs of the third-party provider are not a guarantee of future performance. Actual results may differ materially from those anticipated in forward-looking or past performance statements. IC Markets makes no representation or warranty and assumes no liability as to the accuracy or completeness of the information provided, nor any loss arising from any investment based on a recommendation, forecast, or any information supplied by any third party.
XAUUSD Same cyclical pattern for the last 2 years..Gold (XAUUSD) has been consolidating since its January 29 High and the subsequent correction that touched its 1D MA50 (blue trend-line). This ranged trading is very common within the 2-year Channel Up that the market has been trading in since the December 04 2023 High.
As you can see after each Higher High, this pattern corrected to at least its 1D MA50 and in some cases the 1D MA100 (green trend-line), which is its ultimate long-term Support and then consolidated in what has been a standard Accumulation Phase, before the new Bullish Leg begins for a Higher High on the 3.0 Fibonacci extension (blue). Only a break and weekly closing below the 1D MA200 can invalidate that.
As a result, until the latter happens, Gold is expected to continue sideways its new Accumulation Phase for another 1-2 months before testing the $6000 psychological level.
---
** Please LIKE 👍, FOLLOW ✅, SHARE 🙌 and COMMENT ✍ if you enjoy this idea! Also share your ideas and charts in the comments section below! This is best way to keep it relevant, support us, keep the content here free and allow the idea to reach as many people as possible. **
---
💸💸💸💸💸💸
👇 👇 👇 👇 👇 👇

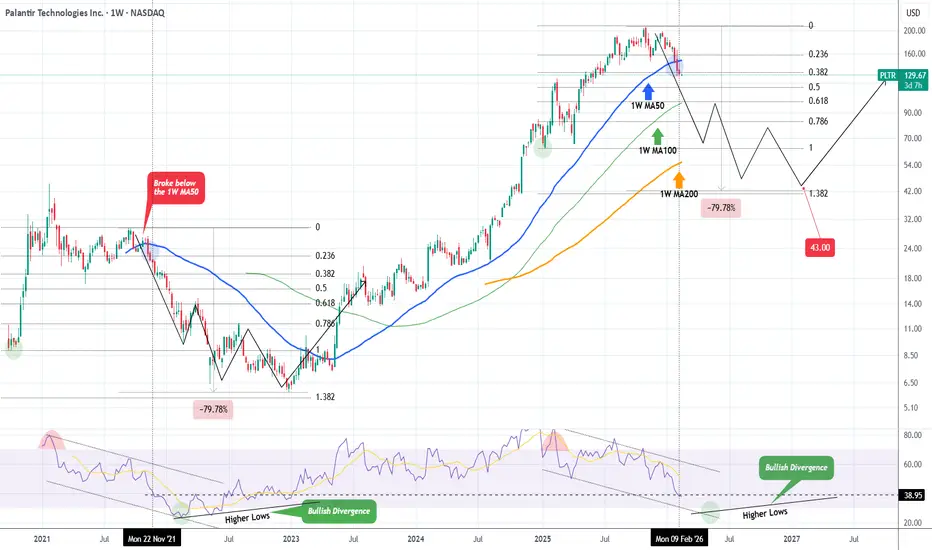
PALANTIR Bear Cycle accelerating. Potential bottom at $43.Palantir (PLTR) was one of the biggest winners of the 2023 - 2025 A.I. driven Bull Cycle but since breaking below its 1W MA50 (blue trend-line) two weeks ago, it has confirmed its new Bear Cycle.
So far this is no different than the previous one in late 2021 - 2022. That Bear Cycle also started when the 1W MA50 broke to the downside, while the 1W RSI was already trending downwards within a Channel Down (as the market has also been doing since 2025 on the current fractal).
Once the 1W MA50 broke, the 2022 Bear Cycle found its first Support when the 1W RSI got oversold (below 30.00), which took place around the 0.786 Fibonacci retracement level. The market eventually bottomed 6 months later after completing a nearly -80% total drop.
The 0.786 Fib on the current fractal is around $82.50 and Palantir may potential make contact with its 1W MA200 (orange trend-line) also by then (RSI possible below 30.00 again). We believe it is possible to go for another -80% total correction, giving a Bear Cycle bottom at $43.00.
---
** Please LIKE 👍, FOLLOW ✅, SHARE 🙌 and COMMENT ✍ if you enjoy this idea! Also share your ideas and charts in the comments section below! This is best way to keep it relevant, support us, keep the content here free and allow the idea to reach as many people as possible. **
---
💸💸💸💸💸💸
👇 👇 👇 👇 👇 👇
GBPJPY — Moderate Bear at Demand, But Volume Has VanishedGBPJPY — Moderate Bear at Demand, But Volume Has Vanished
Overview:
GBPJPY is sitting at 209.010 with a moderately bearish bias, but the real story is volume — it has virtually disappeared. Volume Z-score is at -1.83 (Very Low), meaning participation is well below normal. Price is balanced at demand, and a volume squeeze is building. This is a market waiting for a catalyst, and when volume returns, it will likely move fast.
Price:
Trading at 209.010 on FX. Price is nearly flat with -0.3% retrace and 0.4% bounce, classified as 1.3x Balanced. Price is sitting directly on a demand zone. The balanced reading means neither buyers nor sellers have won the current micro-battle. Demand is being tested but not broken — and not convincingly defended either.
Bias:
Moderate BEAR at 22.45% conviction with a 38.8% to 61.2% signal split. Candle signals are the most bearish at 4:10, but Ichimoku is nearly split at 6:7 and EMA leans slightly bearish at 3:2. The C>T counter timeframe reading is heavily bearish at 4:10 — higher timeframes are clearly favouring downside. Signal spread of 22.4% is moderate with clarity at 44%, the lowest of all metrics. The structure says bearish, but the commitment is lukewarm.
Volume:
This is the dominant feature of this setup. Volume Z-score is -1.83 — classified as Very Low. That is nearly two standard deviations below normal activity. Spot volume is 111.19K with session volume at just 532. Momentum is sharply decelerating at -1.07. The volume squeeze is building at 3 bars, and S.Mom shows convergence dropping at 148.4%. The market has gone quiet — dangerously quiet. Very low volume at a demand zone is a setup that often precedes a sharp move when liquidity returns.
Momentum:
Momentum reads Bull ↓ with a bandwidth of only 0.69% — extremely compressed. This is unusual — momentum is technically still in a bullish state but fading rapidly. The deceleration at -1.07 is aggressive. Combined with the building volume squeeze, momentum is being drained before a likely reset in either direction.
Scenarios:
🐻 Demand breaks on volume return (primary lean):
The C>T reading of 4:10 gives higher timeframes a clear bearish edge. Candle structure at 4:10 confirms selling pressure. If volume returns with a Z-score spike above 1.0 on a break below demand, this becomes a clean short. The very low volume currently suggests institutions are waiting, not accumulating.
🐂 Demand holds, volume squeeze releases upward (secondary):
Price is on demand and the balanced 1.3x classification means buyers haven't given up. If the volume squeeze releases with rising volume and momentum flips fully bullish, a bounce off demand could target the next supply zone. EMA leaning slightly less bearish at 3:2 and Ichimoku near split at 6:7 leave the door open.
🔄 Dead zone continuation (possible):
With volume this low and clarity at 44%, the market may simply drift without resolution. This is the "no trade" scenario — and at -1.83 Z-score, it is a real possibility that nothing meaningful happens until a macro catalyst arrives.
Watch:
Volume Z-score — at -1.83, any move toward 0 or above signals participation returning, that is the trigger
Demand zone — price is right on it, a clean break or bounce will define direction
Volume squeeze — building at 3 bars, release will amplify whatever move comes next
C>T balance — 4:10 bearish is the strongest directional signal in this setup
Momentum deceleration — -1.07 is steep, watch for a bottoming and reversal
Risk:
No futures data available. The extremely low volume makes this a patience trade — entering now means trading in a vacuum with no participation to confirm your thesis. The volume squeeze building at 3 bars alongside the very low Z-score creates a setup where the eventual move could be outsized relative to current conditions. Wait for volume to return before committing. Clarity at 44% is the lowest reading here, reinforcing that this is a "watch and wait" environment. When volume shows up, act. Until then, observe.
👆More analysis on my profile.
Suggested tags: GBPJPY forex demand lowvolume squeeze technicalanalysis volumeanalysis

INITUSDT Forming Falling WedgeINITUSDT is forming a clear falling wedge pattern, a classic bullish reversal signal that often indicates an upcoming breakout. The price has been consolidating within a narrowing range, suggesting that selling pressure is weakening while buyers are beginning to regain control. With consistent volume confirming accumulation at lower levels, the setup hints at a potential bullish breakout soon. The projected move could lead to an impressive gain of around 80% to 90% once the price breaks above the wedge resistance.
This falling wedge pattern is typically seen at the end of downtrends or corrective phases, and it represents a potential shift in market sentiment from bearish to bullish. Traders closely watching INITUSDT are noting the strengthening momentum as it nears a breakout zone. The good trading volume adds confidence to this pattern, showing that market participants are positioning early in anticipation of a reversal.
Investors’ growing interest in INITUSDT reflects rising confidence in the project’s long-term fundamentals and current technical strength. If the breakout confirms with sustained volume, this could mark the start of a fresh bullish leg. Traders might find this a valuable setup for medium-term gains, especially as the wedge pattern completes and buying momentum accelerates.
✅ Show your support by hitting the like button and
✅ Leaving a comment below! (What is your opinion about this Coin?)
Your feedback and engagement keep me inspired to share more insightful market analysis with you!

HBAR/USDT - Falling Channel, Breakout or Bearish Continuation?On the 1D timeframe, HBAR/USDT is still under medium-term bearish pressure. Price has been moving consistently inside a descending / falling channel since the previous peak, indicating that sellers remain dominant.
The market structure shows:
Lower Highs
Lower Lows
Rejections at the upper trendline
Currently, price is testing the channel resistance along with a horizontal resistance zone, making this a crucial decision area for the next move.
---
Pattern Explanation
The main pattern visible on the chart is a:
Falling Channel / Descending Channel
Key characteristics:
1. Two parallel downward trendlines
Upper trendline = Dynamic Resistance
Lower trendline = Dynamic Support
2. Repeated price bounces within the channel
3. Volume tends to weaken on rallies and increase on drops → distribution indication
Theoretically:
A Falling Channel can act as a bullish reversal pattern if an upside breakout occurs
Until breakout happens → it remains a bearish continuation structure
---
Key Levels
Layered Resistances
0.10500 → Minor resistance / latest rejection
0.11550 → Horizontal resistance
0.13049 → Mid resistance
0.14850 → Major resistance
0.16200
0.19400 → Macro key resistance
Supports
0.08850 → Near-term support / temporary base
Channel lower trendline
0.07229 → Previous swing low / extreme support
---
Bullish Scenario
Bullish confirmation requires a channel + resistance breakout.
Flow scenario:
1. Price breaks above the falling channel upper trendline
2. Daily candle closes above 0.10500
3. Successful retest turns resistance into support
Upside targets:
0.11550
0.13049
0.14850
0.16200
0.19400 (major target)
This move would likely be supported by:
Volume expansion
Broader crypto market strength
Weakening BTC dominance
A valid breakout could shift structure from bearish to sideways or bullish reversal.
---
Bearish Scenario
If breakout fails, the channel remains a bearish continuation pattern.
Bearish confirmations:
1. Rejection at the upper trendline
2. Failure to hold above 0.10500
3. Breakdown below 0.08850
Downside targets:
Mid-channel support
Lower channel trendline
0.07229
If the lower support breaks → potential:
Capitulation wick
New lower low
Deeper bearish continuation
---
Conclusion
HBAR/USDT is currently at a key decision zone.
Channel breakout → upside reversal potential
Rejection → continuation to the downside
As long as price remains inside the falling channel, the bias stays bearish-to-neutral.
Traders should wait for:
Breakout confirmation for long positions
Clear rejection for short positions
Key level discipline remains essential.
#HBAR #HBARUSDT #CryptoAnalysis #TechnicalAnalysis #Altcoins #CryptoTrading #FallingChannel #BearishTrend #BullishBreakout #SupportResistance #ChartPattern #CryptoMarket #PriceAction #TrendAnalysis
