BTR Update — 07 Jan 2026 | No Trade Day📊 BTR Update — 07 Jan 2026 | No Trade Day
Stock: BSE LTD
Timeframe: Intraday
Indicator: BTR Price Action
⛔ Signal Status
BTR Signal: ❌ No Signal Generated
Trades Taken: 0
🧠 Market Observation
Price action remained indeccisive / range-bound,
with no valid BTR structure for entry.
👉 System correctly kept us out of low-probability trades.
✅ Result
P&L: 0 Points
Capital: Protected
Discipline: 100%
🎯 Why No-Trade Days Matter
✔ Avoids overtrading
✔ Preserves mental & financial capital
✔ Confirms system patience
❝ Not trading is also a position. ❞
📌 BTR Rule Reminder
If no signal → no trade → no regret
📍 Next valid BTR signal will be traded with full discipline
— AdiJohn
Harmonic Patterns

Gold in NFP week — When the chart out-plays the traderNFP week (Non-Farm Payrolls) is known for wide ranges, frequent SL sweeps, and sharp reversals that make retail traders believe the trend has broken, while the market is actually just collecting liquidity before the real move.
1. Gold is “calm” early week, “crazy” late week
Mon – Tue: Price usually compresses and moves sideways to build positions and stack liquidity
Wed – Thu: Spikes, fake breakouts, and Stop Hunts happen more often
Friday (NFP release): Volatility explodes, spreads widen, and price can hit both directions within minutes
During NFP week, gold isn’t hard to analyze — it’s hard because it won’t let you be right too early.
2. NFP news doesn’t just create a trend, it creates noise before the trend
Before running the main direction, gold often:
Breaks a level quickly to trigger retail SL
Wicks back into the original zone (liquidity sweep)
Then launches the real move
That’s why traders get “stopped at the top or bottom” — not because they’re wrong, but because their SL is sitting at the most obvious liquidity spot.
3. Where does gold react the hardest during NFP week?
Typically at:
Recent highs and lows
Round numbers
Zones where structure looks too clean and everyone draws the same
These areas are liquidity magnets, not true breakout guarantees.
4. What should traders do this week?
Reduce position size, avoid all-in
Don’t place SL too tight near early-week levels
Wait for liquidity to be swept before entering
Avoid FOMO when spikes appear too soon
Prioritize setups that revalidate structure after the noise
5. The classic gold storyline every NFP week
Retail traders hunt perfect entries.
Institutions hunt perfect SL.
Gold hunts SL first, then delivers trend later.

XRPUSDTENTRY: 2.2430 until 2.1330
SL: 2.104
TP: 2.60
**There is no responsibility for your profits or losses. Please observe capital management.**

TAO Pulls Back Into Demand — Bullish Continuation Setup ON$TAO/USDT is currently pulling back into a well-defined Demand Zone after a strong impulsive bullish move, indicating a healthy retracement rather than a trend reversal.
The Demand Zone ($273.0 – $276.5) has already proven to be a strong reaction area in the past, suggesting institutional accumulation and dip-buying interest.
Price is stabilizing around this zone, creating a favorable setup for bullish continuation if demand holds.
Entry: $275.0 (inside the demand zone, optimal for risk-to-reward).
Stop Loss: $269.0 (below demand → clear structure invalidation).
Target 1: $290.0 (previous reaction high / near-term liquidity).
Target 2: $305.0 (major resistance and higher-timeframe liquidity area).
Bias: Bullish as long as price holds above $273.0, with the pullback viewed as corrective before the next leg higher.

PEPE Rejects Supply, Will Reloads at Demand — Next Leg Upcoming$PEPE/USDT is currently rejecting from the Supply Zone ($0.00000701 – $0.00000712), indicating short-term distribution and profit-taking.
Price is expected to continue pulling back toward the Demand Zone ($0.00000617 – $0.00000631), where strong buying interest previously entered the market.
The Demand Zone is likely to act as a base for the next move higher, setting up a potential bullish continuation.
Entry: $0.00000626 (within demand zone, optimal risk-to-reward).
Stop Loss: $0.00000610 (below demand → clean invalidation).
Target 1: $0.00000660 (initial liquidity grab / reaction level).
Target 2: $0.00000706 (return to supply and prior highs).
Bias: Bullish after demand reaction; pullback is corrective as long as price holds above $0.00000617.

Ventas, Inc. (VTR) – Short Setup Technical AnalysisVentas, Inc. (VTR) – Short Setup Technical Analysis
VTR is currently trading above the Anchored VWAP, with price positioned between the 2nd and 3rd VWAP deviation bands, signaling a clear overextension away from fair value. At these levels, upside continuation typically becomes increasingly inefficient.
This extension aligns with the formation of a bearish Crab harmonic pattern, which often develops near terminal phases of an advance. The Crab completion zone defines a technically significant area where buying pressure tends to fade and risk shifts decisively toward a reversal or mean-reversion move.
From a tactical standpoint, the setup favors a mean-reversion driven short position. A rejection within the deviation 2–3 VWAP zone would confirm distribution and increase the probability of a rotation back toward the Anchored VWAP and prior value area.
Bias: Short on rejection between VWAP deviation 2 and 3
Target: Mean reversion toward Anchored VWAP
Invalidation: Sustained acceptance above the 3rd VWAP deviation band
Context: Bearish Crab completion + VWAP deviation extension = asymmetric short opportunity

Will gold continue to rise to 4700-4800?Hello everyone. Let's discuss the gold market trend this week. On Tuesday, the gold market continued its slow and steady upward trend, moving in line with expectations. The main strategy was to buy on dips. Trading methods included either buying on sideways movement or buying on pullbacks. Following this framework, Tuesday's trading went smoothly.
Regarding global news:
1: The Venezuelan crisis continues to escalate, with the next trial scheduled for March 17th. This event has shocked the world and had a significant impact globally, serving as a wake-up call for countries worldwide. Let's briefly analyze it:
A: Currently, only Israel and Argentina support the US. European countries are collectively silent, threatening and intimidating the entire South American and even global markets. However, the resistance in South America has not diminished; this will exacerbate global tensions, such as in Cuba, Colombia, Mexico, and Greenland!
B: Anti-war sentiment is strong, and the Democratic Party is making a big deal out of it. Under widespread condemnation, the US aims to force Maduro to plead guilty, creating a closed loop in this situation.
However, this event marks a turning point in the international order; with the implementation of the US retrenchment strategy, a future confrontation between opposing camps in the Eastern and Western hemispheres is highly likely! The global situation is gradually heading towards an abyss.
2: In Europe, the Russia-Ukraine standoff remains unresolved; the fundamental reason is the uneven distribution of interests; as long as interests are unevenly distributed, a peaceful ceasefire is impossible!
3: In the Asia-Pacific region: the immediate priority is to stabilize the situation and prevent making the wrong choices at the wrong time; the actions of the US and Russia have already sounded the alarm—winning the war but losing politically and economically is still a loss; therefore, now is not the time for rash action, but rather to proceed cautiously and stabilize the situation.
4: In the Middle East: Israel continues its actions; Iran, facing internal and external troubles, is currently at its weakest point. The previously planned reconciliation between Saudi Arabia and Iran, and the constructed arc of resistance, have all been discarded by Iran as pawns. Given the current internal and external troubles, if the US continues to exert pressure, it's hard to guarantee that Khamenei won't become the next Assad! Then, the entire Middle East will face a completely drastic situation!
In summary: All four continents are experiencing unrest, with most raising their alert levels and continuously expanding their military forces to prepare for unforeseen events. From this perspective, safe-haven demand remains the main driver of the market; under this safe-haven environment, the gold market remains a reservoir for major funds!
Today's strategy:
1: On the daily chart, the stochastic oscillator has temporarily formed a golden cross, a bullish signal; in terms of pattern, it continues its upward trend with fluctuations. From the daily chart pattern, 4550 is not the high point; once it breaks through 4550, the next target is 4600, 4650, and then 4700. This probability is quite high given the current global situation, especially in 2026!
2: In the 4-hour timeframe, the stochastic oscillator is temporarily consolidating, while the MACD lines are trending upwards. In the short term, the 4-hour chart suggests a short-term correction around 4500. During this correction, support levels are difficult to predict due to potential price spikes. The current upward oscillation has created a support zone around 4440-4430.
In summary: The outlook for today's daytime session is bearish, with yesterday's 4500 level acting as resistance. Support levels are around 4440 and 4430. Short-term entry points should be considered around these two support levels. If the price breaks below 4550, a move towards 4570-4600 is possible.

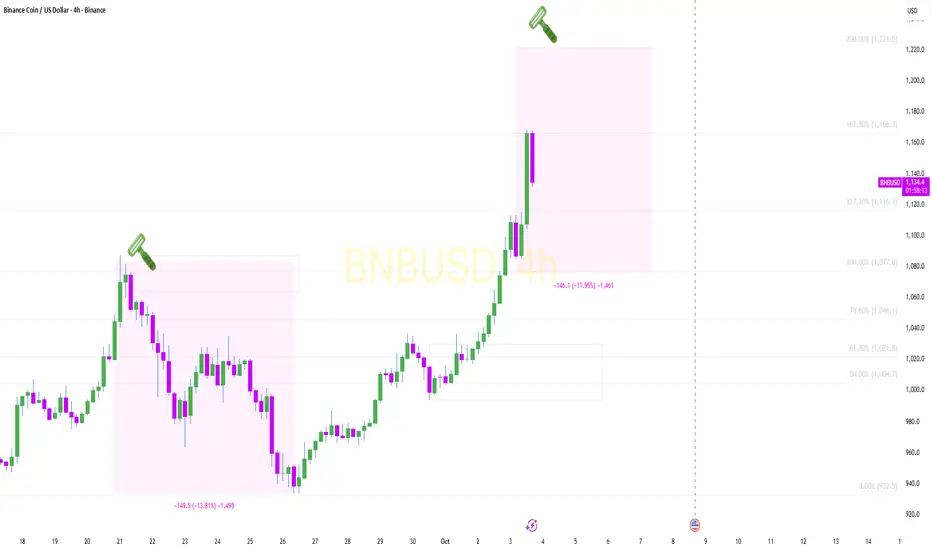
BNBUSD Short (14%)The coin's price action demonstrates a notable sensitivity to Fibonacci levels, experiencing minor pullbacks at 1.27, 1.618, and 0.618, while encountering more significant corrections at level 1.
A comparable decline observed at level 1 is anticipated to occur at level 2.
GBPJPY H1 | Bearish Drop OffBased on the H1 chart analysis, we can see that the price has reacted off the sell entry level at 211.37, which is an overlap support.
Our stop loss is set at 211.98, which is a swing high resistance.
Our take profit is set at 210.54, which is a pullback support.
High Risk Investment Warning
Stratos Markets Limited (

USOIL H4 | Bearish Reversal Off Key ResistanceBased on the H4 chart analysis, we could see the price rise to our sell entry level at 56.90, which is an overlap resistance that aligns with the 38.2% Fibonacci retracement.
Our stop loss is set at 58.35, which is a pullback resistance that lines up with the 78.6% Fibonacci retracement.
Our take profit is set at 55.18, which is a swing low support.
High Risk Investment Warning
Stratos Markets Limited (

XAUUSD: Profit-taking after breaking through the 4500Gold trades in a pattern of "rally then pullback - oscillating with a bullish bias" today. The bulls remain dominant but their momentum is marginally fading, which is a phase of profit-taking and high-level consolidation after breaking through the 4500 mark.
Immediate Support—4450–4460: Technically backed by the top-bottom conversion level and the 4-hour Bollinger Band middle track, it serves as the lower boundary of intraday oscillation. A breakdown will heighten the risk of a pullback.
Secondary Support—4437: Supported by the moving average and previous trading congestion zone, acting as the bulls' second line of defense.
Immediate Resistance—4495–4500: Technically reinforced by the round-number level, Bollinger Band upper track and previous high, serving as the key level for an intraday secondary breakout.
Secondary Resistance—4520: Located at the medium-term trading congestion zone; a breakout will open the way to the historical high.
Trading Strategy:
Buy 4450 - 4460
SL 4440
TP 4490 - 4500 - 4510
Sell 4495 - 4500
SL 4510
TP 4470 - 4460 - 4450

KIWI H4 | Bearish Reversal SetupBased on the H4 chart, we can see that the price has rejected off our sell entry level at 0.5793, which is a pullback resistance that aligns with the 50% Fibonacci retracement.
Our stop loss is set at 0.5827, which is a pullback resistance that aligns with the 78.6% Fibonacci retracement.
Our take profit is set at 0.5745, which is an overlap support.
High Risk Investment Warning
Stratos Markets Limited (

Stop!Loss|Market View: EURUSD🙌 Stop!Loss team welcomes you❗️
In this post, we're going to talk about the near-term outlook for the EURUSD currency pair☝️
Potential trade setup:
🔔Entry level: 1.16397
💰TP: 1.18024
⛔️SL: 1.15710
"Market View" - a brief analysis of trading instruments, covering the most important aspects of the FOREX market.
👇 In the comments 👇 you can type the trading instrument you'd like to analyze, and we'll talk about it in our next posts.
💬 Description: The US dollar found support midweek, but mood among the major currency pairs is mixed. The euro is expected to break recent lows, leading to a downward movement toward the 1.16000 - 1.16500 range. Potential buying setups can be expected in this area, given the liquidity of this price zone.
Thanks for your support 🚀
Profits for all ✅

AUD/USD corrects lower from the Crab completion; 261.8% is seen Following on from yesterday's report, AUD/USD continued its move to the upside, reaching the Crab formation target of 0.6768.
We have seen a corrective move lower.
Although it is tempting to call a top, the AUD single currency basket suggests further buying pressure.
The 261.8% extension level is located at 0.6782. Support is not seen until 0.6688
Conclusion: the preferred stance is to sell into higher gains. AUD/CAD is also the preferred cross for trading AUD.

GBP/USD profit taking seen close to the 261.8% extension level oGBP/USD continued to trend higher from the 1.3010 swing low posted on November 4.
Levels close to the 261.8% extension of 1.3552 have resulted in a profit-taking correction to the downside.
The first bespoke support level is located at 1.3462
Conclusion: although the immediate bias is skewed to the downside, I can see no clear reversal formations. I would look for a possible bearish head and shoulders pattern. This is a common reversal formation after a completed Elliott Wave count

Falling towards 38.2% Fib support?UK100 is falling towards the pivot, which acts as a pullback support that aligns with the 38.2% Fibonacci retracement and could bounce to the swing high resistance.
Pivot: 10,041.77
1st Support: 9,957.95
1st Resistance: 10,153.83
Disclaimer:
The opinions given above constitute general market commentary and do not constitute the opinion or advice of IC Markets or any form of personal or investment advice.
Any opinions, news, research, analyses, prices, other information, or links to third-party sites contained on this website are provided on an "as-is" basis, are intended to be informative only, and are not advice, a recommendation, research, a record of our trading prices, an offer of, or solicitation for, a transaction in any financial instrument and thus should not be treated as such. The information provided does not involve any specific investment objectives, financial situation, or needs of any specific person who may receive it. Please be aware that past performance is not a reliable indicator of future performance and/or results. Past performance or forward-looking scenarios based upon the reasonable beliefs of the third-party provider are not a guarantee of future performance. Actual results may differ materially from those anticipated in forward-looking or past performance statements. IC Markets makes no representation or warranty and assumes no liability as to the accuracy or completeness of the information provided, nor any loss arising from any investment based on a recommendation, forecast, or any information supplied by any third party

BTCUSD (4H) – Accumulation Completed | Liquidity → Expansion BTCUSD (4H) – Accumulation Completed | Liquidity → Expansion Phase
Bitcoin spent several weeks **distributing lower**, which forced late sellers into the market. Once sell-side liquidity was fully taken, price entered a **clear accumulation range** inside a **higher-timeframe demand zone (green area)**.
This is not random consolidation — it is **intentional price engineering**.
---
### 🔍 Market Structure Breakdown
* Strong bearish move → **sell-side liquidity taken**
* Price taps **HTF demand** and fails to continue lower
* Multiple rejections inside demand = **absorption**
* Range forms → weak hands get chopped out
* Recent impulsive candle = **bullish intent**
This behavior typically appears **before expansion**, not at tops.
---
### 🧠 Smart Money Concept at Play
Institutions don’t buy at highs.
They accumulate **when retail is scared** and price is ranging.
What we see here:
✔ Liquidity sweep
✔ Accumulation base
✔ Breakout with momentum
This is the classic **Accumulation → Expansion model**.
---
### 📈 Bias & Trade Plan
**Bias:** Bullish as long as price holds above demand.
**Entry idea:**
* Buy pullbacks into the upper part of the demand zone
* Or hold existing longs while structure remains intact
---
### 🎯 Targets (Liquidity Objectives)
* **100,000** – Psychological level (first magnet)
* **108,000 – 112,000** – Internal liquidity
* **111,000 – 116,000** – HTF supply / premium zone (main target)
Price moves from **discount → premium**. That’s the goal.
---
### 🛑 Invalidation
* A clean **4H close below the green demand zone**
This would invalidate the bullish structure.
---
### ⚠️ Risk Reminder
This is **not financial advice**.
Always manage risk and wait for confirmation.
📌 Follow **@FrankFx** for clean structure-based analysis, not hype.
---
If you want, I can:

$JASMY - H1 Quick Analysis$JASMY/USDT shows a clear bullish structure with a strong impulsive move upward.
The Order Block ($0.00841 – $0.00870) is acting as a solid support zone, aligning with institutional buying interest.
Entry: $0.00860 (within demand zone, optimal for risk-reward).
Stop Loss: $0.00800 (below structure → clean invalidation).
Target 1: $0.00950 (near prior swing liquidity).
Target 2: $0.01040 (major HTF resistance / next key liquidity area).
Bias: Bullish as long as price holds above $0.00840.

Bullish bounce off support?Bitcoin (BTC/USD) is falling towards the pivot, which is an overlap support, and could bounce to the 1st resistance.
Pivot: 91,518.84
1st Support: 90,244.05
1st Resistance: 93,303.53
Disclaimer:
The opinions given above constitute general market commentary and do not constitute the opinion or advice of IC Markets or any form of personal or investment advice.
Any opinions, news, research, analyses, prices, other information, or links to third-party sites contained on this website are provided on an "as-is" basis, are intended to be informative only, and are not advice, a recommendation, research, a record of our trading prices, an offer of, or solicitation for, a transaction in any financial instrument and thus should not be treated as such. The information provided does not involve any specific investment objectives, financial situation, or needs of any specific person who may receive it. Please be aware that past performance is not a reliable indicator of future performance and/or results. Past performance or forward-looking scenarios based upon the reasonable beliefs of the third-party provider are not a guarantee of future performance. Actual results may differ materially from those anticipated in forward-looking or past performance statements. IC Markets makes no representation or warranty and assumes no liability as to the accuracy or completeness of the information provided, nor any loss arising from any investment based on a recommendation, forecast, or any information supplied by any third party

XAUUSDMy **BEARISH** view on **XAU/USD** is LIVE! 🔻
Waiting for a pullback to the KEY zone ⏳... A **5-min Bearish Engulfing** 🕯️📉 pattern will be my signal to **SHORT!** 🚀🔥
#Forex #Trading #XAUUSD #TechnicalAnalysis #Bearish

Bullidh momentum to extend?GBP/CAD could fall towards the pivot which acts as a pullback support that is slightly above the 50% Fibonacci retracement and could bounce to the 1st resistance.
Pivot: 1.8546
1st Support: 1.8442
1st Resistance: 1.8750
Disclaimer:
The opinions given above constitute general market commentary and do not constitute the opinion or advice of IC Markets or any form of personal or investment advice.
Any opinions, news, research, analyses, prices, other information, or links to third-party sites contained on this website are provided on an "as-is" basis, are intended to be informative only, and are not advice, a recommendation, research, a record of our trading prices, an offer of, or solicitation for, a transaction in any financial instrument and thus should not be treated as such. The information provided does not involve any specific investment objectives, financial situation, or needs of any specific person who may receive it. Please be aware that past performance is not a reliable indicator of future performance and/or results. Past performance or forward-looking scenarios based upon the reasonable beliefs of the third-party provider are not a guarantee of future performance. Actual results may differ materially from those anticipated in forward-looking or past performance statements. IC Markets makes no representation or warranty and assumes no liability as to the accuracy or completeness of the information provided, nor any loss arising from any investment based on a recommendation, forecast, or any information supplied by any third party

LCIIf price holds above 300:
Target 1: 330 – 335
Target 2: 360 – 370
Target 3: 390+ (only if overall PSX sentiment remains strong)

ETHUSD SELL 3370On the daily chart, ETHUSD has stabilized and rebounded. Currently, attention should be paid to the resistance around 3370, which is a potential shorting position for a bearish bat, and it is also within the previous supply zone.
