Gold trading strategiesRecently, gold has experienced extreme one-sided price movements. Initially driven by expectations of Federal Reserve interest rate cuts, geopolitical safe-haven demand, and a surge in central bank gold purchases, it strongly broke through the 5500 and 5600 levels, reaching a new historical high, with bullish momentum fully unleashed. However, as prices surged rapidly, the RSI entered a severely overbought zone, leading to concentrated selling pressure from profit-taking and trapped positions. The market shifted from a one-sided surge to violent fluctuations and a high-level pullback.
From the current perspective, the long-term bullish logic remains unchanged, but the short term has entered a phase of risk release and technical correction. In terms of trading strategy, abandon blindly chasing highs and shift to a swing trading approach of "buying on dips at key support levels and cautiously shorting at key resistance levels," strictly controlling positions and stop-losses. Avoid trying to predict the top or trading against the trend, and adjust strategies based on volume and structural signals to capture certain returns amidst volatility.
Gold trading strategies
buy:5140-5160
tp:5200-5250-5300
Harmonic Patterns

Bear Case: Growth Stagnation & Profitability ErosionThe core argument is that Revolve's recent stock outperformance is disconnected from its underlying business metrics, which point to a company facing significant headwinds in customer acquisition, engagement, and profitability.
The Three Pillars of Underperformance:
Stagnant Customer Growth: Active customer growth of +5.7% annually over two years is anemic for a supposed growth-oriented digital native brand. It suggests market saturation, intense competition, or a failure to resonate with new customer cohorts.
Flat User Monetization: Average Revenue Per Buyer (ARPB) has been roughly flat over the same period. This indicates an inability to increase customer lifetime value or basket size, often a sign of a lack of pricing power or compelling new product categories.
Severe Profitability Compression: The most damning metric is the -10.5% annual decline in EPS against meager +3.4% revenue growth over three years. This reveals that growth (what little there is) is being achieved at a significant cost, likely through increased marketing spend, promotions, or operational inefficiencies, destroying shareholder value on a per-share basis.
The Critical Disconnect: Stock Price vs. Business Reality
The stock's +39.4% rally over six months creates a dangerous asymmetry:
The Narrative: May be driven by broader market sentiment, short-term "reopening" or "consumer resilience" trades, or technical factors.
The Fundamentals: Tell a story of a growth stock that is no longer growing profitably. A forward EV/EBITDA of 20.2x is a rich valuation typically reserved for companies with strong, profitable growth trajectories—a profile Revolve currently lacks.
Investment Implications & Risk Assessment
Why This Justifies an "Underperform" Rating or "Avoid" Stance:
Valuation at Risk: The stock is priced for a recovery or acceleration that is not evident in the KPIs. Any earnings miss or guidance reduction could trigger a severe multiple contraction.
No Visible Catalysts: The analysis identifies no clear path to re-accelerate customer growth or ARPB. Without a major strategic shift or successful new initiative, the current trends are likely to persist.
Downside Protection is Weak: With EPS declining, the "E" in the P/E ratio is shrinking, which can accelerate price declines even if the multiple holds steady.
Potential Counterarguments (The Bull Case, If Any):
A contrarian might argue:
Operational Leverage Potential: If management reins in costs, even flat revenue could lead to significant EPS improvement.
Brand Resilience: The core brand and loyal customer base have value; a successful new category launch (e.g., activewear, beauty) could re-engage users.
Market Overreaction: The negative trends may be fully priced in, and any slight positive surprise could spark a rally.
However, these are hopes, not evidence-based catalysts. The fundamental data overwhelmingly supports caution.
Final Judgment
Revolve appears to be a classic case of "fading the rally." The quantitative evidence paints a clear picture:
Growth is stalling (weak customer adds).
Monetization is stuck (flat ARPB).
Profitability is deteriorating (sharply falling EPS).
A forward EV/EBITDA of 20.2x for a company with this profile is difficult to justify. The recent price action looks more like a bear market rally or short covering than a sustainable recovery founded on business improvement.
Recommendation: The prudent action is to avoid or sell RVLV. The risk/reward is skewed to the downside. Investors should wait for concrete, sustained improvements in active customer growth, ARPB, and—most critically—EPS trajectory before considering a position. There are likely higher-quality growth or consumer discretionary stocks with better-aligned fundamentals and valuations.

$TDY - A Strong Quarter with a Cautiously Optimistic, ExecutionOverall Assessment: A Strong Quarter with a Cautiously Optimistic, Execution-Dependent Outlook
Teledyne delivered a solid beat-and-raise quarter, showcasing effective portfolio management toward higher-margin, defensible markets (Defense/Imaging) while navigating a mixed commercial recovery. The market's positive reaction is justified by the significant margin expansion and earnings beat. However, guidance for 2026 is in-line with expectations, indicating management sees steady, not accelerating, growth ahead.
Key Positive Takeaways from Q4 & The Call:
Defense & Imaging Strength is the Core Engine:
The ~20% growth in infrared components for unmanned systems (Teledyne FLIR) and record marine instrumentation sales underscore Teledyne's competitive moat in high-tech defense and sensing.
The first production contract in the loitering munition market and the >$100M tracking layer satellite award are concrete wins that validate the strategy and provide multi-year revenue visibility.
Impressive Margin Execution:
A 470 bp expansion in operating margin (to 20.4%) and a record 24.7% margin in Digital Imaging are the standout financial achievements. This was driven by cost control, mix shift toward higher-margin defense work, and the integration of acquisitions.
Prudent and Flexible Capital Allocation:
Management's commentary on M&A vs. buybacks is revealing. Their preference for "small, tuck-in acquisitions" (like Didi Scientific) over aggressive buybacks suggests a continued focus on strategic bolt-ons that enhance technology portfolios. Their openness to larger deals "if the quality is right" and increased optimism for 2026 opportunities signals confidence in their balance sheet and the deal pipeline.
Detailed Growth Outlook & Analyst Q&A Insights:
Q: More details on the revenue growth outlook, particularly organic vs. inorganic?
A: Management provided clear granularity. The 2026 growth profile is expected to be:
Organic Growth: ~3.6%. This is modest but broad-based, led by Marine Instruments (~5%) and Digital Imaging (just under 5%).
Inorganic Growth: Slightly over 4%, stemming from recent acquisitions.
Takeaway: The growth is balanced and not reliant on a single mega-deal. The emphasis on organic growth in core imaging and marine segments is a sign of underlying market health.
Q: Outlook for the unmanned business?
A: The unmanned systems portfolio (air, ground, maritime) is a key growth vector. At ~$500M in 2025, it's a substantial business. The forecast of ~10% growth to $550M in 2026 highlights it as a faster-growing segment within the defense umbrella, benefiting from multi-domain military modernization trends.
Q: How do you view M&A vs. share repurchases?
A: This answer clearly outlines Teledyne's capital allocation hierarchy:
Strategic Acquisitions (Priority): Focus on small, technology-focused "tuck-ins." They are "more encouraged" about deals in 2026.
Opportunistic Share Repurchases: Used only when the stock is perceived as "undervalued," implying buybacks are a secondary tool for capital return.
Takeaway: Investors should expect continued disciplined M&A as the primary use of cash, not large buyback programs.
Risks & Challenges to Monitor (The "Negative Points"):
Commercial Segment Volatility: Weakness in X-ray detectors/scientific cameras and a delayed rebound in protocol analyzers (tied to chip producer delays) show exposure to cyclical semiconductor and industrial capital spending.
Integration Drag: Lower margins in recently acquired A&D electronics businesses and the slight margin dip in Instrumentation remind us that acquisitions carry integration risk and can temporarily dilute metrics.
Contract Timing Risk: The 9.9% revenue decline in Engineered Systems due to delayed awards is a classic example of lumpy government contracting, which can create quarterly volatility.
Investment Thesis Summary
Teledyne is a high-quality, defensively-positioned industrial technology company firing on most cylinders. Its strengths are:
A Moat in Niche Imaging & Sensing: Dominant in infrared, marine instrumentation, and specialized test & measurement.
Aligned with Secular Defense Trends: Unmanned systems, precision munitions, and space-based sensing are budget priorities.
Superior Profitability: Demonstrated ability to expand margins significantly through operational discipline.
The primary question for 2026 is not about survival, but about the pace of growth. The stock's performance will likely hinge on:
Catalyst 1: Execution on the ~10% growth target for the unmanned business and ramp-up of the tracking layer contract.
Catalyst 2: A recovery in short-cycle commercial businesses (like protocol analyzers) in the second half of the year.
Catalyst 3: Successful integration of acquisitions and the announcement of new, value-accretive tuck-in M&A deals.
Verdict: Teledyne represents a lower-risk, steady-growth holding within the industrials/defense sector. It is less about explosive upside and more about durable competitive advantages, margin resilience, and savvy capital allocation. The in-line 2026 guidance suggests the current valuation likely reflects its steady prospects, making it a "hold" for growth-at-a-reasonable-price (GARP) investors, with any significant pullback potentially offering a more attractive entry point.

UAA - Will Under Armour Survive?Sell Thesis for Under Armour (UAA) – A Compilation of Concerns
The consensus view, supported by the financial metrics and recent performance, suggests Under Armour is a "Sell" or "Avoid." The risks appear to outweigh the potential rewards at the current valuation.
1. Stagnant Growth & Market Share Erosion
The Core Problem: The "weak constant currency growth over the past two years" is the most critical red flag. In the competitive athleisure market, where Nike, Lululemon, and Adidas are fighting for wallet share, a lack of growth implies Under Armour is losing relevance. Consumers are not connecting with the brand's performance-focused identity as strongly as they do with competitors' blend of performance, lifestyle, and fashion.
Broader Context: This isn't just a post-pandemic hangover; it reflects deeper issues in brand positioning, product innovation, and marketing effectiveness.
2. Deteriorating Profitability and Poor Capital Allocation
A Vicious Cycle: The "diminishing returns on capital from an already low starting point" is a severe indictment of management's strategy. It indicates that investments (in marketing, new product lines, retail stores, or technology) are not generating adequate profits. This erodes shareholder value and limits funds available for future, more productive investments.
Questionable Strategy: This metric suggests past bets (e.g., heavy investment in connected fitness with the MapMyFitness acquisition era, or a push into broader lifestyle categories) have not paid off, and the current turnaround plan under new CEO Kevin Plank (who returned in 2024) has yet to demonstrate traction.
3. A Dangerous Debt Load
Financial Vulnerability: A "high net-debt-to-EBITDA ratio of 7×" is alarming for a retailer. It severely limits strategic and financial flexibility. In a high-interest-rate environment, servicing this debt is costly. If sales weaken further or margins contract, the company could face a liquidity crisis.
Potential Outcomes: As noted, this could force distressed asset sales (potentially selling valuable intellectual property or divisions at a discount) or highly dilutive equity financing (issuing new shares at low prices, hurting existing shareholders), both of which would be negative catalysts for the stock.
4. Unsustainable Valuation
Trading on Hope, Not Results: A forward P/E of 51.3x is extraordinarily high for a company with no growth and significant financial risk. For comparison, mature, profitable companies with steady growth typically trade in the 15x-25x range. This multiple implies investors are pricing in a dramatic and immediate turnaround that, given the points above, seems highly uncertain.
Downside Risk: The consensus price target of $6.19 (-2.2% implied return) suggests analysts see minimal upside and significant potential for a valuation contraction if growth and profits fail to materialize. The stock could easily re-rate to a lower multiple, leading to a steep decline.
The Counterargument (The "Hold" or "Speculative Buy" Case)
A contrarian view would hinge on:
CEO Kevin Plank's Return: The founder's return could refocus the brand on its performance roots and improve execution.
Cost-Cutting Initiatives: Ongoing restructuring could boost margins in the medium term.
Deep Value Play: If the turnaround succeeds, the stock could rebound sharply from a multi-year low.
However, the preponderance of evidence—stagnant growth, poor profitability, high debt, and a sky-high valuation—makes the bear case far more compelling. The current stock price appears to discount a successful turnaround that is not yet visible in the company's financials.
In summary, Under Armour presents a high-risk profile with multiple fundamental headwinds and an unjustifiably rich valuation. The prudent action, based on this analysis, is to avoid or sell the stock until concrete evidence of a sustainable operational and financial turnaround emerges.

$IBRXSnapshot of Current Situation
Recent Performance: IBRX experienced an explosive 271% gain in January 2025, driven by strong Anktiva sales data and positive clinical trial momentum. This was followed by a predictable profit-taking pullback, with the stock declining for three consecutive sessions.
Catalyst Ahead: The company is poised to announce detailed results from its QUILT-3.078 Phase 2 study in glioblastoma (GBM), a high-need area with limited treatment options. Early data (19 of 23 patients alive, manageable safety) is promising but preliminary.
Divergent Expert Views: A stark contrast exists between the market's bullish reaction and the caution from figures like Jim Cramer, who has historically criticized the company's long-term losses despite its recent massive rally.
Critical Factors for Investors to Consider
The Bull Case: Transformational Potential
Commercial Acceleration: A 700% year-over-year jump in Anktiva sales signals successful commercialization and strong market uptake for its approved bladder cancer therapy.
Pipeline Catalysts: The upcoming GBM data is a major binary event. Positive results could significantly expand the addressable market and validate the platform's potential in solid tumors.
Technical Momentum: The sheer scale of the recent rally indicates powerful institutional and retail interest, which can be self-reinforcing in the biotech sector.
The Bear Case & Significant Risks
Profitability Concerns: Cramer's central critique—"they've been losing money forever"—remains valid. The company must translate soaring sales into a sustainable path to profitability.
"Buy the Rumor, Sell the News": The stock may have already priced in significant optimism. The GBM data release is a high-risk event; even good data could trigger a sell-off if it doesn't exceed heightened expectations.
Volatility & Valuation: After such a parabolic rise, the stock is highly susceptible to sharp corrections. Valuation metrics are stretched, making it vulnerable to any negative news.
Synthesizing the Cramer Commentary
Cramer's advice embodies a classic trading approach to high-flying biotech stocks:
May 2025: His dismissal of IBRX as "not a great stock" was based on fundamental financials (chronic losses). The market subsequently proved this view too narrow, as it focused on clinical and commercial catalysts.
Recent Take: His current advice to "take profits in some of that, not all of it" is a pragmatic response to the massive run-up. It acknowledges the stock's momentum while advising risk management against a potential steep pullback.
Conclusion: A High-Stakes Balancing Act
ImmunityBio presents a classic biotech dichotomy: spectacular near-term catalyst-driven momentum versus long-term fundamental financial risk.
For existing holders, Cramer's advice to take partial profits is a prudent strategy to lock in gains while maintaining exposure to the upcoming GBM data catalyst.
For potential new investors, entering at this level is highly speculative. It amounts to a leveraged bet on the GBM data exceeding expectations and the company's ability to sustain its commercial growth to eventually justify its valuation.
The immediate future hinges almost entirely on the detailed GBM data. The market will scrutinize not just overall survival, but progression-free survival, quality of life metrics, and the depth of response. Strong data could reignite the rally, while ambiguous or disappointing data could lead to a severe correction.
In essence, IBRX is no longer a story of "if" its therapy works—Anktiva's sales prove it does. The story is now about "how big" the opportunity can become and "how soon" the company can turn transformative science into sustainable profits. The next few weeks will be critical in answering those questions.

BSE LTD | BTR Pro 36 Points | 29 Jun 2026BSE LTD | Intraday Setup | 29 Jun 2026
✅ BUY Entry: 2830
🛑 Stop Loss: 2800 (30 pts risk)
🎯 Target 1: 2848 ✅ (+18 pts)
🎯 Target 2: 2866 ✅ (+36 pts)
📌 Clean execution with BTR PRO SL + Targets
📌 No noise. No emotions. Only rule-based trading.
💬 Follow for daily BTR PRO updates & setups

$AAPLBased on Apple's Q1 2026 earnings report, the company has delivered a performance that can be characterized as a powerful "iPhone Renaissance," driven by explosive growth in critical international markets, particularly China. This success comes amid a narrative of perceived lag in artificial intelligence (AI), suggesting a strategic divergence where hardware execution and ecosystem strength are currently outpacing the market's fixation on AI features.
Analysis of Key Performance Drivers:
1. The iPhone's Record-Breaking Resurgence:
The iPhone is undeniably the core engine of this quarter's success. With revenue soaring to $85 billion (a 23% year-over-year increase), it shattered its own records. This was not a broad-based upgrade cycle but a targeted success story for the iPhone 17 and 17 Pro, indicating that Apple's product innovation—likely in areas like camera technology, battery life, or design—resonated profoundly with consumers. The narrative of "unprecedented demand" and "all-time records across every geographic segment" underscores a product-led recovery.
2. The Remarkable China Reversal:
The most significant narrative shift is in Greater China, where sales surged 38% to $25.5 billion. CEO Tim Cook's declaration that this was the "best iPhone quarter in history" in the region decisively counters previous concerns about Apple's declining relevance in the face of intense local competition. Key indicators of this success include:
Record Installed Base: Reaching an all-time high in both Greater China and mainland China, suggesting successful market penetration beyond just new sales.
Strong Retail Traffic: "Strong double-digit" growth in store traffic year-over-year, pointing to robust consumer interest and engagement.
This performance demonstrates Apple's enduring brand power and its ability to reignite growth in its most scrutinized market through compelling products.
3. Strategic Diversification in Growth Markets (India):
Apple is systematically building its second major growth pillar in India. The company set all-time revenue records across multiple product categories (iPhone, Mac, iPad) and services in the country. Cook's specific reference to India as the world's second-largest smartphone market highlights a deliberate and successful strategy to replicate its China playbook—cultivating a premium brand image and expanding its ecosystem in a massive, emerging market.
4. Broad-Based Geographical Strength:
The growth was not isolated. Significant increases in the Americas (up to $58.5B) and Europe (up to $38.1B) confirm a global uplift. This universal performance reinforces the strength of the iPhone 17 cycle and suggests macroeconomic or consumer spending trends are favorable to Apple's premium positioning.
Strategic Context and Market Narrative:
The AI Paradox vs. Hardware Execution:
A central tension in Apple's story is the contrast between Wall Street's anxiety over its perceived slow AI rollout and the overwhelming consumer demand for its core hardware. As analyst Thomas Monteiro noted, the market may be "overly fixated on splashy AI" while consumers are prioritizing "execution, pricing discipline, and ecosystem reliability." Apple's partnership with Google's Gemini for Siri and the promise of a "more personalized Siri" in 2026 show a pragmatic, partnership-driven approach to AI, rather than a race to launch first-party foundational models. This quarter proves that, for now, superior hardware and ecosystem integration remain Apple's primary competitive moat.
Financial Fortitude and Future Roadmap:
The record $143.8 billion in total revenue and earnings beat provide Apple with immense financial fuel. This allows it to:
Weather AI Investment: Fund its substantial, long-term R&D investments in AI, silicon, and new product categories (like the rumored 2026 folding phone) without immediate pressure to show returns.
Strategic Flexibility: Maintain pricing discipline and avoid desperate moves to chase AI headlines.
Conclusion and Forward Outlook:
Apple's Q1 2026 results represent a masterclass in leveraging its core strengths. The company has successfully executed a product-led revival in its most important hardware line, simultaneously silencing doubts in China and accelerating its strategy in India. While the AI question remains a critical long-term challenge, this quarter demonstrates that Apple's fundamentals—iconic product design, a sticky global ecosystem, and premium brand loyalty—can drive monumental financial results independently.
The road ahead will involve balancing this hardware momentum with the imperative to meaningfully integrate AI across its devices and services. The anticipated folding phone launch and the evolution of Siri will be key tests. However, for the immediate future, Apple has reaffirmed that its product cycle and international market execution are powerful forces capable of delivering historic growth.

Ethereum longBullish shark. Targeting 0,382-0,618 for a short term rally. Still in the solana short.

BTC bull run ended!?!?!? High probability 126k was the topBTC bull run ended!?!?!? High probability 126k was the top. Very high probability.

Gold Short-Term Trading Plan!Gold was very crazy yesterday. It went up to near 5600 and dropped almost 5000 pips to 5098 and closed above 5300. Nowadays, it can easily went up and down by 1000 pips. As it has re-entered the previous channel, I am expecting it to continue to fall at least to channel bottom again and go up from there.
Therefore, I will sell at 5407 and buy from around 5250.

NZDCHF - 1D - LongThe price executed a perfect Head and Shoulders pattern, then reacted from the 50% equilibrium zone, which pushed the price into a correction that coincided with a perfect test of the Head and Shoulders pattern. I expect the price to test in the downward direction to test the 50% equilibrium zone and from there to continue its upward movement to execute the BB, as well as reach the first target zone of Supply and close imbalances in the upward direction, as well as pursue a high target on the Golden Fibonacci in the area of 0.47900.

USDCHF - 4H - LongThe price perfectly fulfilled the initial forecast until reaching the target of BB, which coincides perfectly with the Demand zone and OV. From here we expected a reaction in the upward direction for a correction and the first target is the Supply zone, after which we expect it to be broken and continue in the upward direction until reaching the OTE zone + closing the Gap above the Supply zone.

USDJPY -1W - ShortThe price has bounced off the weekly base and is heading in a downward direction to execute the TP of the Gartley formation in a downward direction. Perfect execution of the TP of the base with a tail, which in turn coincides perfectly with the Demand zone. I expect Demand to be broken and after reaching the equilibrium of 151,400 /important number/ we expect the price to show a reaction from there.

Beautifully making HH HL. FATIMA
Closed at 169.12(29-01-2026)
Beautifully making HH HL.
Possibility of re-testing the Breakout Level
around 157 - 160 & print HL.
Crossing 187 - 188 may lead it towards 199 - 200
& then around 213 - 215.
It should not break 143 now.

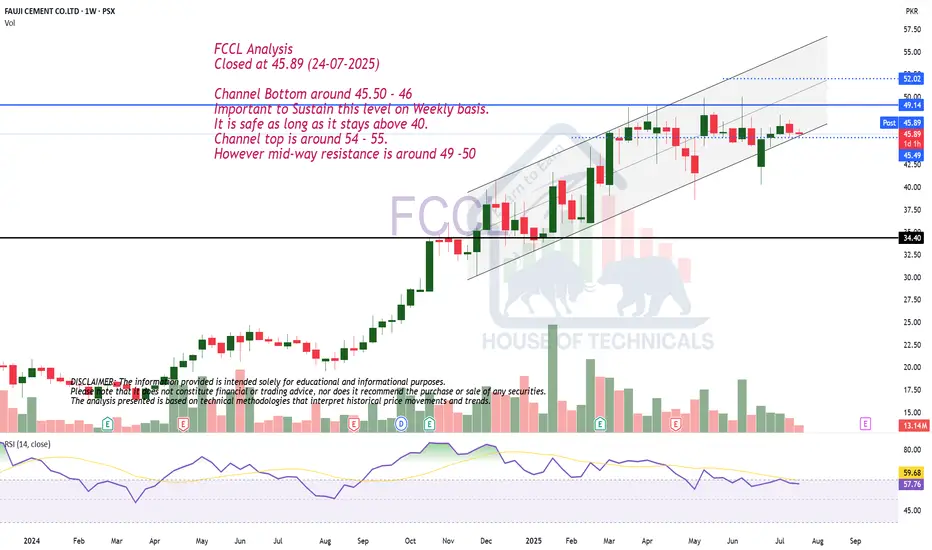
Channel TradingFCCL Analysis
Closed at 45.89 (24-07-2025)
Channel Bottom around 45.50 - 46
Important to Sustain this level on Weekly basis.
It is safe as long as it stays above 40.
Channel top is around 54 - 55.
However mid-way resistance is around 49 -50
SEGG - Big Opportunity!1. Resolution of Legacy Legal and Regulatory Challenges:
The company has achieved a significant milestone with the dismissal of the remaining claims in a key legacy lawsuit, Lottery.com, Inc. et al. v. John J. Brier, Jr., et al. The U.S. District Court dismissed the state-law counterclaims without prejudice, following the prior dismissal of all federal claims, on the grounds of lacking subject matter jurisdiction. This represents a procedural victory, closing a legal chapter and allowing management to focus resources elsewhere. Concurrently, SEGG Media is addressing a separate SEC civil complaint filed against certain former executives and the company itself, relating to conduct from 2020 to mid-2022. The company emphasizes that the individuals involved are no longer affiliated with SEGG, that current leadership was not involved, and that it has fully cooperated with the SEC. While prepared to defend itself, SEGG is engaged in settlement discussions and believes the matter is close to resolution "without material liability." This dual progress in litigation indicates a concerted effort to clear the deck of past controversies.
2. Strategic Transformation and Operational Focus Under New Management:
The press release strongly underscores a complete corporate transformation since mid-2022. The new management team highlights having "completely cleaned house," implementing substantial changes to governance and internal controls, and achieving compliance as evidenced by an effective Form S-3 registration statement. Their strategic focus is explicitly outlined: developing core digital assets (Sports.com, Concerts.com, TicketStub.com, Lottery.com), driving revenue growth, and completing "cash-generative strategically-targeted acquisitions." The mention of specific acquisition targets like Veloce Media Group and Nook Holdings Ltd. provides concrete direction to their growth strategy. The company's identity is being reshaped as a "global sports, entertainment, and gaming group" focused on "immersive fan engagement, ethical gaming and AI-driven live experiences."
3. Prudent Financial Restructuring and Capital Strategy:
A critical component of the new strategy is a more conservative and shareholder-friendly financial approach. SEGG Media announced the termination of two previously disclosed financing arrangements:
The termination of a note and securities purchase agreement with Evergreen Capital Markets LLC, under which it will not draw the remaining $2 million available.
The termination of a substantial $150-million loan agreement with United Capital Investments London Limited (UCIL), which the company states will prevent "significant equity issuances or related large dilution."
These actions signal a deliberate shift away from potentially dilutive or restrictive financing. The company states it does not anticipate "any large financing transactions that would be highly dilutive to existing shareholders." This recalibration is paired with an active capital-raising effort, as indicated by a public offering (with a prospectus on file with the SEC) that has reportedly increased the shareholder base by 68% (over 3,600 new shareholders) in the preceding 30 days. The strategy appears to balance growth funding with dilution management.
4. Forward-Looking Emphasis on Sustainable, Cash-Flow Positive Growth:
The overarching narrative is one of sustainability and financial discipline. The management's commitment is repeatedly framed around avoiding financial strain. They explicitly state an intention not to pursue acquisitions that involve "significant ongoing cash requirements" or lack "proven business models with clear paths to revenue, profitability and positive cash flows." Instead, the focus is squarely on integrating "cash-generative businesses." This language is aimed squarely at investor concerns about burn rates and speculative spending, positioning SEGG as a company transitioning to a stable, operational growth phase rather than a speculative venture.
In summary, SEGG Media's press release paints a picture of a company actively shedding its problematic past through legal resolutions and management overhaul. It is pursuing a clearly articulated growth strategy centered on its digital asset portfolio and strategic acquisitions, but is coupling this ambition with a newly emphasized financial prudence aimed at protecting shareholder equity and prioritizing profitability and positive cash flow. The success of this transformation will hinge on the execution of its acquisition strategy and the revenue performance of its core assets.
Based on a technical analysis framework, the price action for this security has established five distinct profit-taking targets, derived from common Fibonacci extension levels. These predetermined exit points are calculated to systematically secure gains at key intervals as the price advances. The targets, along with their corresponding price values, are as follows:
The first take-profit level is set at the 0.236 Fibonacci extension, which corresponds to a price target of $15.22.
The second take-profit level is set at the 0.382 Fibonacci extension, which corresponds to a price target of $24.35.
The third take-profit level is set at the 0.5 Fibonacci extension, which corresponds to a price target of $31.73.
The fourth take-profit level is set at the 0.618 Fibonacci extension, which corresponds to a price target of $39.11.
The fifth and final take-profit level is set at the 0.786 Fibonacci extension, which corresponds to a price target of $49.62.
This tiered structure allows for the partial realization of profits at each significant resistance level identified by the Fibonacci sequence, managing risk and locking in returns progressively throughout the upward move.

DXY Institutional Analysis: The Bearish Shark "Liquidity Executive Summary: The US Dollar Index (DXY) has completed a textbook Bearish Shark Harmonic Pattern on the 5-minute timeframe. This structure, often mistaken for a Cypher, is distinguished by its aggressive "Liquidity Raid" mechanics. The pattern successfully trapped long-side breakout traders at the 96.65 terminal high and has since engaged a verified reversal sequence, currently trading at 96.28.
1. The Pattern Identification: Shark vs. Cypher While similar to the Cypher, the Shark Pattern is unique because its final leg (Point D) breaks above the initial starting high (Point X).
Point X (Structure High): 96.45
Point D (The Trap): 96.65
The Mechanism: The algorithm pushed price above Point X solely to trigger buy-stops and trap retail breakout traders ("The Fake-Out"). Once the liquidity was absorbed at 96.65, the reversal was mathematically guaranteed.
2. Validation & Current Status
Terminal Point (D): 96.65 (Rejection Confirmed)
Current Price: 96.28
Status: ACTIVE & CONFIRMED. The DXY has not only rejected the 96.65 high but has smashed through the initial 50% retracement support at 96.40. The speed of the drop from the high confirms that the "Smart Money" has unloaded their long positions.
3. Forward Vector & Targets With the "Shark" bite confirmed, the DXY is now seeking the origin of the move.
Immediate Target: 96.20 (88.6% Retracement).
Macro Implication: A failure of the DXY at these levels provides the direct inverse fuel for risk assets and major currencies (EUR/USD) to expand higher.
Conclusion: The 96.65 high was not a breakout; it was a "Stop Hunt." The subsequent drop to 96.28 validates the Bearish Shark structure. The Dollar is now structurally heavy, clearing the runway for the next leg of the macro trend.

VZ Post-Earnings Setup – Defined-Risk Bull & Bear SpreadVerizon (VZ) Earnings Trade – 2026-01-29
Bearish (Contrarian): Katy AI predicts "sell the news," downside to $39.57 (VWAP + 50MA support), moderate confidence (~58%), risk of post-earnings fade if guidance disappoints.
CORE THESIS: Despite Polymarket pricing a 79% probability of an earnings beat, Katy AI anticipates a "sell the news" disappointment with price gravitating toward VWAP support at $39.57, creating a high-probability bearish setup against crowded consensus long positioning.
Key Numbers:
Current Price: ~$40.00
Target Upside: $40.75 (Bullish scenario)
Target Downside: $39.57 (Bearish scenario)
Implied Move: ~$1.44–$1.51 (~3.6–3.8%)
IV Rank: 20–22% → cheap options
Options Strategy:
Bull Call Spread (Conditional Bullish): Buy $40 Call / Sell $41 Call, 0DTE
Breakeven: ~$39.60
Extra Notes:
Market is pricing a ~3.6–3.8% move while historical post-earnings moves are ~1.6% → opportunities for defined-risk spreads.
Neutral put/call ratio and equal unusual activity suggest institutional hedging; no strong directional bias.

QS Verizon Earnings – Beat Consensus Could Trigger Upside MoveVZ Earnings Trade – 2026-01-29
Signal: 🟢 Bullish (Conditional)
Target Price: ~$40.75 (Breakout toward 200-day MA)
Options Strategy: Bull Call Spread (limits risk, captures upside)
Buy: $40.00 Call
Sell: $41.00 Call
Expiry: 2026-01-29 (0DTE)
Cost: $0.40 per spread
Max Profit: $0.60 per spread
Breakeven: $40.40
Extra Notes:
Market is pricing 3.8% move; historically VZ moves ~1.6% → upside could be underpriced
Neutral institutional options flow (Put/Call 1.0) → Polymarket beat probability gives the edge
Use defined-risk spread to control premium while targeting ~+2% move

JPM TO LEAD RALLY FOR DJIThe chart is my view of JPM I had picked up a position in Call at 299 but Sold today As I had a nice gain But as you can see the labeling I am looking for the next and most likely The final rally in the banks This sector should take The DJI To above The target 50450 in the DJI by early feb By the 9th to be clear . This is my next group of Spirals See charts posted today for the MAJOR turn THE TOP /

DOES GOLD SELL PRESSURE BUILDS AFTER PROFIT TAKING ?Gold is trading around 5515 after a sharp news-driven acceleration into the 5600 resistance zone.
The vertical impulse above the rising trendline created a visible spike and imbalance near the all-time-high area, which often reflects short-term exhaustion rather than sustainable continuation.
Current structure suggests buyers may pause as momentum cools. If price fails to hold acceptance above the 5600 resistance, a retracement toward the 5450 support and potentially the 5375 zone becomes more likely, where prior range highs and trendline support converge.
I’ll continue monitoring how price behaves around these key levels to assess the next directional move.

ACHR at Oversold Levels: Why Smart Money Is Buying CallsACHR QuantSignals V4 Weekly 2026-01-29
🛠️ Trade Setup (Preferred)
Primary Contract: $8.00 CALL
Expiration: This Friday (Weekly)
Entry Cost: ~$0.05–0.08
Trade Type: Speculative / Small Size
Edge: High gamma, low capital risk
Alternate (Safer):
$7.50 CALL — lower gamma, higher premium
🎯 Profit Targets
Target 1: $8.00 (trim / risk-off)
Target 2: $8.13–8.16 (full thesis)
Expected Option Return: 100%+ if target hits
Invalidation: Lose & hold below $7.40
Max Risk: Premium only (≤1% account)
Rule: No averaging down
Note: Low volume → respect stops
⚠️ Trade Risks
Weak follow-through due to thin liquidity
Broader market risk-off pressure
Bounce may stall at 50-DMA

QS V4 ELITE — META Weekly Mean-Reversion SignalMETA QuantSignals V4 Weekly 2026-01-29
Directional Bias
Primary Bias: Bearish (Mean Reversion)
Conviction: Moderate
Regime: Neutral (Counter-trend pullback)
🧠 Why This Trade Works (Quick Read)
META is overbought (Weekly RSI 71.2)
Price is pressed into $744 hard resistance
Stock is +13% above 50-DMA → stretched
Broad tech selling (QQQ -1.29%) increases downside pressure
Katy AI targets $675–680, aligning with 200-DMA
🎯 Key Levels
Resistance: $744 (Gamma Wall)
Near-Term Support: $720
Major Support / Target Zone: $680–675
Weekly VWAP: $686.79
🛠️ Trade Setup (Institutional Style)
Expiration: This Friday (Weekly)
Ideal Entry: Near $732–738 rejection
Risk: Defined (premium only)
🎯 Targets
Target 1: $720 (Partial trim)
Target 2: $700–690
Stretch Target: $680–675 (Katy AI + 200DMA)
🛑 Risk Management
Invalidation: Clean break & hold above $745
Max Risk: 1–2% of account
Rule: No averaging down
Options Flow Read
Put/Call: 1.0 (Neutral)
Interpretation: Late call buyers at resistance → fuel for pullback
Smart Money: Quiet put positioning at $727.5P / $732.5P
