1322 AMAK D1 - 6/5/2024 (TASI Market)1322 AMAK D1 - 6/5/2024 (TASI Market):
Elliott Wave
Trend Analysis
Harmonic
Regards,
0.43SAR
54.58 MSAR
487.89 MSAR
49.87 M
About ALMASANE ALKOBRA MINING CO
Sector
Industry
CEO
Yahia M. Al-Shangiti
Website
Headquarters
Najran
Founded
2008
ISIN
SA15HG50KL10
FIGI
BBG015D28KV1
Al Masane Al Kobra Mining Co. engages in the exploration, exploitation, and operation of mines. It operates the Al Masane Copper Zinc Mine and Guyan Gold Mine. The company was founded by Mohammed bin Manaa bin Sultan Aballala and Ali bin Musallam Ibrahim in 2008 and is headquartered in Najran, Saudi Arabia.

Cup & Handle FormationsEntry can be taken at CMP or around 59.50
with a Stoploss of 57 (closing basis)
However, more secure Stoploss would be 54.50
(on closing basis)
For Daily + Weekly Cup & Handle Targets,
Important level to Sustain is 62 - 64


1322 seems to be a long term up stockthe stock is potential for long term uptrend ..I am in as an investor for not less than 3 months.
good luck

ANALYSIS ON 1322Dear Saudi Traders and Investors, I'm making this analysis on 1322 to tell you NOT TO BUY 1322 since there's a low volume and the price is heading towards the level 1 of the Pitchfork, the right thing to do in this case is to wait for the price to come back with a confirmation then you can buy.
L

QUICK ANALYSIS ON 1322Dear Saudi Investors, I saw in a group long ago some people talking about buying 1322, last Friday when I checked the posts I found that most of them have bought and looking for a point where to close with minimal losses.
The reason why I'm posting this is to tell you not to buy 1322 currently sinc

1322 Waiting to break downtrendPrice at support level, waiting to break the downtrend
details on the chart
Boost, Comment and Follow for more
Stay Safe, Blessed Ramadan!

Quick analysis on 1322Good afternoon dear Saudi investors.
On 1322, You can notice again that the price is consolidating on a channel for the past 8 months and still couldn't break through it, my advice for you is not to put you money in this stock until it gets through the channel since it will be worthless to take the

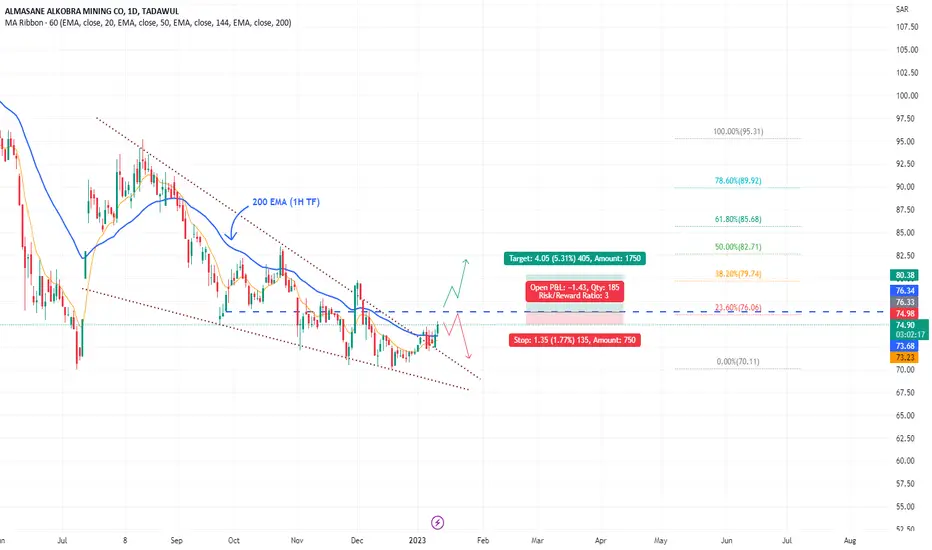
1322: AlKobra Mining (Falling Wedge; Watch for Breakout)Price within Falling Wedge
Breakout observed crossing top of falling wedge (resistance)
Formation of HH, HL
Support from 200EMA (1H TF); Imposed on Daily Chart
Entry at current level (Aggressive)
Watch for breakout of Horizontal support (Conservative Entry)
Trade with stop Loss (Risk:Reward Ratio)
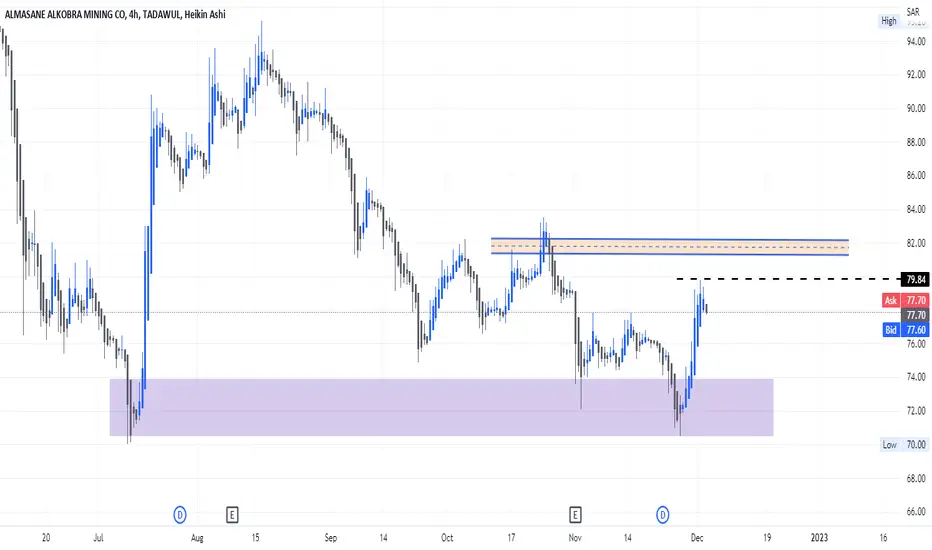
ALMASANE ALKOBRA MINING CO1322 ALMASANE ALKOBRA MINING CO1322
AMAC has come down hard to the starting point, which is a very strong ordering area and a starting point 79.84
See all ideas
Trade directly on the supercharts through our supported, fully-verified and user-reviewed brokers.


Frequently Asked Questions
The current price of 1322 is 59.10 SAR — it has increased by 0.68% in the past 24 hours. Watch ALMASANE ALKOBRA MINING CO stock price performance more closely on the chart.
Depending on the exchange, the stock ticker may vary. For instance, on TADAWUL exchange ALMASANE ALKOBRA MINING CO stocks are traded under the ticker 1322.
1322 stock is 0.85% volatile and has beta coefficient of 0.91. Track ALMASANE ALKOBRA MINING CO stock price on the chart and check out the list of the most volatile stocks — is ALMASANE ALKOBRA MINING CO there?
Yes, you can track ALMASANE ALKOBRA MINING CO financials in yearly and quarterly reports right on TradingView.
1322 stock has fallen by 0.67% compared to the previous week, the month change is a 1.90% rise, over the last year ALMASANE ALKOBRA MINING CO has showed a 0.74% increase.
1322 net income for the last quarter is 15.12 M SAR, while the quarter before that showed 5.94 M SAR of net income which accounts for 154.67% change. Track more ALMASANE ALKOBRA MINING CO financial stats to get the full picture.
Like other stocks, 1322 shares are traded on stock exchanges, e.g. Nasdaq, Nyse, Euronext, and the easiest way to buy them is through an online stock broker. To do this, you need to open an account and follow a broker's procedures, then start trading. You can trade ALMASANE ALKOBRA MINING CO stock right from TradingView charts — choose your broker and connect to your account.
1322 reached its all-time high on Apr 11, 2022 with the price of 87.85 SAR, and its all-time low was 48.30 SAR and was reached on Oct 24, 2023. View more price dynamics on 1322 chart.
See other stocks reaching their highest and lowest prices.
See other stocks reaching their highest and lowest prices.
Investing in stocks requires a comprehensive research: you should carefully study all the available data, e.g. company's financials, related news, and its technical analysis. So ALMASANE ALKOBRA MINING CO technincal analysis shows the neutral today, and its 1 week rating is buy. Since market conditions are prone to changes, it's worth looking a bit further into the future — according to the 1 month rating ALMASANE ALKOBRA MINING CO stock shows the buy signal. See more of ALMASANE ALKOBRA MINING CO technicals for a more comprehensive analysis.
If you're still not sure, try looking for inspiration in our curated watchlists.
If you're still not sure, try looking for inspiration in our curated watchlists.
We've gathered analysts' opinions on ALMASANE ALKOBRA MINING CO future price: according to them, 1322 price has a max estimate of 54.00 SAR and a min estimate of 54.00 SAR. Watch 1322 chart and read a more detailed ALMASANE ALKOBRA MINING CO stock forecast: see what analysts think of ALMASANE ALKOBRA MINING CO and suggest that you do with its stocks.