The "Trust Issues" Rally—High Quality, Low CommitmentVerdict: WATCHING (Stalking the Entry)
This is the most psychologically complex chart of the bunch. The Neural Brain likes what it sees (the price action is clean), but it doesn't trust it yet (the statistical probability is too low). It’s a "Ferrari in neutral"—the engine sounds perfect, but the car isn't moving.
1. THE PHYSICS: Efficiency Score (0.42)
Status: Professional Buying / "Stealth Mode"
The Data: For every $1 gained, price travels $2.30. ($1,306 Net / $3,106 Noise)
The Raw Numbers (From Dashboard)
Net Move (Distance A to B): $1,306.14
Total Noise (Total Path Traveled): $3,106.27
The Story: This is a "Quality" move. Unlike Silver (which was a chaotic bar fight), Bitcoin is moving with professional precision. It isn't sprinting vertically (bubble risk), nor is it chopping sideways (indecision). It is climbing a structured staircase. The "Smart Money" is accumulating quietly without spiking volatility.
2. THE MIND: Conviction (GAINING)
Status: The Skeptical Optimist
Bias: BULLISH (Price > Cloud).
The Paradox: The Conviction is GAINING (the math likes the trend), but the Confidence is only 36% (the risk model hates the setup).
Why? The system detects that while the movement is good, the momentum hasn't hit a "tipping point." It suspects this rally might be fragile or facing a hidden resistance wall that human eyes miss but the "Rational Quadratic Kernel" detects.
3. THE STRATEGY: "WATCHING (Possible Setup)"
Status: The Sniper Wait
The Discipline: An amateur trader sees green candles and buys. The Neural Brain sees a 36% Confidence score and waits.
The Trigger: The system is "Stalking." It needs the Confidence to spike (likely >70%) to confirm that the "Efficient Movement" is converting into a "Sustainable Trend." Until then, this is just a tease.
Action: Do Not Buy Yet. Keep it on the watchlist. The setup is excellent, but the signal hasn't fired.
The "Glass Box" Cheat Sheet (Final Recap)
Gold (XAU): 🟢 The Perfect Storm. Efficient + High Confidence. (BUY)
Silver (XAG): 🟡 The Grinder. Inefficient + High Noise. (HOLD)
Tesla (TSLA): 🔴 The Stealth Bear. Efficient Selling + Low Confidence. (WATCH SHORT)
Bitcoin (BTC): 🟠 The Sleeping Giant. Efficient Buying + Low Confidence. (WATCH LONG)
Harmonic Patterns

Weak USD, EURUSD Ready to Push HigherIn the short term, the US dollar is lacking strong bullish momentum as markets move into a wait-and-see mode ahead of the Fed , while recent US economic data has failed to trigger fresh USD buying. As a result, USD weakness remains largely technical in nature, indirectly allowing EURUSD to maintain its upward momentum.
From a technical perspective, the market structure is clearly bullish , with higher highs and higher lows firmly in place. The ascending trendline continues to be respected, and each pullback is quickly met with strong buying interest, confirming that c apital is still flowing on the BUY side.
At the moment, the 1.1850 level is acting as a key short-term support. Price consolidating above this zone suggests the market is pausing to build strength rather than distributing. If bullish momentum holds, the next upside target for EURUSD lies around 1.1930, where a higher-timeframe H4 resistance is located.
Combining both fundamental and technical factors, EURUSD shows no clear signs of reversal at this stage. In this environment, the most logical approach remains trading in the direction of the uptrend, looking for buy-on-dip opportunities and avoiding counter-trend SELL positions as long as the bullish structure stays intact.

BTC/USDT (4H): LONG to resistance areaBitcoin has reached an area of interest and is expected to continue its downward movement towards lower price levels

The "Stealth" Bear—Efficient Selling, Low Confidence
Verdict: WATCHING (Possible Setup)
Tesla has flipped to a bearish bias, and interestingly, the selling is "cleaner" than the buying on Gold. However, the Neural Brain is refusing to execute the trade right now.
1. THE PHYSICS: Efficiency Score (0.57)
Status: Highly Efficient Decline
The Data: For every $1 the price drops, it travels roughly $1.75 in total path.
The Meaning: The selling pressure is surprisingly organized. Despite the choppy look of the chart, the math shows high structural integrity in this downward move. It is not panic selling; it is orderly distribution.
2. THE MIND: Conviction (GAINING)
Status: Bearish Turn
Bias: BEARISH. The price is effectively BELOW CLOUD, flipping the system's bias to the downside.
Conviction: GAINING. The math engine is locking onto this downtrend, calculating an increasing probability of lower prices.
3. THE STRATEGY: "WATCHING (Possible Setup)"
Status: Stalking the Trade
Confidence: 19% (Low). This is the deal-breaker. While the move is efficient, the statistical confidence hasn't crossed the actionable threshold (usually >70%).
Action: WAIT. The system sees a potential short forming but determines it is too early to strike.
Verdict: Add to watchlist. Do not short until the Confidence metric spikes to confirm the breakdown.

Gold Isn’t Weak — It’s Structuring for the Next ExpansionHello traders, Louna here.
Gold started the week around $5,075, up approximately 1.76%. After an aggressive bullish expansion, price has naturally shifted into a slowdown and technical consolidation. This is not weakness — it is healthy trend behavior. Strong trends pause, they don’t collapse.
From a macro standpoint, the backdrop remains supportive. Geopolitical tensions have not eased, and global policy uncertainty continues to favor safe-haven demand. Meanwhile, the US dollar lacks the momentum required to suppress gold meaningfully. As a result, capital rotation away from gold is limited — institutions still have reasons to stay positioned.
On the technical side, structure remains exceptionally clean. Price is respecting an ascending channel, with each pullback remaining corrective rather than impulsive. The unfilled gap below stands out as a potential liquidity magnet, though no confirmation has appeared yet. This keeps the market in a “wait and react” phase rather than a “predict” phase.
Primary scenario:
If price retraces into the gap while preserving the ascending channel, bullish continuation remains the dominant path, with $5,208 aligning as the next expansion target near the upper boundary of the channel.
Invalidation:
Only a decisive close below the rising channel would force a reassessment of the short-term bullish bias.
Until then, the message is simple:
Structure intact. Trend respected. Patience rewarded.
Trade with clarity, not emotion — and let the chart do the talking.

Shib gonna shake out some folkThe liquidity needed to go up IMO is not there yet!
We need to create an value in green box before dipping out of it.
I do think we are in a deep wave 4 correction currently.
Still a risky play fo sho.
NOT FINANCIAL ADVICE


Primium Price DetectedThe market is currently at the 0.75 dealing range level which is the premium price, sells could be taken instantly, but we ought to be wary of the fair value gap that has not been filled above. The ultimate anticipation is for price to hike a bit, grab the liquidity and simultaneously fill the gap above. This shall give us the opportunity to take action in this potential bearish market.


#XAUUSD(GOLD): +1200 Pips Selling Opportunity! Dear Traders,
Gold has repeatedly retested the 5101 region but has been rejected. We believe the price has exhausted and bearish volume has increased in the market. To enter, we need a clear reversal signal and a retest of a key support level.
Currently, our only target is a swing trade. This analysis can also be used for intraday trading. Your stop loss will depend on your risk management.
Good luck and feel free to like and comment for more.
Team Setupsfx_

Gold prices may rise to $5220-$5250 today.Gold prices may rise to $5220-$5250 today.
Gold prices have reached the expected $5150-$5200 range, and we have once again seized this upward opportunity.
We have already profited over 100 points today.
I had already predicted this possibility in advance through public channels.
Next, we need to clarify a few key signals:
1: The short-term target price for this round of gold price increases is $5220-$5250. Please note that gold prices are likely to experience a pullback within this resistance range.
2: Gold prices are likely to continue fluctuating upwards during the upcoming Asian and European trading sessions, forming a high-level consolidation structure.
3: Gold prices still have significant upside potential. The final top remains unclear because current market forces are collectively accelerating the upward trend. The surge in gold prices will undoubtedly accelerate. However, we also need to be wary of potential future sell-off risks.
4. Gold prices will definitely fall, but there are two types of declines: a healthy structural correction and a sell-off-driven trend crash. As gold prices surge, the risk of a sharp drop from the highs also increases.
5. In the short term, always trust the bottom support level of the gold price trend. Buying on dips is the best strategy for intraday trading.
As shown in the chart: I predict the maximum potential upside for gold prices on Wednesday will be in the $5220-$5250 range.
Please continue to follow my channel; I will continuously analyze real-time trends and share the latest trading signals. If you have any questions, please leave a message, and I will answer them for you.

XAUUSD—Short at Top or on BreakdownGold is trading inside a clear rising parallel channel. I’m not chasing the middle — I’ll wait for either (1) a tap into the upper channel resistance for a potential rejection short, or (2) a clean break and close below the lower channel to confirm weakness and short the breakdown.
Key levels / plan:
Short idea A: upper channel touch → look for bearish reaction / rejection
Short idea B: break + close below lower channel → breakdown confirmation
Targets: channel midline first, then lower channel / prior support
Invalidation: strong reclaim back inside the channel after breakdown, or clean breakout above the upper channel

Today's Gold Trading Strategy1.The US Dollar Index continues to break through key levels, completely relieving pressure.
The US Dollar Index fell to 96.94, a new low in more than four months, maximizing its negative correlation with gold. This directly lowers the cost of holding gold and drives global funds into gold assets.
2.Expectations for a Fed rate cut have risen sharply, confirming loose liquidity.
CME interest rate futures show that the probability of a Fed rate cut in 2026 is over 90%, with expectations of a mid-year rate cut increasing. Lower real interest rates have amplified the investment value of non-interest-bearing gold.
3.Central bank and ETF gold purchases provide support, with ample rigid demand.
The People's Bank of China has increased its holdings for several consecutive months, adding again in January, continuing the global central bank gold buying spree. SPDR Gold ETF holdings remain high, with continuous net inflows, providing strong support for gold prices.
4.Geopolitical risks continue to escalate, driving strong safe-haven demand. Risks such as the US-EU trade dispute, the Middle East situation, and the Greenland resource dispute have not eased, leading to a rise in the VIX fear index and further strengthening gold's safe-haven appeal.
Gold trading strategies
buy:5130-5150
tp:5170-5180-5200

Time to riseTime to rise, weekly chart buy, expect 30 usd +
GameStop Corp. offers games and entertainment products through its ecommerce properties and stores. It operates through the following geographic segments: United States, Canada, Australia, and Europe. Each segment consists primarily of retail operations, including stores and ecommerce properties focused on games, entertainment products, and technology. GameStop offers new and pre-owned gaming platforms from the major console and PC manufacturers, sells new and pre-owned gaming software for current and certain prior generation consoles, and offers a variety of in-game digital currency, digital downloadable content, and full-game downloads. The firm’s stores and ecommerce sites operate primarily under the names GameStop, EB Games, and Micromania. Its pop culture themed stores also sell collectibles, apparel, gadgets, electronics, toys, and other retail products for technology enthusiasts and general consumers in international markets operating under the Zing Pop Culture brand. The company also publishes Game Informer, a print and digital gaming publication. GameStop was founded by Daniel A. DeMatteo in 1996 and is headquartered in Grapevine, TX.

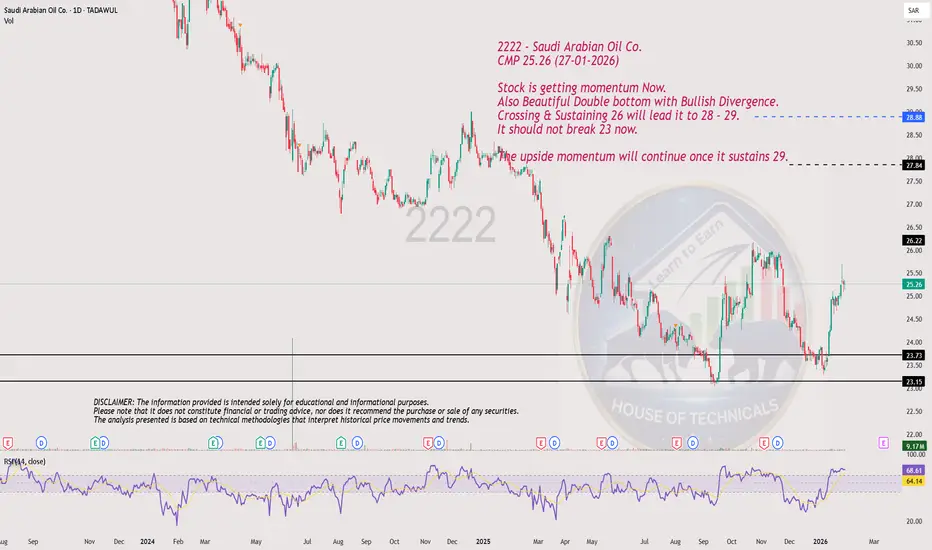
Stock is getting momentum Now.2222 - Saudi Arabian Oil Co.
CMP 25.26 (27-01-2026)
Stock is getting momentum Now.
Also Beautiful Double bottom with Bullish Divergence.
Crossing & Sustaining 26 will lead it to 28 - 29.
It should not break 23 now.
The upside momentum will continue once it sustains 29.
Gold Selling Plan!!After a wild surge, there will be a brief correction!
SELL: 5070 - 5075
TP1: 5102
TP2: 5048
SL: 5210

ABCD Pattern appearing.SALIK Analysis
CMP 6.43 (27-01-2026)
ABCD Pattern appearing.
Crossing & Sustaining 7 may lead it towards 8.
It should not Break Point C now.

ABCD Pattern!PARKIN Analysis
CMP 6.12 (27-01-2026)
Weekly Support seems to be around 5.80 - 5.90
Crossing & Sustaining 6.70 - 6.80 may lead it
towards 7.80 - 7.90
It is safe as long as the price stays above 5.30

Given Breakout on bigger tf.PRESIGHT Analysis
CMP 3.55 (27-01-2026)
Given Breakout on bigger tf.
However, 3.40 - 3.50 can be re-tested.
Upside Targets can be around 5 if 4.10 is crossed
with Good Volumes & Sustained.
Breaking 3.40 may bring more selling pressure towards 3 - 3.20

Double Bottom with Bullish Divergence.ALT Analysis
CMP 21.60 (27-01-2026)
Double Bottom with Bullish Divergence.
Levels are Marked!

Bullish Divergence appearing on bigger tf.MASK Analysis
CMP 0.2395 (27-01-2026)
Bullish Divergence appearing on bigger tf.
It seems safe as long as it stays above 0.1750
Crossing 0.5148 wiht Good Volumes & Sustaining
this level may initiate aggressive move towards 2.

a Bounce is Expected from Monthly Support.SPEL Analysis
Closed at 55.95 (27-01-2026)
a bounce is expected from 55.
Sustaining this level on monthly basis may lead
it towards 57 - 59.
However, breaking 55 may bring more selling
pressure towards 46 - 47.

Levels to Play!PSO Analysis
Closed at 478.11 (27-01-2026)
Immediate Support seems to be around 470 - 472
Resistance Zone is around 494 - 500 now.
Crossing & Sustaining this Zone may lead it towards 560+
Trailing SL now should be around 459. Breaking this level
may bring more selling pressure towards 450 & then around 420.
