LTC/USDT 30M Short-Term📊 1) Market Structure (Price Action)
The market is consolidating/accumulating between ~67.2 and ~70.1.
Previously, there was a strong decline, then range trading with false breakouts.
Currently, the price has rebounded from the ~66 low and is making a higher low → short-term bullish.
👉 This looks like a retest of the range bottom → a push to the middle of the range.
🧱 2) Key Levels (Your lines are well marked)
🔴 Support Levels
67.20 – the most important local support (range low).
64.89 – a strong swing low (if 67 breaks → decline here).
63.14 – the bulls' last defense.
🟢 Resistance
69.37 – mid-range, local S/R flip.
70.11 – key range high.
71.60 – strong HTF resistance (if it breaks 70 → target).
📈 3) Trend (moving average)
The green MA (probably the 200 EMA/SMA) has been acting as dynamic resistance previously, and now the price is starting to hold above it → bullish short-term.
Structure:
low → higher low → test resistance = breakout potential.
⚡ 4) RSI + Stoch RSI
RSI (lower panel)
RSI ~55–60 → bullish momentum (above 50).
No overbought → room for further upward movement.
Stoch RSI (middle panel)
Oscillates, but not to an extreme → no dump signal.
If it crosses upwards >80 → a scalp short signal (at 30m).
🧠 5) Scenarios (most important)
🟢 BULLISH SCENARIO
Condition:
Close of the 30m candle above 69.40
Targets:
70.11
71.60
73+ (if a breakout range on HTF)
👉 This will be a consolidation breakout → an impulsive move.
🔴 BEARISH SCENARIO
Condition:
Rejection of 69.4 + return to below 67.9
Targets:
67.20
64.89
63.14
👉 This will be a classic range fake breakout → dump to the lower zone.
🧨 6) What do I see as smart money?
A liquidity grab above 69.5–70 is very likely, followed by a dump.
Market makers like to:
break resistance
collect longs
dump to range low
💰 7) Trading setup (pro)
📌 LONG scalp
Entry: 69.4 breakout retest
SL: 68.8
TP1: 70.1
TP2: 71.6
📌 SHORT swing (better R:R)
Entry: 70–71 rejection
SL: 71.8
TP1: 67.2
TP2: 64.9
Harmonic Patterns

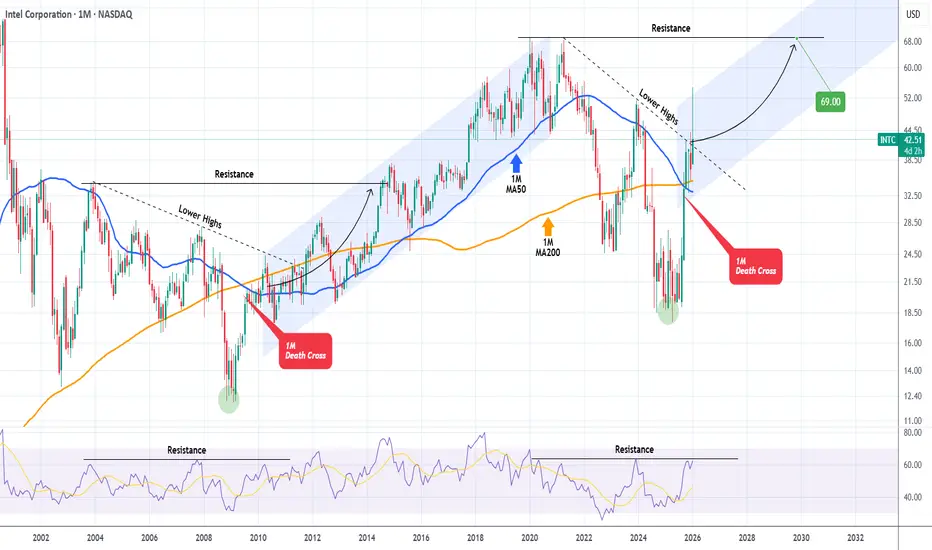
INTEL has broken above its 6-year Bear Cycle.Intel (INTC) made a key long-term development this month as following last months rejection, it managed to break above its Lower Highs trend-line with force and despite the strong retracement of these days, it aims to close above it.
This technically brings an end to the stock's 6-year Bear Cycle since the January 2020 High. One would assume that following August's (2025) 1M Death Cross, the Cycle would continue lower but most likely it confirmed the bottom earlier this year.
At least that's what happened on the identical fractal of 2004 - 2011. A 1M Death Cross was formed just after the market bottom and a break above the Lower Highs confirmed the start of the 8-year Channel Up (blue). Even the 1M RSI sequences between those fractals are similar.
The first Target of that Channel Up was the Resistance level that started the Lower Highs trend-line, so that's our Target for Intel ($69.00) by the end of 2029.
---
** Please LIKE 👍, FOLLOW ✅, SHARE 🙌 and COMMENT ✍ if you enjoy this idea! Also share your ideas and charts in the comments section below! This is best way to keep it relevant, support us, keep the content here free and allow the idea to reach as many people as possible. **
---
💸💸💸💸💸💸
👇 👇 👇 👇 👇 👇
GBPJPY CURRENT TRACJECTORYAfter a double bottom and a 4H Bull Candle with no wick, means buyers are in complete control, estimated.

$UUUU - Energy Fuels (UUUU)Energy Fuels (UUUU) shares surged 7% in Tuesday morning trading following a bullish analyst note from B. Riley. Analyst Matthew Key raised his price target on the uranium and rare earths miner to $27 per share, reiterating a "Buy" rating and highlighting the company's strategic positioning within the critical minerals sector.
The optimism centers on two primary catalysts: Energy Fuels' unique capabilities in rare earth element (REE) refining and a supportive U.S. policy environment aimed at securing domestic supply chains for strategic minerals. As reported by TheFly.com, the stock has already outperformed its nuclear peers in 2026, driven by confidence in the company's White Mesa Mill in Utah, which is now producing high-purity, ex-China rare earth oxides at a commercial scale. This positions Energy Fuels as a key potential supplier for the domestic permanent magnet market, essential for electric vehicles, wind turbines, and defense applications.
Further upside, according to the analyst's rationale, could materialize through several pathways. These include potential mergers and acquisitions in the sector that could revalue industry assets, measurable progress in Energy Fuels' core uranium operations, or, most notably, significant advancements in its rare earth projects. A major near-term catalyst would be the company's ability to "validate" reserves of high-value terbium oxide and make a Final Investment Decision (FID) on its Donald Rare Earth and Mineral Sands Project in Australia. The recent announcement of a Memorandum of Understanding (MOU) with Vulcan Elements to supply neodymium-praseodymium (NdPr) and dysprosium (Dy) oxides for U.S. magnet production underscores this commercial momentum.
However, the bullish analysis does not address several key financial concerns. Energy Fuels has been experiencing rising cash burn and sustained net losses over the past two years. While analysts surveyed by S&P Global Market Intelligence project the company will more than double its revenue in 2026 compared to 2025, they also forecast continued losses and negative free cash flow. GAAP profitability may not be achieved until 2027, and free cash flow is expected to remain negative through at least 2028. This financial profile stands in stark contrast to larger, profitable industry leaders like Cameco, which is growing revenue rapidly and benefiting from the same nuclear renaissance.
The long-term investment thesis for Energy Fuels is deeply intertwined with macro trends. The global push for reliable, carbon-free power, partly driven by the soaring energy demands of artificial intelligence (AI) data centers, has fueled a nuclear energy revival. With over 70 gigawatts of new nuclear capacity under construction worldwide and a U.S. goal to triple nuclear production by 2050, the demand outlook for uranium is robust. As a cornerstone of the U.S. uranium industry, Energy Fuels has produced two-thirds of all domestic uranium since 2017. It controls over 81 million pounds of measured and indicated uranium resources and possesses the largest production capacity among U.S. miners at 10 million pounds annually.
The company's strategic pivot and expansion into rare earths aim to create a vertically integrated "mine-to-metal & alloy" champion, a vision bolstered by its planned acquisition of Australian Strategic Materials. Its White Mesa Mill is poised to become a central hub in a North American rare earth supply chain, with ambitions to eventually produce enough separated rare earth oxides to support up to 6 million electric vehicles per year.
From a technical analysis perspective, the stock's chart presents a mixed picture following its strong run, which included a 183% gain in 2025. Key Fibonacci retracement levels from the recent uptrend provide potential support at $21.64 (23.6% retracement), $18.11 (38.2% retracement), and $15.27 (50% retracement). However, chart watchers note the potential formation of a double-top pattern, a technical structure that often indicates exhaustion of an uptrend and can precede a period of consolidation or selling pressure.
In summary, Energy Fuels represents a high-risk, high-potential investment at the intersection of two powerful secular trends: nuclear energy and domestic critical minerals independence. While analyst upgrades and strategic developments provide compelling reasons for optimism, investors must weigh these against the company's significant ongoing cash burn, lack of profitability, and technical indicators that suggest near-term caution. The long-term success of the stock hinges on its ability to successfully execute its rare earth strategy, achieve its uranium production targets, and ultimately transition to sustainable positive cash flow.


EURUSD ahead of biggest test in 8 years! Collapse or Golden era?The EURUSD pair is going for its most important test in 8 years, the 1M MA200 (orange trend-line). This level last tested in February 2018, causing a massive rejection, which kick-started the Bear Cycle of 2018 - 2019. Technically that was the Bearish Leg of the 11-year Bearish Megaphone pattern that the pair has been trading in basically since the last time it closed a 1M candle above the 1M MA200, which was in November 2014.
The previous Bearish Leg of 2021 - 2022 also started close to the 1M MA200 but the price got rejected a little lower. Nonetheless, it did create a Lower Highs trend-line, which is currently sitting marginally above the 1M MA200. As a result, EURUSD is approaching a massive Resistance Zone, while at the same time its 1M RSI is attempting to re-test its 66.50 Resistance, which got rejected in June 2025 and also started 8 years ago with the first Lower High.
As a result, until the price closes a 1M candle above the 1M MA200 (would be the first in more than 11 years), we believe it is more likely to see a rejection starting the new Bearish Leg. However the development that confirmed that during the previous two Bearish Legs was a 1M candle closing below the 1W MA50 (red trend-line). If that takes place, it will be the confirmation signal for a long-term Sell.
As far as Targets are concerned, the Jan 2025 Low is our first candidate, targeting 1.0200 fulfils this condition as well as the 0.618 Channel Fibonacci level, which has priced three bottoms in the past 6 years (green circles). A monthly close below Support 1 (Jan 2025 Low) could grant an extension to the 0.786 Channel Fib at 0.9800, which is where another three Lows were price (blue circles).
In any event, if the 1M RSI turns oversold (below 30.00) it has been the ultimate long-term Buy Signal within 11 years and we will turn into long-term buyers regardless of the actual price of EURUSD at the time.
---
** Please LIKE 👍, FOLLOW ✅, SHARE 🙌 and COMMENT ✍ if you enjoy this idea! Also share your ideas and charts in the comments section below! This is best way to keep it relevant, support us, keep the content here free and allow the idea to reach as many people as possible. **
---
💸💸💸💸💸💸
👇 👇 👇 👇 👇 👇

Gold Breaks Through Three Pillars of Traditional LogicGold Breaks Through Three Pillars of Traditional Logic
The current strong performance of gold prices has transcended the traditional logic of safe-haven or inflation hedging, evolving into a "repricing" of the global monetary and credit system.
Below is my macroeconomic analysis of recent gold price movements, representing only my personal views.
Our current holdings are approximately $5080.
The stop-loss is set around $5050.
Our short-term intraday target price: $5150-$5200 range.
Core intraday trading strategy: As long as the gold price remains above $5050-$5060, we will adopt a buy-on-dips strategy, with holding periods that may be indefinite or short-term. We will adjust the overall strategy according to the trading rhythm.
As always, our trading strategies will be released in real-time on our channel. We will continue to provide a free advanced signal channel, consistently offering high-probability trading signals. Thank you for your attention and participation. If you have any questions, please leave a message, and I will answer them one by one.
Macroeconomic Analysis:
1. Structural De-dollarization and Credit Restructuring
Many central banks continue to purchase large amounts of gold to diversify reserve risks. This price-insensitive demand provides solid support for gold prices. Market concerns about the credibility of the US dollar and US fiscal policy have transformed gold from a "safe-haven asset" into a "non-sovereign credit asset."
2. Geopolitical and Policy Uncertainty. Policy volatility during the US election year, the Trump administration's tariff policies, and geopolitical stances (such as actions against Venezuela and Greenland) have exacerbated global uncertainty. Recent geopolitical tensions, particularly with Iran, have also stimulated safe-haven demand.
3. "Crowded Trade" by Central Banks and Capital.
Major central banks globally have been net buyers of gold for several consecutive months (approximately 60 tons per month). Simultaneously, private investors (such as ETFs and institutional investors) have also significantly increased their gold holdings. These factors combine to create a virtuous cycle, pushing up gold prices. The rising gold prices themselves attract more trend-following funds, thus creating a self-reinforcing upward cycle.
As shown in the chart: Technical Analysis
Key Resistance and Support Levels Analysis
Core Resistance Zone: $5400 - $6000
Many institutions believe $5400 is the next important target.
More optimistic forecasts (such as those from Bank of America and Jefferies) suggest that if a historic bull market cycle repeats itself, gold prices could challenge $6000 or even $6600 by 2026.
Core Support Zone: $5000 - $4850
The recently broken psychological level of $5000-$5100 has become a key support zone for both bulls and bears.
If gold prices experience a deep correction, I believe $4850 (the previous high) will be a stronger support level.
Besides technical corrections, we also need to be wary of low-probability, high-impact events.
Potential Black Swan Events:
1: A large-scale oil supply shock triggered by the Iranian crisis.
A surge in oil prices could trigger stagflation (high inflation + economic recession) panic, making gold, as the ultimate safe-haven asset and inflation hedge, a hot commodity.
If this happens, it should be seen as a significant buying opportunity, but it's important to note that the initial widespread decline across various assets could lead to a liquidity shock.
2: Escalation of conflict between Russia and NATO.
This would disrupt the global geopolitical landscape, and extreme risk aversion would rapidly push up gold prices. This is also a significant buying opportunity, but market volatility will become extreme and unpredictable, requiring extremely strict position management and stop-loss strategies.
3: A major breakthrough in China's technology sector.
This could trigger a plunge in US tech stocks, leading to global market turmoil. In the short term, liquidity shortages (investors selling off all assets to cash out) could put pressure on gold prices; however, in the medium to long term, this will reinforce the logic of de-dollarization and asset diversification, which is beneficial for gold.


Nat Gas: At The Moon - $6.. Now Next Stop $7?! NYMEX:NG1! NYMEX:NGG2026 Well it's been 4 days since my last post,
In my previous post I put forward a target of $6 for the prompt month NG contract . Now that we've blown through that target with a strong weekend open, the next question is where do we go from these historic Winter 2026 highs?? Many NG bears, would argue everything is already priced in, and there's no more gas left in the tank. However, if you look back a year from now, you'll realize we're finally at the bullish levels that were the BASE CASE for what we thought the supply & demand picture would like for 2026. This means we are finally at the expected value that markets had anticipated, 12 months ago, not that we are OVERVALUED.
Now BEARS are supposed be hibernating during the winter, but for some the recent historic rally has caused them to come out of hibernation. Well... there's a reason bears try to sleep through the winter.... it's because you don't chase penny's... when there's dollars to be made!! Right now you should only be taking tactical & quick shorts. This rally still has room to run, and you don't want to step in front of this Bull Train!!
From my charts & fundamental insights, I believe our next target for a session close will be $6.55 then $6.99, and that the February 2026 contract will expire above $6.
Looking at the charts for the front month, you can clearly see an upward directional channel that's now been established. The 30 minute ichi cloud has been providing upward support for NG. The 30min ichi wave targets are lower than the 1hour ichi cloud, and at first if you're looking at the lower time frame, it might seem that the near term movement is to the downside, below the lower upward channel support line & the next wave targets take us lower.
Howeverrrrrrr, if you look at the 1hour ichi, you can clearly see a support cloud above the upward channels bottom support. The next wave targets on the hourly seem to imply, that we can reach $6.55 to $6.65, and if those targets are smashed through next resistance is at $6.99 at the top of the upward channel.
The one hope for Bears, that may lead to consolidation & accumulation at or below the $6 level, before another move higher past $6.30 : "..analysts said potential reductions in LNG exports and pipeline deliveries to Mexico could help offset some of the tightening.
“Another potential wrinkle is how much LNG exports may decline as a result of Fern,” said Pat Rau, NGI’s senior vice president of research and analysis. “Back during Winter Storm Uri, LNG exports fell as well. That meant the overall supply/demand picture wasn’t just lost supply, there was some curtailed demand to help balance things a bit.””-NGI
Now, taking the above quote into consideration... I know you must be skeptical of a continuation of this breakout, but please refer to my previous post of why this rally had legs to begin with to take out the $6 level. But to reach the $7 level, I'll provide a few more quotes below, of why this historic Winter Freeze will keep the bull train going strong down the tracks.
A few fundamental insights on why the cold weather in the U.S. has been an ignition switch for NG prices for the weekend open, quotes provided from industry news source Natural Gas Intelligence:
“I think this storm has all the elements to make it a major risk on the level of Elliott and Uri,” said NGI’s Dan Spangler, senior director of analytics. “There’s going to be widespread cold in nearly all major producing areas, so there will definitely be a freeze-off impact.”
"Wood Mackenzie said Friday that average U.S. natural gas production month-to-date is down to 109.2 Bcf/d, “reflecting the impact of supply-related outages.” The consultancy’s freeze-off projections for the final two weeks of January jumped 9.5 Bcf on Thursday to 138.8 Bcf. That would be an all-time high if realized, breaking the 118.7 Bcf record set in February 2021 when Uri hit.”
"When Uri struck in mid-February 2021, LNG feed gas flows slowed to a trickle. Deliveries fell 87% to 1.3 Bcf/d from above 10 Bcf/d at the start of the month, Wood Mackenzie data show."
“Prices still took off back then, of course,” Rau said, “but the impact may have been even worse if LNG hadn’t served as a demand destruction vehicle to help counter some of the lost production.”
"Even so, Fern may not stress the Texas power grid to the same degree as Uri, according to RBN Energy LLC analyst John Abeln.
The expected zone of extreme cold during Fern “does not extend as far south across Texas” as it did during Uri, Abeln said, and the storm is forecast to move through the state much more quickly. Temperatures in Dallas are expected to rise above freezing by Tuesday, compared with a much longer stretch below freezing during Uri.
“The sustained deep freeze that exhausted storage and led to equipment failures is likely to be much less severe this time around,” Abeln said.
If deep snow materializes, frigid temperatures linger and production freeze-offs mount, February natural gas “could rally to the $7.500 area” in a highly bullish scenario, Yawger added.
Exceptional storage withdrawals are in the cards as well, with most analysts now looking for a pull far north of 300 Bcf for the last week of the month.
“The chatter around the natural gas space is a storage draw of over 350 Bcf or greater,” Yawger said. “There have only ever been four draws of 300 Bcf or greater in the history” of federal storage data.

Gold: Extended Its Strong Uptrend TodayGold extended its strong uptrend today, gapping up and surging in the Asian session then consolidating at highs. It broke through the key psychological level of 5000 and hit a new all-time high, with the bullish trend dominating the market. However, the risk of a pullback is rising amid overbought conditions. The primary trading approach is to buy the dips on corrections with strict control over chasing highs.
Short-term (Intraday Core)
Support levels:
5030 (strong support, the lower edge of intraday consolidation and key defensive level for pullbacks);
5000 (critical psychological support, a break below this integer level will trigger short-term selling pressure).
Resistance levels:5110 (critical psychological resistance, a breakout will further open up upside momentum).
Medium-term (Swing Reference)
Support level: 4960 (bull-bear pivot support, the level of the previous consolidation platform, a break below may trigger a deep pullback in gold prices).
Resistance level: 5150 (trend resistance, the extension of the all-time high, with no significant technical resistance above this level).
Trading Strategy:
Buy 5040 - 5050
SL 5030
TP 5080 - 5090 - 5100
Sell 5100 - 5090
SL 5110
TP 5070 - 5060 - 5050

NVA Long: Breakout From Descending Wedge With 80%+ Upside📌 Nova Minerals (#NVA) — Long Idea | Premium Channel
This long position was opened today in our premium channel, and the setup is still attractive for entry.
📊 FUNDAMENTAL ANALYSIS
🟢 Nova Minerals is a gold exploration and development company with key assets in Alaska (the Estelle Gold Project), one of the most prospective and geopolitically safe regions for gold mining.
🟢 The company continues to actively expand its resource base, increasing confirmed reserves, which enhances its investment appeal amid expectations of higher gold prices.
🟢 Gold traditionally benefits from macroeconomic uncertainty, inflation risks, and weakening confidence in fiat currencies — creating a supportive backdrop for the junior mining sector.
🔴 The main risks remain the lack of stable profitability at this stage and high volatility typical of early-stage development companies.
🛠 TECHNICAL ANALYSIS
📈 LONG
▪️ Price has broken out of a descending wedge and is holding above the upper trendline.
▪️ Price is confidently trading above the 50 EMA, with attempts to consolidate above a key resistance level.
▪️ The 200 EMA acts as a strong long-term support, keeping the broader structure bullish.
▪️ RSI is trending higher, remains in bullish territory, and is not overbought.
▪️ MACD has turned upward and shows strengthening bullish momentum.
▪️ Volume confirms renewed buying interest after consolidation.
↗️ TRADE SETUP
🎯 T1: $14.37
🎯 T2: $18.53
📊 Upside potential: approximately 80%+ if momentum continues toward the upper range and a breakout to new local highs.
💼 Portfolio
#active_management
⚠️ This idea is not investment advice and reflects the author’s personal opinion. Each investor is responsible for their own trading decisions.

GOLD XAUUSD GOLD 5096-5100 was a complete reaction as predicted on friday.
KEY DEMAND FLOOR 4965-4960
KEY DEMAND FLOOR 4847-4840.
OR FOLLOW THE STRUCTURE.
STRUCTURE NEVER LIES.
am watching 4500-4496 zone a strong demand floor
Geopolitical Tensions
US President Donald Trump's insistence on acquiring Greenland, including threats of force and tariffs on opposing European nations, has sparked US-Europe friction. French President Macron's rebukes and potential suspension of US-EU trade deals have weakened the dollar, boosting gold's appeal to foreign buyers.
Economic Factors
A softer US dollar makes gold cheaper globally, while expectations of steady Federal Reserve rates—despite labor improvements—favor non-yielding assets like gold. Central banks in China and India continue aggressive gold buying, adding structural support.
Future Outlook
Prices may climb toward $5,000-5024k AND extend into 5070k zone if tensions persist and the dollar stays weak, though stronger US data could cap gains.
the dollar index is holding daily support at 97.935$ and during newyork today buy candle kept yesterday demand floor and we are seeing GOLD price into systematic correction from 4890-4880 zone .if they insist on daily buy floor then we will be watching 4900 which is a pathway to 5000-524k and more advanced buying based on the trendangle strategy.
WHAT IS GOLD ???
Gold (Au) is a chemical element and dense, malleable transition metal prized for its lustrous yellow hue, exceptional conductivity, and resistance to corrosion.
History as Store of Value
Gold has served as a store of value for over 6,000 years, from ancient Egyptian tombs (c. 4000 BCE) symbolizing immortality to Lydian coins (600 BCE) enabling standardized trade across empires like Rome (aureus) and Byzantium (solidus, stable 700+ years). The 19th-century gold standard anchored global currencies until 20th-century abandonments, yet gold retains purchasing power
Tier 1 Status Clarification
Gold classifies as a Tier 1 asset under Basel III banking rules , with 0% risk weighting for physical bullion, equivalent to cash for capital reserves, enhancing bank balance sheets amid fiat volatility. This elevates it from prior Tier 3 status, affirming its role as "money again.
HOW DOES THE DOLLAR INDEX AFFECT THE PRICE ACTION AND DIRECTIONAL BIAS ??
The US Dollar Index (DXY) exhibits a strong inverse relationship with global gold prices, where a stronger dollar typically depresses gold values and a weaker dollar boosts them.
Core Mechanism
Gold trades in US dollars worldwide, so dollar strength raises gold's cost for non-US buyers, curbing demand and lowering prices. A weaker dollar reduces this barrier, making gold cheaper and spurring purchases from international investors.
Correlation Strength
Historical data shows a negative correlation coefficient of -0.40 to -0.80, meaning 40-80% of gold's movements often align inversely with DXY changes. Interest rate differentials amplify this: Fed hikes strengthen the dollar and hurt non-yielding gold, while cuts weaken it and favor gold.
Influencing Factors
Geopolitical risks or inflation can override the link temporarily, but dollar dynamics remain the primary driver in most cycles. For instance, recent dollar weakness from de-dollarization trends has fueled gold rallies.
the brics nation are busing buying GOLD.this is the year of GOLD as the new money backed by physical GOLD ,this is why all BRICS CENTRAL BANKS are stocking the yellow bullion.
#GOLD #XAUUSD

US$/YEN I am posting this for good reason LOW IN PLACE The timing and price projections at the High and the low based on wave structure and fib relationships to the TICK !!! have a nice day WAVETIMER

I am now Long PUTS IN SLV and Silver 2027 lateThe wave structure is now complete as into the cycle high and fib relationship The US$ is about to Bottom in wave B low we should then see a huge rally in DXY and a sharp decline in all metals and the sp 500 is in wave c up in wave 5 of the diagonal 5th wave all coming into the 5 spirals due 2/9 event best of trades WAVETIMER

CRDO in BUY ZONEMy trading plan is very simple.
I buy or sell when at either of these events happen:
* Price tags the top or bottom of parallel channel zones
* Money flow volume spikes beyond it's Bollinger Bands
So...
Here's why I'm picking this symbol to do the thing.
Price in buying zone at bottom top of channels
Money flow momentum is spiked negative and at bottom of Bollinger Band
Entry at $136.25
Target is upper channel around $164, but may close at moving averages around $150
Set your own stop. Mine is set at $133.

[LOI] - BTR - BTR
Key Points
Purpose : Bitlayer is a Layer 2 network built on Bitcoin, designed to enable scalable DeFi applications while maintaining Bitcoin's security through BitVM technology. It aims to unlock Bitcoin's capital for broader use in smart contracts and decentralized finance.
Problem Solved: Bitcoin's native limitations in scalability, programmability, and transaction throughput hinder complex DeFi; Bitlayer addresses this by providing Turing-complete contracts via an optimistic validation scheme, allowing high-throughput execution without compromising Bitcoin's consensus.
Bullish Case for Demand : With Bitcoin's ecosystem gaining traction in 2026 amid BTCFi narratives, Bitlayer's EVM compatibility, yield-generating assets like YBTC, and upcoming enhancements could drive adoption; its low market cap (~$30M) suggests high growth potential but also volatility, making it risky to short as pumps (e.g., recent 46%+ daily gains) indicate strong speculative interest.
Partnerships : Key collaborations include mining pools (Antpool, F2Pool, SpiderPool) controlling ~40% of Bitcoin hashrate, DeFi platforms like Kamino Finance and Orca for YBTC integration on Solana, infrastructure ties with AWS and Chainlink, and ecosystem links with Sui, Base, Arbitrum, and Cardano.
Current Market Cap : Approximately $30.6 million, with a circulating supply of 261.6 million BTR out of 1 billion total; this low cap amplifies upside potential in a bullish BTC L2 market but heightens risk.
Recent Announcements : January 2026 funding surge of $29 million to enhance BTC and multi-chain integrations; anticipated mainnet upgrade in February 2026; USDC token contract update; outlook for further growth including Bitcoin event participation.
Notes on how I personally use my charts/NFA:
Each level L1-L3 and TP1-TP3 (Or S1-S3) has a deployment percentage. The idea is to flag these levels so I can buy 11% at L1 , 28% at L2 and if L3 deploy 61% of assigned dry powder. The same in reverse goes for TP. TP1: 61%, TP2:28% and TP3:11%. If chart pivots between TP's, in-between or in Between Sell levels these percentages are still respected. I like to use the trading range to accumulate by using this tactic.
Just my personal way of using this. This is not intended or made to constitute any financial advice.
This is not intended or made to constitute any financial advice.
NOT INVESTMENT ADVICE
I am not a financial advisor.
The Content in this TradingView Idea is for informational purposes only, you should not construe any such information or other material as legal, tax, investment, financial, or other advice. Nothing contained within this idea constitutes a solicitation, recommendation, endorsement, or offer to buy or sell any securities or other financial instruments in this or in in any other jurisdiction in which such solicitation or offer would be unlawful under the securities laws of such jurisdiction.
All Content on this idea post is information of a general nature and does not address the circumstances of any particular individual or entity. Nothing in the idea/post constitutes professional and/or financial advice, nor does any information on the idea/post constitute a comprehensive or complete statement of the matters discussed or the law relating thereto. You alone assume the sole responsibility of evaluating the merits and risks associated with the use of any information or other Content on the idea/post before making any decisions based on such information.
Sir. Galahad - QUANT
Disclaimer
The information and publications are not meant to be, and do not constitute, financial, investment, trading, or other types of advice or recommendations supplied or endorsed by.

Nifty 50 Analysis Target For Bearish Momentum Stop Here Sure 👍
Here is the **Nifty 50 Components list (in English only):**
---
## ✅ Nifty 50 Companies List
### **Banking & Financial Services**
* HDFC Bank
* ICICI Bank
* State Bank of India
* Axis Bank
* Kotak Mahindra Bank
* Bajaj Finance
* Bajaj Finserv
* Shriram Finance
### **Information Technology (IT)**
* Tata Consultancy Services (TCS)
* Infosys
* HCL Technologies
* Wipro
* Tech Mahindra
### **Oil, Gas & Power**
* Reliance Industries
* ONGC
* NTPC
* Power Grid Corporation of India
### **FMCG (Fast Moving Consumer Goods)**
* Hindustan Unilever (HUL)
* ITC
* Nestlé India
* Britannia Industries
### **Automobile**
* Maruti Suzuki India
* Tata Motors
* Mahindra & Mahindra
* Hero MotoCorp
* Bajaj Auto
* Eicher Motors
### **Metals & Mining**
* Tata Steel
* JSW Steel
* Hindalco Industries
* Coal India
### **Pharmaceuticals & Healthcare**
* Sun Pharmaceutical Industries
* Dr. Reddy’s Laboratories
* Cipla
* Divi’s Laboratories
* Apollo Hospitals
### **Cement & Infrastructure**
* UltraTech Cement
* Grasim Industries
* Larsen & Toubro (L&T)
### **Telecom**
* Bharti Airtel
### **Others**
* Adani Enterprises
* Adani Ports & SEZ
* Asian Paints
* UPL
---
⚠️ *Note:*
Nifty 50 constituents are reviewed **twice a year (March & September)** by NSE, so the list may change slightly over time.
If you want, I can also provide:
* Nifty 50 sector weightage
* Latest updated list in table format
* Nifty 50 historical returns
* Best stocks for long-term investment

BTCUSD Consolidates Between Demand and Resistance Price Zones.BTCUSD is trading within a corrective phase after a strong bearish impulse, clearly showing a short-term downward structure. Price action continues to respect the descending trend, with lower highs and controlled pullbacks, indicating that selling pressure is still active. The marked resistance area around the recent highs represents a key supply region where price previously reacted and faced rejection. This zone remains important, as repeated failures above it suggest sellers are defending this level and limiting upside momentum.
On the lower side, a well-defined demand zone is visible near the recent swing lows. This area is supported by multiple price reactions and a short period of consolidation, highlighting the presence of buyers absorbing selling pressure. The demand zone acts as a critical support region and a potential buy interest area if price shows stability and positive reaction within this range. As long as price holds above this demand, a temporary recovery or sideways movement remains possible.
Current market behaviour suggests consolidation between demand and resistance, reflecting a balance between buyers and sellers after the sharp decline. Volatility is expected near both zones, where price may react strongly. Acceptance above resistance would weaken the bearish structure and shift focus toward higher levels, while a sustained move below demand would confirm continuation of downside momentum. Overall, the market remains cautious, with a bearish bias in the short term while price stays below resistance, and key reactions expected around the highlighted demand and resistance areas.
Disclaimer: This analysis is for educational purposes only. It is not financial advice. Trading involves risk and uncertainty.

GER40 Long Scalping SetupGer40 already took 4h low then rejected. I expect we will see on London session price take upper Highs.

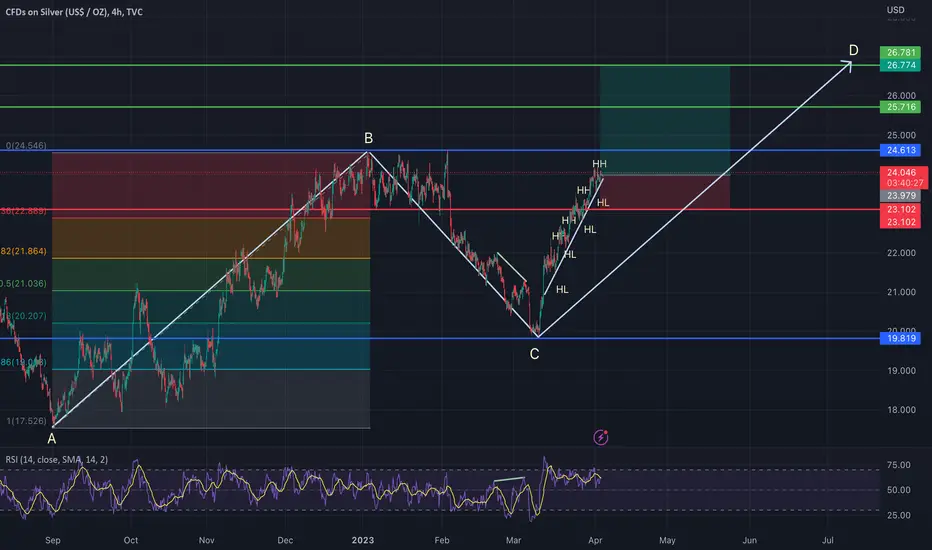
Silver XAGUSD Going LongThe metal is in bullish trend and is making higher highs and higher lows. At a greater timeframe silver has made an ABCD pattern and a correction at C going towards D. The bullish divergence can also be seen. Therefore Going Long on SIlver.
EURUSD LONG 4 HOURSİn the position entered based on the bat pattern , i believe the long position should be maintained , and the target is the potential D point of the newly forming crab pattern .
Entry Level = 1.15130
Stop Level = 1.1450
(To protect against the possibility of the pattern failing , we can move the stop level to point a of the first pattern)
Tp = 1.18617
"Not financial or trading advice -simply sharing my perspective"

GCWL-LONGGCWL is trading in a bullish trend,price is not taking support from rising trend line which gives a buy signal here

Gold's safe-haven properties have been activated to the extreme.Bullish Core Support: Four-Fold Logic Resonance, Maximum Momentum
1.Massive Capital Inflows, ETF and Central Bank Support: The world's largest gold ETF (SPDR) significantly increased its holdings by 6.87 tons from the previous day, reaching 1086.53 tons, a new high in over two years. It also recorded a net inflow of over $500 million during the day, setting a new record for single-day capital inflow, indicating strong institutional bullish sentiment. Central bank gold purchases continue to increase, with the People's Bank of China increasing its holdings for 16 consecutive months, adding 35 tons in January. The average monthly gold purchase by central banks globally remains at a high level of 60-70 tons, creating rigid support and absorbing marginal supply from the market.
2.Escalating US-Europe Geopolitical Conflicts, Extreme Risk Aversion: Trump officially announced a 10% tariff on goods from eight countries, including Denmark, Germany, and France, starting February 1st. The EU is preparing retaliatory countermeasures. Pension funds in Denmark and other countries are accelerating the sale of US bonds and shifting to gold. Geopolitical risks have evolved from a temporary event to a constant support factor. The VIX index surged to 20.09, maximizing the safe-haven attribute of gold.
3.US Dollar Index Hits Three-Month Low, Valuation Pressure Completely Removed: The US dollar index continued to weaken during the day, falling to a low of 97.48, a new three-month low. It is currently trading at 97.207, down 0.45% for the day and a cumulative decline of 1.5% since the beginning of the year, establishing a weak trend. The negative correlation between the dollar and gold is evident; dollar depreciation significantly reduces the cost of holding gold, opening up ample room for a surge in gold prices.
4.Strong Institutional Bullish Consensus, Strong Trend Momentum: Goldman Sachs raised its gold price target to $5400 by the end of 2026, and UBS suggested that it could reach $5400 in extreme scenarios. The market has a high degree of consensus on the upward shift of the gold price center. Gold prices surged by $38.94 in just one hour today, a 0.77% increase. Both domestic and international markets showed strong upward momentum, with London gold and COMEX gold futures rising simultaneously. The daily and hourly charts show a complete bullish pattern, indicating that the trend is likely to continue.
Gold trading strategies
buy:5060-5070
tp:5080-5090-5120
