AUD/USD LONGAfter a new hh create on h4
look for a demand create on h1 on the impulse who create the new hh an buy it
Harmonic Patterns

EPCL: READY TO EXPLORE NEW HORIZONSThe month of December 2025 was quite an eventful for the script. After making a high jump on price ladder it retraced back to the level of 32+. On Fib. scale it is a healthy retracement. On thursday it printed a Doji candle followed by a healthy bullish candle along with healthy volumes. This indicating the strength of bulls.
In this bacdrop we think taking a Long position, with given stop loss, may yeild the TP of Rs,39.26. This is a very strong trade as far as Risk to Reward ratio is concerned.
Due deligence is solicited.

WAVES: ANOTHER WAVE OF JUICY PROFITSIn the month of October 2025 the script posted very handsome gains. Aftewards it goes in to retracement. Now a brief consolidation has taked place and a healthy bullish candle has been formed. Therefore, we may initiate a long positon at suggested level. To protect the capital a stop loss has been identified and a TP, showing potential gain of 18% has been marked on the chart.
Due deligence is solicited.

PCAL: RETRACEMENT SHALL ENHANCE THE PROFIT POTENTIAL.After a breif consolidation the script experienced a quick upthurst of 35% from suggest stop loss level. Now the latest daily candle suggest the price may retrace. We suggest, in view of this retracement that we can open a long position in the Golden Zone of Fib. i.e. around Rs.195. In that case the stop loss level shall be lower than 163 and we may hit the TP of 230 & 248 subsequently.
At this juncture we would allude to weekly chart where the trading of last 2 weeks has left very positive impact suggesting the bull may retain powers for some time to come.
Due deligence is solicited.

$FILUSDT Reload Zone Spotted — Buyers Eye a Fresh Upside LegBINANCE:FILUSDT (1H) is showing a pullback into demand after a sharp impulsive rally. Price has retraced cleanly into a high-confluence demand area, suggesting profit-taking and re-accumulation, not weakness. This zone historically acts as a launchpad when defended.
Market Bias: Bullish continuation
Buy Zone: $1.438 – $1.416 (strong demand support)
Risk Line: A decisive break below $1.408 invalidates the setup
Upside Targets:
🎯 Target 1: $1.484 — first reaction and momentum test
🎯 Target 2: $1.558 — liquidity sweep and impulse extension
As long as FIL holds this demand zone, the structure favors dip buys over panic sells. A strong bounce here could ignite the next breakout toward higher liquidity levels.

PAEL: FRAGRANCE OF CAPITAL GAINS IN THE AIR.Since the start of the Bull Run at PSX the PAEL has been yeilding healthy capital gains in leaps. After posting a significant low on the last day of October 2025 the script has been printing higher highs and higher lows. RSI is also on Bullish Zone therefore, we may expect another leap on price scale and may unfolding the higher price of Rs. 68.
To capitalize on this opportunity a trading plan has been prepared. Again this opportunity has the potential of yeilding the profit ratio of 1:2 so best of luck
Due deligence is solicited.

SOLUSDT Sets Up for Continuation After Advanced Order BlockBINANCE:SOLUSDT (4H) continues to respect a bullish market structure after a strong impulsive advance. Price is now pulling back into a well-defined advanced order block / demand zone, suggesting a healthy retracement and potential reload for the next upside leg rather than a trend reversal.
Bias: Bullish continuation
Entry Zone: $130.90 – $129.40 (advanced order block support)
Invalidation: A decisive breakdown and close below $128.14 invalidates the bullish setup
Upside Targets:
Target 1: $132.93 — first resistance and reaction zone
Target 2: $137.05 — continuation and liquidity build-up area
Final Target: $142.14 — measured move extension and higher-timeframe liquidity
As long as SOL holds above the $130.90–$129.40 demand zone, the structure favors a buy-the-dip continuation. A strong bullish response from this order block could trigger an impulsive breakout toward the higher targets.

Going short on CADJPYLets see how it goes . Entered around 114.300 with Sl at 114.700 and TP1 around 113 and TP2 around 112

ATBA TREND REVERSES.After a long spell of correction the Atlas Battery is showing the signs of recovery. After showing a small Divergence in November it started trading in an upper price channel of Rs, 230-260. Now RSI has shown significant improvement therefore, it has the higher probability of testing next higher high of Rs. 289.89 and sustainance above shall lead the price to Rs. 319.
Wheras sugested entry price and stop loss level suggest the trade has the upside potential of 1:2 or 18%.
Due deligence is solicited.

Crypto Long Night USDT Long Idea with entries on the chart 1r and 2r. Please help yourself
Entry 0.09174
Stoploss 0.08869
TP-1 0.09479
TP-2 0.09784

WIF/USDT at a Critical Line – Breakout or Another Sell-Off?On the 1D timeframe, WIF/USDT is still trading within a bearish market structure after a strong decline from previous highs. Price continues to form lower highs and lower lows, indicating sustained selling pressure. Currently, price is approaching a critical area near the main descending trendline.
---
Pattern & Technical Structure
The chart shows a clear Descending Trendline (Bearish Continuation Pattern):
The descending trendline acts as a dynamic resistance
Every bullish attempt has been rejected near this trendline
Volatility is decreasing, indicating price compression
This structure usually resolves with:
A bullish breakout if buyers manage to break the trendline
A bearish continuation if price gets rejected again
---
Key Levels
Resistance Zones:
0.370 → minor resistance / first reaction zone
0.440 → mid-term resistance & distribution area
0.540 → major resistance / bullish reversal confirmation
0.805 – 0.970 → strong supply zone (extended targets)
Support Zones:
0.327 → current daily support
0.280 → critical support level
0.240 – 0.205 → last demand zone (high-risk area)
---
Bullish Scenario
The bullish scenario becomes valid if:
Price breaks and closes above the descending trendline on a daily basis
A higher low forms after the breakout
Potential upside targets:
Initial target: 0.370
Next resistance: 0.440
Strong reversal confirmation: 0.540
With strong momentum, price may extend toward 0.805 – 0.970
Common strategy:
Buy on breakout or buy on trendline retest
Volume confirmation is highly recommended
---
Bearish Scenario
The bearish scenario remains dominant if:
Price fails to break the descending trendline
Strong rejection occurs at resistance
Downside potential:
Retest of 0.327
Breakdown opens the path toward 0.280
If support fails, price may continue to 0.240 – 0.205
This confirms ongoing bearish continuation.
---
Conclusion
WIF/USDT is currently trading at a decision zone. A confirmed breakout above the descending trendline could signal the start of a trend reversal, while rejection would increase the probability of further downside. Waiting for confirmation is crucial in this structure.
#WIF #WIFUSDT #CryptoAnalysis #TechnicalAnalysis #Altcoin #BearishTrend #Trendline #Breakout #PriceAction #CryptoTrading

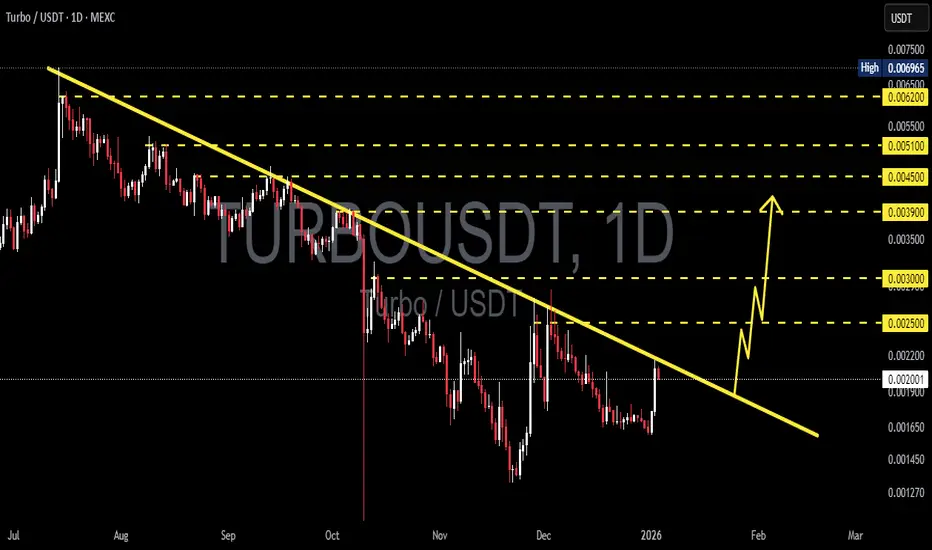
TURBO/USDT Major Downtrend Under Pressure Breakout or Rejection?TURBO/USDT on the 1D timeframe is still moving within a clear medium-term downtrend structure. Price continues to print lower highs and lower lows, capped by a well-respected descending trendline that has been tested multiple times since the previous peak. Currently, price is making a short-term bullish pullback and approaching this critical trendline area.
---
Pattern Explanation
The dominant structure is a Descending Trendline (Bearish Bias).
However, recent price action shows a relief rally, which could evolve into:
An early bullish breakout, if price breaks and holds above the trendline.
A continuation lower high, if price gets rejected and fails at resistance.
This places price in a key decision zone.
---
Key Levels
Resistance Zones:
0.00250 – minor resistance
0.00300 – key resistance
0.00390 – structural resistance
0.00450 – major resistance
0.00510 – supply zone
0.00620 – extreme resistance / previous distribution
Support Zones:
0.00200 – short-term support
0.00165 – critical support
0.00145 – last major support
---
Bullish Scenario
Bullish confirmation occurs if:
Price breaks and closes strongly above the descending trendline on the daily timeframe.
Followed by a clean retest with increasing volume.
Potential upside targets:
0.00250
0.00300
0.00390
0.00450
A clean break above 0.00300 could signal an early medium-term trend reversal.
---
Bearish Scenario
Bearish continuation remains valid if:
Price fails to break the trendline and forms a strong rejection candle.
Strong selling pressure appears around 0.00250 – 0.00300.
Potential downside targets:
0.00200
0.00165
0.00145
A breakdown below 0.00165 may open the door for further downside continuation.
---
Conclusion
TURBO/USDT is currently trading at a highly critical technical zone. As long as price remains below the descending trendline, the broader structure stays bearish.
A confirmed daily breakout above the trendline would be the first early signal of a potential trend reversal. Waiting for confirmation is strongly recommended.
---
#TURBO #TURBOUSDT #CryptoAnalysis #Altcoin #TechnicalAnalysis #Downtrend #Trendline #Breakout #Bearish #Bullish #PriceAction
ONDO/USDT - Major Trendline Test Reversal or Bearish Rejection?ONDO/USDT on the 12H timeframe remains within a clear primary downtrend structure after failing to hold the high area above 0.95. Price continues to form lower highs and lower lows, confirming seller dominance in the medium-term trend.
However, the latest candles show an impulsive bullish reaction from the lower demand zone, with price now testing the descending trendline, which acts as the main dynamic resistance.
---
Pattern & Structure Explanation
Primary Pattern: Descending Trendline (Bearish Structure)
Price has consistently respected the descending trendline → confirming the bearish trend.
The current move is a bullish pullback toward resistance, which is a critical decision area:
Potential rejection point (bearish continuation)
Or an early breakout signal (trend reversal confirmation)
No reversal is confirmed until price achieves a valid break and close above the trendline.
---
Key Levels (Horizontal Structure)
Major Resistance:
0.453 – 0.470 (trendline + minor supply), 0.519, 0.692, 0.761
Major Support:
0.380 – 0.360 (recent demand zone), 0.350 (last structural low)
These levels are clearly defined by previous price reactions and horizontal structure on the chart.
---
Bullish Scenario
The bullish scenario is valid only if:
1. Price breaks and closes above the descending trendline (12H close).
2. A healthy retest holds the 0.45–0.47 zone as new support.
Bullish Targets (Step-by-Step):
0.519 → 0.692 → 0.761 (mid-term recovery target)
Such a breakout would indicate:
The end of bearish momentum
A potential medium-term trend reversal
---
Bearish Scenario
The bearish scenario remains the base case as long as:
1. Price fails to break the descending trendline
2. A clear rejection or bearish candle pattern appears at resistance
Bearish Targets:
0.380 → 0.360
A breakdown below 0.350 would open the path for new lower lows.
Rejection at the trendline often provides an ideal continuation short setup within a downtrend structure.
---
Conclusion
ONDO/USDT is currently trading at a critical decision zone.
The dominant trend remains bearish, while short-term bullish momentum is being tested.
Trendline break = reversal opportunity
Trendline rejection = downtrend continuation
Traders are advised to wait for confirmation, not speculation, as this area will determine the next major move.
---
#ONDO #ONDOUSDT #CryptoAnalysis #TechnicalAnalysis #Downtrend #TrendlineBreak #Altcoin #MarketStructure #PriceAction

PUMPUSDT — Descending Trendline Break Trigger Trend Reversal!On the 1D timeframe, PUMPUSDT remains in a medium-term downtrend after failing to hold the previous high near the 0.0089 area. Price continues to form lower highs and lower lows, indicating that sellers are still in control. However, recent price action shows buyer reaction from the lower support zone, opening the possibility of a short-term recovery or trend reversal if a breakout is confirmed.
---
Pattern Explanation
Price is trading below a descending trendline (yellow line) acting as a strong dynamic resistance. This structure represents a Descending Trendline / Falling Channel setup, where:
Each bullish attempt is rejected at the trendline
Bearish momentum gradually weakens near the bottom
Price begins to form a minor higher low in late December to early January
This suggests early signs of trend exhaustion, but a valid reversal requires confirmation through a breakout.
---
Key Levels
Resistance Levels:
0.00250 → minor resistance (current reaction area)
0.00307 → mid resistance
0.00340 → key resistance
0.00450 → major resistance
0.00517 → strong supply zone
0.00704 – 0.00858 → upper resistance & previous high
Support Levels:
0.00232 → daily support
0.00205 – 0.00190 → major demand zone
0.00170 → last strong support (bullish invalidation level)
---
Bullish Scenario
A bullish scenario will be confirmed if:
Price breaks and closes above the descending trendline
A strong daily close above 0.00250 is achieved
Bullish targets:
0.00307
0.00340
0.00450
0.00517 (extended target if momentum increases)
As long as price holds above 0.00232 and breaks the trendline, trend reversal potential toward bullish continuation remains valid.
---
Bearish Scenario
The bearish scenario remains valid if:
Price fails to break the trendline
Strong rejection occurs around the 0.00250 area
Price breaks below 0.00205
Bearish targets:
0.00190
0.00170
A breakdown below 0.00170 would confirm bearish continuation and invalidate the bullish setup.
---
Conclusion
PUMPUSDT is currently at a critical decision zone. The broader structure is still bearish, but price action shows early recovery signals. The descending trendline breakout is the key confirmation for a potential trend change. Until then, any upward move should be considered a technical rebound.
---
#PUMPUSDT #PUMP #CryptoAnalysis #TechnicalAnalysis #DescendingTrendline
#BreakoutSetup #Altcoin #CryptoTrading #DailyChart #TrendReversal
#SupportResistance

CAN | Daily$Canaan — Bullish Alternate Scenario
Quantum Model Projection | Technical Update
Based on my Quantum Analysis, the transitional Q-Structure φ , with two structural confluences (W and Y), has ultimately converged onto the strong support Q-Structure λ at the apex. This configuration suggests the conclusion of the deep retracement in Intermediate Wave (2).
It set the stage for the projected advance of Intermediate Wave (3)—potentially as an impulsive extension, with a Q-Target ➤ $4.44 💫 generated by the resistance Q-Structure λᵣ for its Minor Wave 3 extension.
📑Notably, all projected Intermediate-degree extensions across the mining sector align with my bullish view on CRYPTOCAP:BTC advanced projection of Primary Wave ⓹ of the impulsive Wave III sequence within the second Cycle.
🔖 This outlook is derived from insights within my Quantum Models framework.

SLNH | DailyNASDAQ:SLNH — Bullish Alternate Scenario📈
Quantum Model Projection | Technical Update
$Soluna surged 31.5%, standing strong as the new year begins. Happy New Year! ✨
Quantum Analysis
The transitional Q-Structure φ has ultimately converged onto the coherent supportive Q-Structure λ₂ at the apex. This configuration indicated the conclusion of the retracement in Minor Wave 4 and set the stage for the projected advance of Minor Wave 5—potentially as an impulsive sequence, with a Q-Target ➤ $8.88 💫 generated by the resistance Q-Structures λ₂ and λ₃ .
Notably, all the projected advances across the mining sector align with my bullish view on BTC’s advanced projection of Primary Wave ⓹ of the impulsive Wave III sequence within the second Cycle.
🔖 This outlook is derived from insights within my Quantum Models framework.

BTC | 4HCRYPTOCAP:BTC — 4H | Trend Reversal | Bottoming Completion
Quantum Analysis
Today, BTC successfully broke out above the resistance Q-Structure λᵣ through the divergent zone and has positioned itself within the projected advance range, reinforcing the bullish case for continued upside trend progression.
Since Nov. 21, BTC has been repeatedly supported by the convergent Q-Structures λ₁, λ₂, λ₃, and λ₄ , forming a coherent and integrated support system (Q-Sup → λ₁ is outside the current frame).
A continued advance toward the origin of the Ending Diagonal ⓒ ➤ $93,558.29 remains favoured and would strongly confirm the Primary-degree trend reversal.
🔖 This potential reversal has been projected since Nov. 15 during the BTC decline.
🔖 This outlook is derived from insights within my Quantum Models framework.

GAL might retest below 500 zoneseverything mentioned on the chart. Company is fundamentally quite strong, hence the overall bias is bullish.
I foresee this stock touching 1000 this year

EUR/USD 4H Technical OutlookEUR/USD is currently trading in a clear bullish structure, supported by a rising trendline that has held price since the early December lows. The market has been printing higher highs and higher lows, confirming buyers remain in control.
Price recently broke above a prior resistance zone (marked with XXX), turning it into a key support area. The current consolidation above this level suggests healthy bullish continuation, rather than weakness.
The projected path shows a potential pullback toward the ascending trendline, which would offer a higher-low entry opportunity if buyers step in. From there, price is expected to resume its upward move, targeting the next resistance zone and ultimately the major high / highest target around 1.1918, which aligns with previous market structure resistance.
As long as price respects the rising trendline and holds above the broken resistance, the bullish bias remains intact. A clean break below the trendline would be the first warning sign of momentum loss.

ADAUSDT Near Major Breakout Level — Trend Reversal or Bull Trap?On the 12-hour timeframe, ADAUSDT remains within a clear medium-term downtrend structure. Over the past few months, price has consistently formed lower highs and lower lows, capped by a dominant descending trendline.
However, recent price action shows an early bullish reaction from the lower support area, suggesting a potential transition phase or a short-term relief rally.
---
Pattern & Technical Structure
Primary Pattern:
Descending Trendline / Bearish Channel Breakdown Test
Price has been trading below the descending trendline (dynamic resistance) for an extended period.
The latest candles indicate a retest of the trendline, which now acts as a critical decision zone.
The marked horizontal levels (yellow dashed lines) represent key historical support and resistance zones.
Pattern Summary:
As long as price remains below the trendline, the broader structure stays bearish. A valid break and close above the trendline would be the first signal of a potential trend reversal or short-term bullish continuation.
---
Key Levels
Major Resistance:
0.413
0.468
0.520
High Resistance / Reversal Zone:
0.616 – 0.682
Key Support:
0.370
0.345
0.321 (structural low)
---
Bullish Scenario
Price successfully breaks and closes above the descending trendline (12H close).
Trendline flips into support after a successful retest.
Upside targets:
TP1: 0.413
TP2: 0.468
TP3: 0.520
If bullish momentum and volume expand, further upside toward 0.616 – 0.682 becomes possible.
Bullish Confirmation:
Higher low formation
Minor market structure shift
Strong candle close, not just a wick
---
Bearish Scenario
Price fails to break the trendline and forms a clear rejection (long upper wick / bearish engulfing).
Price revisits lower support zones:
First support: 0.370
Next support: 0.345
Worst-case scenario: 0.321 (new lower low)
A breakdown below 0.321 would confirm continuation of the major downtrend.
Bearish Confirmation:
Clear rejection at the trendline
Lower high formation
Increasing selling volume
---
Conclusion
ADAUSDT is currently at a critical decision zone.
The macro trend remains bearish, but the recent bullish reaction from lower support opens room for a short-term reversal or relief rally.
Traders are advised to wait for confirmation — either a breakout or rejection — at the trendline, as this area will define the next major move.
---
#ADA #ADAUSDT #Cardano #CryptoAnalysis #TechnicalAnalysis #Downtrend #Trendline #SupportResistance #Altcoins

Analysis on BTCUSDT Q12026: long term still up trendDear all
In the big picture if 74k can hold, it still can potentially going up.
Long bias should still be intact.
Next, the lower timeframe, it is still in sideway stage where
it either break 91k or go back down to 83-84k again first
then the target would be 102-104k. then need to wait and see
i cannot analyze further,
Best of luck

XAUUSD 4H – Heavy Sell-Off After $4550 RejectionOn the 4H timeframe, Gold previously showed a strong bullish move, pushing price up to the $4550 high, where price clearly faced a major resistance zone marked on the chart. From this resistance, the market reacted sharply and entered a very strong bearish correction.
After rejecting the resistance area, price dropped aggressively from $4550 down to around $4300, creating a fast and impulsive sell-off. This move broke short-term structure and left a clear imbalance on the downside, visible through long bearish candles.
Following the drop, price attempted a recovery but failed to break the near-term resistance zone around $4400. This level acted as resistance, and price was rejected again, confirming sellers are still active at higher levels.
Currently, Gold is trading near $4330, moving between resistance above and a support zone below. The chart clearly highlights a support area around $4270–$4300, where price previously reacted and where buyers stepped in.
The red arrow on the chart indicates a possible continuation move toward the lower support zone, suggesting that price may revisit the $4270–$4250 area before a stronger directional move occurs.
🔑 Key Levels from the Chart
Major Resistance: $4550
Near-Term Resistance: ~$4400
Current Price Area: ~$4330
Support Zone: $4270 – $4250

Large Bearish Order Block in Control⚠️ Risk Update: Large Bearish Order Block in Control
A large and long-term Bearish Order Block has formed and is currently dominating price action.
This structure suggests that the recent upside may have been a liquidity-driven move, and the market is now positioned for a potential major downside expansion.
📉 Downside Scenarios to Consider
$2,800
→ First major downside target
→ A level where price could decline relatively smoothly if selling pressure continues
Maximum downside extension: $2,200
→ This scenario should remain open-minded and prepared for
→ Possible if heavy distribution and panic-driven selling accelerate
🔍 Key Notes
This is not a random pullback, but a structural reaction to a dominant bearish order block
Any short-term bounce should be treated as relief or retracement, not trend reversal
Risk management and capital preservation are critical in this zone
⚠️ Conclusion
A large downside move is possible.
Traders should stay prepared, avoid overexposure, and prioritize defensive positioning.
Prepare for risk before the market forces you to.
