PROMUSDT Forming Falling WedgePROMUSDT is forming a clear falling wedge pattern, a classic bullish reversal signal that often indicates an upcoming breakout. The price has been consolidating within a narrowing range, suggesting that selling pressure is weakening while buyers are beginning to regain control. With consistent volume confirming accumulation at lower levels, the setup hints at a potential bullish breakout soon. The projected move could lead to an impressive gain of around 50% to 60% once the price breaks above the wedge resistance.
This falling wedge pattern is typically seen at the end of downtrends or corrective phases, and it represents a potential shift in market sentiment from bearish to bullish. Traders closely watching PROMUSDT are noting the strengthening momentum as it nears a breakout zone. The good trading volume adds confidence to this pattern, showing that market participants are positioning early in anticipation of a reversal.
Investors’ growing interest in PROMUSDT reflects rising confidence in the project’s long-term fundamentals and current technical strength. If the breakout confirms with sustained volume, this could mark the start of a fresh bullish leg. Traders might find this a valuable setup for medium-term gains, especially as the wedge pattern completes and buying momentum accelerates.
✅ Show your support by hitting the like button and
✅ Leaving a comment below! (What is your opinion about this Coin?)
Your feedback and engagement keep me inspired to share more insightful market analysis with you!
Harmonic Patterns

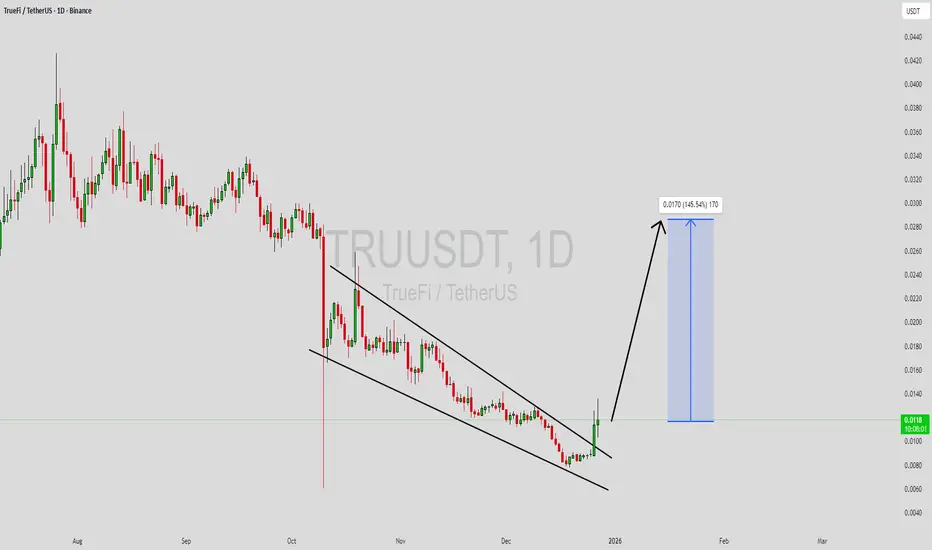
TRUUSDT Forming Falling WedgeTRUUSDT is forming a clear falling wedge pattern, a classic bullish reversal signal that often indicates an upcoming breakout. The price has been consolidating within a narrowing range, suggesting that selling pressure is weakening while buyers are beginning to regain control. With consistent volume confirming accumulation at lower levels, the setup hints at a potential bullish breakout soon. The projected move could lead to an impressive gain of around 90% to 100% once the price breaks above the wedge resistance.
This falling wedge pattern is typically seen at the end of downtrends or corrective phases, and it represents a potential shift in market sentiment from bearish to bullish. Traders closely watching TRUUSDT are noting the strengthening momentum as it nears a breakout zone. The good trading volume adds confidence to this pattern, showing that market participants are positioning early in anticipation of a reversal.
Investors’ growing interest in TRUUSDT reflects rising confidence in the project’s long-term fundamentals and current technical strength. If the breakout confirms with sustained volume, this could mark the start of a fresh bullish leg. Traders might find this a valuable setup for medium-term gains, especially as the wedge pattern completes and buying momentum accelerates.
✅ Show your support by hitting the like button and
✅ Leaving a comment below! (What is your opinion about this Coin?)
Your feedback and engagement keep me inspired to share more insightful market analysis with you!
Bullish Sharkfin Divergence for BTC, Expect 140k Inverse Bearish Sharkfin Divergence for BTC, Expect 140k
Check out my old Sharkfin Divergences :D

ETH Price Compression | Low Volume, Big Move AheadHello and greetings to all traders 👋
Hope you’re doing great, and Merry Christmas 🎄🎅 in advance to everyone celebrating.
Let’s take a look at Ethereum (ETHUSDT) on the 4H timeframe.
🔹 Brief Overview of Ethereum
Ethereum is the second-largest cryptocurrency after Bitcoin and the backbone of the DeFi, NFT, and Smart Contract ecosystem.
ETH price action often combines strong fundamentals with high sensitivity to key technical levels, especially during ranging market phases.
📊 Technical Analysis – ETHUSDT (4H)
Currently, price is moving inside a range-bound structure (No Trade Zone).
🔸 Trading volume is decreasing
🔸 The market is waiting for a confirmed breakout
🔸 Early entries carry higher risk
⚪ Current Range Zone
Range low: Key support level marked on the chart
Range high: Dynamic resistance (upper trendline)
As long as price remains between these levels, the market behavior is expected to stay choppy and indecisive.
🟢 Bullish Scenario
If we see:
✅ A valid breakout above the static resistance
✅ A confirmed 4H candle close above the trendline
✅ An increase in trading volume
Then we can expect:
Price to exit the range
Continuation toward higher targets
A structural shift from range to bullish continuation
📈 In this case, a pullback to the broken resistance could offer a lower-risk long opportunity.
🔴 Bearish Scenario
If:
❌ Price loses the range low support
❌ A 4H candle closes below the marked support
❌ strong volume continues
Possible outcome:
Increased selling pressure
Movement toward lower support levels
Deeper correction or extended consolidation
📉 In this scenario, rushing into long positions is not recommended.
⚠️ Key Notes
The market is currently low-volume and range-bound
Best approach: wait for confirmation
Trading inside the range is suitable only for experienced traders
❗ Disclaimer
This analysis is for educational purposes only and does not constitute financial advice.
Always manage your risk and capital responsibly. 🧠📉
📊 What’s Your Bias?
🔘 Will ETH break to the upside?
🔘 Will support fail?
🔘 Or will the range continue?
👇 Vote and share your thoughts in the comments:
🚀 Bullish
🐻 Bearish
🔄 Range / Sideways
🔖 Tags
#ETH #ETHUSDT #Ethereum #Crypto
#TechnicalAnalysis #PriceAction
#SupportAndResistance #RangeMarket
#Altcoins #TradingView #4H
#Breakout #RiskManagement

STABLEUSDT | Perfect C&H FormationHello traders,
A perfect C&H formation is always welcome to see on our charts. Pretty simple with a very good R:R
What you want to look for as a TP target is the same depth of the cup.aka.distance from SH to SL.
Good Luck!
All our analysis is shared with honesty, care, and real effort. If you find value in it, a like or comment means a lot to show your support🙏📊

USDCAD, We need a up leg in US. On the USDCAD pair, the most logical expectation would be for price to continue falling, but from these levels and considering the time of year, a small bullish rebound is more than reasonable.
Remember to protect the trade around breakeven as soon as possible.
Thanks and blessings. 🎄📈✨


EURCAD TRADE BREAKDOWN WIN 12/25/2025Market come to our set up during holiday pull the trigger and set and forget.

BTCUSDT SELLIf we see signs of a reversal, we expect a return to the first TP after the bottom is hit. Divergence conditions should also be considered when trading.

$BTCUSDT weekly analysis!BINANCE:BTCUSDT is testing a major confluence support where the rising trendline meets horizontal demand.
This zone has been respected multiple times in the past.
Holding here keeps the macro uptrend intact.
A weekly close below would open room for deeper correction.
Key zone to watch. No panic, no FOMO.

Emerging Market Impact: Opportunities and Risks1. Defining Emerging Markets
Emerging markets are generally characterized by rapid economic growth, improving infrastructure, expanding industrial and service sectors, and increasing integration into global trade and financial systems. Economies like India, Brazil, China, Indonesia, and South Africa are often cited as prime examples, while countries in Southeast Asia, Latin America, and parts of Africa are also included depending on their growth trajectory and market openness. Key indicators used to classify emerging markets include GDP growth rate, market capitalization, per capita income, level of industrialization, and regulatory environment.
2. Economic Growth and Global Influence
Emerging markets have become significant drivers of global growth. They account for a substantial share of world GDP, often outpacing developed economies in growth rates. Rapid urbanization, demographic dividends, and rising consumption have fueled their economic expansion. For instance, the burgeoning middle class in India and China has transformed global demand patterns, influencing commodities, consumer goods, and technology markets worldwide. Consequently, multinational corporations increasingly target these regions for growth, investment, and market diversification.
3. Investment Opportunities
The growth potential of emerging markets attracts global investors seeking higher returns than those typically available in mature economies. Equity markets in these regions often exhibit higher volatility, but this is offset by higher expected growth. Sectors like technology, renewable energy, healthcare, and infrastructure are particularly promising due to the rising demand from a growing population and improving economic conditions. Additionally, the liberalization of financial markets and the gradual easing of capital controls in many emerging economies have facilitated foreign direct investment (FDI), portfolio investment, and cross-border partnerships.
4. Risks and Volatility
Despite their potential, emerging markets are inherently riskier than developed markets. Political instability, regulatory uncertainties, corruption, currency fluctuations, and exposure to global economic shocks can create substantial volatility. For example, sudden changes in interest rates in developed economies or commodity price swings can trigger capital outflows, devaluation of local currencies, and financial stress. Moreover, dependence on specific sectors, such as commodities or manufacturing exports, makes these markets vulnerable to global demand shifts.
5. Social and Demographic Impacts
Emerging markets are often marked by young and growing populations, urban migration, and evolving consumer behavior. This demographic advantage can accelerate economic growth, drive innovation, and expand domestic markets. However, social challenges, such as income inequality, inadequate education systems, and insufficient healthcare infrastructure, can hinder sustainable development. Governments and policymakers must balance economic liberalization with social investments to ensure inclusive growth that benefits all layers of society.
6. Technological Leapfrogging
A defining feature of many emerging markets is their ability to bypass traditional developmental stages through technology adoption. For instance, mobile banking in Africa, e-commerce in Southeast Asia, and renewable energy initiatives in Latin America showcase how emerging economies leverage innovation to overcome infrastructure deficits. Technological leapfrogging not only accelerates growth but also reshapes global competition, providing these markets with a strategic advantage in specific industries.
7. Global Trade and Supply Chain Integration
Emerging markets play a crucial role in global trade and supply chains. Countries like China, India, and Vietnam are key manufacturing hubs, supplying products ranging from electronics to textiles. Trade agreements, export incentives, and regional economic partnerships further integrate these economies into global commerce. However, dependence on exports can make emerging markets vulnerable to trade tensions, tariffs, and geopolitical disruptions. Consequently, diversifying trade partners and strengthening domestic industries are vital strategies for mitigating external shocks.
8. Policy and Governance Implications
Strong institutions, transparent governance, and sound economic policies are essential for sustaining growth in emerging markets. Policies that promote investment, financial stability, innovation, and infrastructure development can enhance competitiveness and attract long-term capital. Conversely, weak governance, political instability, or policy inconsistency can undermine investor confidence and exacerbate economic volatility. International organizations, including the IMF and World Bank, often provide guidance and support to emerging markets to stabilize economies and encourage sustainable growth.
9. Environmental and Sustainability Considerations
As emerging markets industrialize, they face environmental challenges, including pollution, deforestation, and resource depletion. Sustainable growth strategies, such as investing in green technologies, renewable energy, and efficient urban planning, are increasingly prioritized. Global pressure for environmental accountability and adherence to climate agreements influences policy decisions and investment flows. Emerging markets that successfully integrate sustainability into their growth models are likely to gain competitive advantages in the global economy.
10. The Future Outlook
The impact of emerging markets on the global economy is set to increase. Rising consumption, technological innovation, and strategic geopolitical positioning will continue to shape global trade and investment patterns. Investors and policymakers must adopt nuanced strategies that balance the pursuit of growth with the management of risk. For global markets, emerging economies are both an engine of opportunity and a source of potential volatility, requiring informed engagement, robust risk management, and strategic foresight.
In conclusion, emerging markets represent a complex but promising facet of the modern global economy. Their rapid growth, youthful demographics, and increasing global integration create opportunities for investment, trade, and technological advancement. At the same time, they pose risks through volatility, political uncertainty, and social challenges. Understanding the multifaceted impact of emerging markets is essential for stakeholders seeking to harness their potential while mitigating associated risks.

Economic Future at RiskChallenges, Uncertainties, and the Road Ahead
The global economic future stands at a critical crossroads. Over the past few decades, the world has experienced rapid growth driven by globalization, technological advancement, and expanding financial markets. However, today this progress is increasingly threatened by a complex mix of structural weaknesses, geopolitical tensions, environmental pressures, and social imbalances. The phrase “economic future at risk” captures not just a temporary slowdown, but a deeper concern about the sustainability and resilience of the global economic system. Understanding these risks is essential for governments, businesses, investors, and individuals who must navigate an uncertain path ahead.
One of the most significant threats to the economic future is rising global debt. Governments, corporations, and households have accumulated unprecedented levels of borrowing. While debt can support growth during stable periods, excessive leverage becomes dangerous when interest rates rise or economic growth slows. Many countries now face a difficult balancing act: tightening monetary policy to control inflation while avoiding debt crises and financial instability. If debt burdens become unmanageable, the result could be widespread defaults, banking stress, and prolonged economic stagnation.
Inflation and monetary instability also pose serious risks. After years of low inflation, many economies have experienced sharp price increases driven by supply chain disruptions, energy shocks, and expansive fiscal and monetary policies. High inflation erodes purchasing power, increases inequality, and reduces consumer confidence. At the same time, aggressive interest rate hikes designed to curb inflation can slow investment, weaken housing markets, and trigger recessions. The challenge lies in achieving price stability without causing long-term damage to economic growth.
Geopolitical tensions further complicate the economic outlook. Trade wars, sanctions, regional conflicts, and shifting alliances have disrupted global supply chains and reduced international cooperation. The world economy, once deeply interconnected, is now facing fragmentation as countries prioritize strategic autonomy over efficiency. This shift increases costs, reduces productivity, and limits the benefits of globalization that previously supported growth, especially in emerging markets. Prolonged geopolitical instability can discourage foreign investment and increase market volatility, putting long-term development at risk.
Technological change, while offering immense opportunities, also introduces new economic challenges. Automation, artificial intelligence, and digital platforms are transforming industries at an unprecedented pace. While productivity may improve, job displacement remains a major concern. Large segments of the workforce risk becoming obsolete without adequate reskilling and education. If technological progress benefits only a small segment of society, income inequality could widen further, leading to social unrest and political instability that undermine economic growth.
Climate change represents one of the most profound long-term risks to the global economy. Extreme weather events, rising sea levels, and environmental degradation threaten agriculture, infrastructure, and human livelihoods. The economic costs of climate-related disasters are already rising, straining public finances and insurance systems. At the same time, the transition to a low-carbon economy requires massive investment and structural change. Failure to manage this transition effectively could result in energy shortages, higher costs, and uneven growth across regions.
Demographic shifts add another layer of uncertainty. Many developed and some emerging economies are facing aging populations, declining birth rates, and shrinking workforces. This demographic trend places pressure on pension systems, healthcare spending, and overall productivity. Fewer workers supporting more retirees can slow economic growth and increase fiscal stress. Conversely, countries with young populations face the challenge of creating enough jobs and opportunities to avoid unemployment and social instability.
Inequality, both within and between countries, remains a persistent threat to economic stability. Wealth and income disparities have grown in many parts of the world, limiting social mobility and reducing aggregate demand. When economic growth benefits only a small portion of society, consumer spending weakens and trust in institutions erodes. This can lead to political polarization and policy uncertainty, which further undermines long-term economic planning and investment.
Financial market volatility is another warning signal. Asset bubbles fueled by easy liquidity and speculative behavior increase the risk of sudden corrections. Stock markets, real estate, and even alternative assets can become disconnected from underlying economic fundamentals. When these bubbles burst, the consequences often extend beyond investors to the broader economy through reduced wealth, lower confidence, and tighter credit conditions.
Despite these challenges, the economic future is not predetermined. Risk does not automatically mean decline; it highlights the need for adaptation, reform, and strategic thinking. Governments can strengthen economic resilience through prudent fiscal management, structural reforms, and investment in education, healthcare, and infrastructure. Businesses can focus on innovation, sustainability, and workforce development to remain competitive. Individuals can improve financial literacy and adaptability to navigate changing economic conditions.
In conclusion, the global economic future is indeed at risk, shaped by a convergence of debt pressures, inflation, geopolitical tensions, technological disruption, climate change, and social inequality. These risks are interconnected and require coordinated responses rather than isolated solutions. The choices made today by policymakers, institutions, and societies will determine whether the coming decades are marked by prolonged instability or a renewed phase of sustainable and inclusive growth. Recognizing the risks is the first step toward securing a more stable and prosperous economic future.

Global Commodity TrendsForces Shaping the Future of Raw Material Markets
Global commodity markets play a foundational role in the world economy. Commodities such as crude oil, natural gas, gold, agricultural products, and industrial metals form the backbone of industrial production, energy generation, food security, and financial systems. Over the past decade, global commodity trends have evolved significantly due to shifting geopolitical dynamics, technological innovation, climate change, monetary policy cycles, and changing demand patterns from emerging and developed economies. Understanding these trends is crucial for investors, policymakers, businesses, and traders who seek to navigate volatility and identify long-term opportunities.
Macroeconomic Drivers of Commodity Trends
One of the most influential forces shaping global commodity trends is the macroeconomic environment. Economic growth directly impacts commodity demand. During periods of expansion, industrial metals like copper, aluminum, and steel see rising demand due to increased construction, infrastructure development, and manufacturing. Conversely, economic slowdowns or recessions typically reduce demand, leading to price corrections.
Inflation and interest rate cycles also play a major role. Commodities are often considered a hedge against inflation, particularly precious metals such as gold and silver. When central banks adopt accommodative monetary policies and real interest rates fall, commodity prices often rise as investors seek to preserve purchasing power. In contrast, aggressive interest rate hikes can strengthen currencies like the US dollar, making commodities more expensive for non-dollar economies and putting downward pressure on prices.
Energy Commodities: Transition and Volatility
Energy commodities remain among the most closely watched segments of the global commodity market. Crude oil and natural gas prices are heavily influenced by geopolitical tensions, production decisions by major exporting nations, and global energy demand. Conflicts, sanctions, and supply disruptions can trigger sharp price spikes, while oversupply or weak demand can lead to prolonged downturns.
At the same time, the global energy transition is reshaping long-term trends. The shift toward renewable energy sources, electric vehicles, and decarbonization policies is gradually altering demand patterns. While oil and gas remain critical in the near to medium term, metals such as lithium, nickel, cobalt, and copper are experiencing structural demand growth due to their importance in batteries, renewable infrastructure, and electrification. This transition has introduced a new layer of complexity, where traditional energy markets coexist with rapidly expanding green commodity ecosystems.
Industrial Metals and Infrastructure Growth
Industrial metals are closely tied to global industrialization and urbanization. Copper, often seen as a barometer of economic health, benefits from rising investment in power grids, electric vehicles, and renewable energy. Aluminum and steel remain essential for construction, transportation, and packaging.
Emerging economies, particularly in Asia, Africa, and Latin America, continue to drive long-term demand for industrial metals as they invest in infrastructure, housing, and manufacturing capacity. At the same time, supply-side challenges such as declining ore grades, environmental regulations, and long project development timelines have constrained production growth. This imbalance between supply and demand has supported higher price floors for many industrial metals.
Precious Metals: Safe Havens and Strategic Assets
Precious metals occupy a unique position in global commodity trends. Gold, in particular, serves both as a financial asset and a store of value. During periods of economic uncertainty, geopolitical risk, or financial market stress, investors tend to increase exposure to gold, driving prices higher. Central banks have also increased gold reserves in recent years to diversify away from currency risk.
Silver, platinum, and palladium have a dual role as both precious and industrial metals. Their prices are influenced not only by investment demand but also by industrial applications such as electronics, automotive catalysts, and renewable technologies. As green technologies expand, some precious metals are gaining renewed strategic importance.
Agricultural Commodities and Food Security
Agricultural commodities are increasingly shaped by climate change, population growth, and shifting consumption patterns. Extreme weather events such as droughts, floods, and heatwaves have disrupted crop yields, leading to higher price volatility in grains, oilseeds, and soft commodities. Climate-related risks are now a central consideration in agricultural commodity forecasting.
Rising global population and changing dietary preferences, particularly increased protein consumption in developing economies, have boosted demand for crops like corn and soybeans. At the same time, input costs such as fertilizers, fuel, and labor have risen, adding pressure on food prices. As food security becomes a global priority, agricultural commodities are likely to remain strategically important and politically sensitive.
Geopolitics and Supply Chain Realignment
Geopolitical factors have become more prominent in shaping global commodity trends. Trade restrictions, sanctions, export controls, and strategic resource nationalism have disrupted traditional supply chains. Countries are increasingly prioritizing domestic production and secure access to critical commodities, particularly those essential for energy transition and defense.
This shift has led to supply chain diversification, nearshoring, and strategic stockpiling. While these measures aim to enhance resilience, they can also increase costs and reduce efficiency, contributing to higher long-term commodity prices. Geopolitical risk premiums are now a persistent feature of commodity markets rather than a temporary anomaly.
Financialization and Investor Participation
Commodities are no longer solely driven by physical supply and demand. Financial investors, including hedge funds, institutional investors, and retail traders, play a significant role in price movements. Exchange-traded funds, futures markets, and algorithmic trading have increased liquidity but also amplified short-term volatility.
Speculative positioning can sometimes exaggerate price trends, leading to sharp rallies or corrections disconnected from immediate fundamentals. As a result, understanding market sentiment and positioning has become just as important as analyzing physical demand and supply.
Conclusion: A Complex and Evolving Landscape
Global commodity trends reflect a complex interplay of economic growth, energy transition, geopolitical dynamics, climate change, and financial market behavior. While short-term price movements remain volatile and often unpredictable, long-term trends point toward sustained importance of commodities in a resource-constrained and transitioning global economy. Energy transformation, infrastructure development, and food security challenges are likely to keep commodities at the center of global economic strategy. For market participants, success lies in understanding not just individual commodities, but the broader forces shaping the global commodity landscape.

The Future of Global Trade in an AI-Driven EconomyAI as a Catalyst for Trade Efficiency
AI has the potential to revolutionize global trade by optimizing supply chains, reducing costs, and improving decision-making. Traditionally, trade operations have been hampered by inefficiencies such as manual logistics management, inaccurate demand forecasting, and bureaucratic delays in customs and regulatory processes. With AI-driven tools, companies can leverage predictive analytics, real-time monitoring, and machine learning algorithms to anticipate demand, optimize inventory levels, and streamline transportation routes. This results in faster delivery times, reduced wastage, and cost savings, making global trade more resilient and responsive.
Moreover, AI-driven automation in ports, warehouses, and customs processing can dramatically reduce administrative bottlenecks. Smart logistics systems can dynamically reroute shipments in response to geopolitical events, weather disruptions, or sudden demand spikes. In this sense, AI doesn’t just improve efficiency—it makes global trade more adaptive and risk-aware.
AI and the Reconfiguration of Global Supply Chains
One of the most significant impacts of an AI-driven economy is likely to be the reconfiguration of global supply chains. Currently, many supply chains are linear and reliant on low-cost labor markets. However, AI and robotics reduce dependence on human labor for routine manufacturing, assembly, and logistics tasks. This technological shift could incentivize reshoring or nearshoring of production to countries with advanced AI infrastructure, high-quality labor, and robust digital ecosystems.
Additionally, AI allows for highly granular demand forecasting and production planning. Manufacturers can produce goods closer to real-time demand, reducing inventory costs and minimizing overproduction. This efficiency may lead to more localized production hubs that cater to regional markets while still maintaining connectivity to global trade networks. Consequently, the geography of trade could evolve, with AI enabling more balanced and resilient supply chains that are less susceptible to global shocks.
Trade in Services and Knowledge Economies
The impact of AI on global trade extends beyond physical goods. Services, particularly those driven by digital platforms, are poised to dominate international commerce. AI enables sophisticated financial services, healthcare diagnostics, education platforms, and software development to cross borders without physical shipment. Countries that invest heavily in AI research and talent may become dominant exporters of knowledge and services, reshaping traditional trade hierarchies.
Moreover, AI facilitates more precise and personalized services, allowing companies to cater to niche international markets. For example, AI-powered translation, customer support, and content creation tools make it easier for businesses to enter multiple markets simultaneously, accelerating the globalization of services.
AI-Driven Trade Policy and Regulatory Challenges
The rise of AI in global trade is also likely to necessitate a reevaluation of trade policies and regulations. Governments will face questions about data sovereignty, intellectual property, AI ethics, and cross-border digital taxation. AI algorithms can generate highly detailed economic insights, allowing countries to design trade strategies with unprecedented precision. However, this also raises concerns about fairness, transparency, and the potential for AI-driven economic protectionism.
International trade agreements may need to evolve to address AI-specific issues. For instance, rules governing automated pricing algorithms, AI-based customs processing, and cross-border data flows will become central to maintaining fair competition. Countries that adapt quickly to these regulatory challenges while fostering AI innovation are likely to gain a strategic advantage in the AI-driven global economy.
Investment and Competitiveness in an AI Economy
Investment patterns in the AI-driven economy will significantly shape global trade dynamics. Corporations and nations that prioritize AI research, infrastructure, and digital talent will emerge as global leaders. These leaders will have the capacity to produce goods and services more efficiently, innovate rapidly, and respond to market fluctuations with agility. As a result, AI may exacerbate existing trade imbalances unless lagging nations adopt targeted policies to catch up in AI development.
Furthermore, AI can enhance market intelligence, allowing businesses to identify emerging trends, untapped markets, and potential risks. Firms equipped with AI-driven analytics will be able to adjust their international trade strategies more quickly, gaining competitive advantages in a volatile global economy. This heightened level of sophistication in trade management may reshape global market shares and influence geopolitical relationships.
Risks and Ethical Considerations
While the AI-driven economy presents numerous opportunities for global trade, it also introduces risks. Over-reliance on AI could lead to systemic vulnerabilities if algorithms malfunction or are manipulated. Cybersecurity threats in AI-controlled trade networks may disrupt global commerce. Additionally, AI adoption may exacerbate inequalities between technologically advanced nations and those with limited access to AI infrastructure.
Ethical considerations, such as algorithmic bias, labor displacement, and environmental sustainability, will also play a crucial role. As AI optimizes production and logistics, the pressure on labor markets in low-cost manufacturing countries could intensify. Addressing these challenges requires coordinated international policies, social safeguards, and investment in AI literacy and workforce reskilling.
Conclusion
The future of global trade in an AI-driven economy is characterized by efficiency, precision, and adaptability, but also by significant structural shifts and challenges. AI is poised to redefine how goods and services are produced, transported, and consumed across the globe. It will reshape supply chains, enhance service exports, influence investment flows, and necessitate new regulatory frameworks. Countries and companies that strategically embrace AI technologies while addressing ethical and social implications will be well-positioned to lead in this evolving trade landscape.
Ultimately, the AI-driven global economy promises a world where trade is smarter, faster, and more interconnected. Yet, the transition will require careful management of technological, economic, and social risks. By balancing innovation with responsibility, the international community can harness AI to create a more efficient, equitable, and resilient global trade system.

AI, Artificial Intelligence and the Technology Stock RallyThe rapid rise of artificial intelligence (AI) has become one of the most powerful forces shaping the modern global economy, financial markets, and especially the performance of technology stocks. Over the last few years, AI has moved from being a futuristic concept discussed mainly in research labs to a practical, revenue-generating technology embedded across industries. This transformation has triggered a strong rally in technology stocks, as investors increasingly view AI as a long-term growth engine capable of reshaping productivity, profitability, and competitive advantage.
The Evolution of AI from Concept to Commercial Reality
Artificial intelligence is no longer limited to simple automation or rule-based systems. Modern AI, particularly machine learning, deep learning, and generative AI, has the ability to learn from massive datasets, identify patterns, and make decisions with minimal human intervention. This evolution has allowed AI to move into real-world applications such as natural language processing, image recognition, predictive analytics, robotics, autonomous systems, and advanced recommendation engines.
As AI tools became more accurate, scalable, and cost-efficient, corporations started integrating them into their core operations. Cloud computing and powerful semiconductor chips accelerated this shift by providing the infrastructure required to train and deploy AI models at scale. This technological maturity played a critical role in convincing investors that AI was not just hype but a sustainable driver of long-term earnings growth.
Why AI Became a Catalyst for the Tech Stock Rally
The rally in technology stocks driven by AI is rooted in expectations of future cash flows and market dominance. Investors tend to reward companies that demonstrate strong growth potential, pricing power, and the ability to disrupt traditional business models. AI offers all three.
Technology companies at the forefront of AI development benefit from first-mover advantages, proprietary data, and high barriers to entry. Firms that design AI chips, cloud platforms, and foundational models have become essential suppliers to the digital economy. As demand for AI computing power and services surged, revenues, margins, and forward guidance for these companies improved, fueling upward momentum in their stock prices.
Moreover, AI is not confined to a single niche. It has applications across software, hardware, internet services, cybersecurity, healthcare technology, fintech, and even consumer electronics. This broad applicability expanded the rally beyond a handful of companies and lifted entire segments of the technology sector.
Role of Semiconductors in the AI Boom
One of the most visible impacts of the AI revolution has been in the semiconductor industry. AI models require immense computational power, which has driven demand for high-performance processors, graphics processing units (GPUs), and specialized AI accelerators. Semiconductor companies producing advanced chips became the backbone of the AI ecosystem.
The surge in demand for these chips resulted in record order books, pricing strength, and long-term supply agreements. Investors recognized that AI adoption would not be a one-time event but a multi-year cycle requiring continuous upgrades in hardware. This expectation significantly boosted valuations of leading chipmakers and suppliers across the semiconductor value chain.
Cloud Computing and Software Companies as Key Beneficiaries
Cloud computing platforms have played a central role in democratizing access to AI. Instead of building expensive in-house infrastructure, companies can now use AI tools through cloud-based services. This shift has driven strong growth for technology firms offering AI-enabled cloud solutions.
Software companies have also benefited by embedding AI into enterprise tools such as customer relationship management, data analytics, productivity software, and cybersecurity platforms. AI-enhanced software improves efficiency, reduces costs, and enables better decision-making for clients, making these products more valuable and harder to replace. As a result, recurring revenue models became stronger, reinforcing investor confidence and contributing to the tech stock rally.
Investor Psychology and Market Narratives
Market rallies are not driven by fundamentals alone; narratives and investor psychology play a crucial role. AI captured the imagination of investors as a “next industrial revolution,” similar to the internet boom or the smartphone era. This narrative attracted institutional investors, hedge funds, and retail participants, all seeking exposure to AI-driven growth.
The fear of missing out (FOMO) further intensified buying pressure, especially in high-profile technology stocks associated with AI leadership. Positive earnings surprises, ambitious investment plans, and optimistic guidance reinforced the belief that AI leaders would dominate future markets, justifying premium valuations.
Productivity, Profitability, and Long-Term Economic Impact
One of the strongest arguments supporting the AI-driven tech rally is its potential to boost productivity at a macroeconomic level. AI can automate repetitive tasks, enhance research and development, optimize supply chains, and improve customer engagement. These productivity gains translate into higher profit margins and faster revenue growth for companies that adopt AI effectively.
From a long-term perspective, AI could reshape labor markets, business models, and competitive dynamics. Companies that successfully integrate AI may achieve scale advantages that are difficult for competitors to replicate. Investors are pricing in these structural benefits, which explains why AI-related technology stocks often trade at higher multiples compared to traditional sectors.
Risks and Challenges Behind the Rally
Despite the optimism, the AI-driven tech stock rally is not without risks. High valuations can make stocks vulnerable to corrections if growth expectations are not met. Regulatory scrutiny around data privacy, ethical AI use, and market concentration could also impact the sector.
Additionally, the rapid pace of technological change means today’s leaders must continuously innovate to maintain their edge. Competition is intense, and disruptions can emerge quickly. Infrastructure costs, energy consumption, and talent shortages are other challenges that could influence long-term profitability.
Conclusion
The rise of artificial intelligence has fundamentally altered the outlook for the technology sector, acting as a powerful catalyst for one of the most significant tech stock rallies in recent years. AI’s ability to drive innovation, productivity, and scalable growth has reshaped investor expectations and capital allocation across global markets. While risks remain, the integration of AI into the core of business and society suggests that its influence on technology stocks is not a short-term trend but a structural transformation. As AI continues to evolve, it is likely to remain a central theme shaping the future of technology markets and investment strategies worldwide.
Eurodollar Secrets: The Hidden Power of Global Financial HavensThe Eurodollar market is one of the most influential yet least understood pillars of the modern global financial system. Despite its name, it has nothing to do with the euro currency or Europe alone. Instead, Eurodollars refer to U.S. dollars held outside the jurisdiction of the United States, typically in banks and financial institutions across offshore financial centers and global financial havens. Over decades, this vast and largely opaque system has quietly shaped global liquidity, interest rates, capital flows, and even geopolitical power. Understanding the “secrets” of the Eurodollar system means uncovering how financial havens operate behind the scenes and why they remain central to global finance.
Origins of the Eurodollar System
The Eurodollar market emerged in the aftermath of World War II. As the U.S. dollar became the world’s primary reserve currency under the Bretton Woods system, dollars began accumulating outside the United States. European banks, rebuilding their economies, accepted dollar deposits to facilitate international trade and investment. Over time, banks realized that holding dollars offshore allowed them to operate beyond U.S. banking regulations, reserve requirements, and interest rate controls. This regulatory freedom became the foundation of the Eurodollar system.
During the Cold War, the system expanded further. Some countries, including the Soviet Union, preferred to hold dollars outside the U.S. to avoid potential seizure. London soon emerged as the dominant Eurodollar hub due to its time-zone advantage, deep financial expertise, and relatively flexible regulatory environment. From there, the market spread globally, linking offshore centers with major financial capitals.
What Makes Eurodollars Different
Unlike domestic dollars held in U.S. banks, Eurodollars are created and circulated through offshore banking networks. They are not directly controlled by the U.S. Federal Reserve, yet they are denominated in U.S. dollars. This creates a paradox: the world’s most important currency is extensively used outside the reach of its issuing central bank.
Eurodollar lending operates primarily through interbank markets. Banks lend dollars to one another, often overnight or for short terms, setting benchmark rates that influence global borrowing costs. These offshore dollar markets can expand or contract independently of U.S. monetary policy, sometimes amplifying financial booms or deepening crises.
Financial Havens as the Backbone
Global financial havens play a crucial role in sustaining the Eurodollar system. These jurisdictions typically offer low or zero taxes, light regulation, legal secrecy, and flexible corporate structures. Places such as London, Singapore, Hong Kong, the Cayman Islands, Switzerland, and Luxembourg have become key nodes in the offshore dollar network.
Financial havens attract multinational corporations, hedge funds, banks, and wealthy individuals seeking efficiency, privacy, and regulatory arbitrage. By hosting dollar deposits and facilitating cross-border lending, these centers provide the infrastructure that allows Eurodollars to circulate smoothly across the globe. Their legal and regulatory frameworks are often designed to encourage financial innovation while minimizing oversight, which increases both efficiency and systemic risk.
Regulatory Arbitrage and Power
One of the most important “secrets” of the Eurodollar system is regulatory arbitrage. Banks and financial institutions can choose where to operate based on the most favorable rules. By shifting dollar activities offshore, they avoid stricter capital requirements, leverage limits, and reporting standards imposed in the U.S.
This arbitrage has significant consequences. It allows financial institutions to increase leverage and expand credit beyond what would be possible in domestic markets. While this boosts global liquidity and supports economic growth, it also creates hidden vulnerabilities. Because offshore markets are less transparent, risks can build unnoticed until they surface during crises.
Eurodollars and Global Crises
The influence of Eurodollars becomes most visible during periods of financial stress. During the global financial crisis of 2008, offshore dollar funding markets froze as trust between banks collapsed. Many non-U.S. banks that relied heavily on short-term Eurodollar funding suddenly faced severe dollar shortages. This forced the U.S. Federal Reserve to step in, providing dollar swap lines to foreign central banks to stabilize the system.
This episode revealed a critical truth: although Eurodollars exist outside U.S. jurisdiction, the Federal Reserve ultimately acts as the lender of last resort for the global dollar system. Financial havens depend on the credibility and stability of the U.S. dollar, even as they operate beyond U.S. control.
The Shadow Banking Connection
Eurodollars are closely linked to the global shadow banking system. Non-bank financial institutions, such as money market funds, investment vehicles, and structured finance entities, use offshore dollar markets to fund their activities. These entities often fall outside traditional banking regulations, yet they perform bank-like functions such as maturity transformation and credit creation.
Financial havens provide an ideal environment for shadow banking to flourish. The combination of legal flexibility and access to offshore dollars allows complex financial structures to develop rapidly. While this supports innovation and global capital mobility, it also increases interconnectedness and systemic risk.
Geopolitical Implications
The Eurodollar system has profound geopolitical implications. Countries and corporations around the world depend on access to offshore dollars to conduct trade, service debt, and manage reserves. This gives the U.S. significant indirect power, as sanctions or restrictions on dollar clearing can disrupt global financial flows.
At the same time, financial havens offer a degree of insulation from political risk. By holding dollars offshore, entities can reduce exposure to domestic instability or policy changes. This dual dynamic—dependence on the dollar combined with jurisdictional diversification—shapes global financial strategy and international relations.
The Future of Eurodollars and Financial Havens
As global finance evolves, the Eurodollar system continues to adapt. Tighter regulations after the 2008 crisis have pushed some activities further into offshore and non-bank channels. Digital finance, fintech platforms, and potential central bank digital currencies may alter how offshore dollars circulate, but they are unlikely to eliminate the demand for regulatory flexibility and global liquidity.
Financial havens are also under increasing scrutiny from international organizations seeking greater transparency and cooperation. However, as long as differences in regulation, taxation, and legal systems exist, offshore centers will remain attractive. The Eurodollar market, with its ability to operate across borders and beyond direct control, is likely to persist as a central feature of global finance.
Conclusion
The Eurodollar system and global financial havens form a hidden architecture that underpins the modern financial world. While often operating out of sight, they influence interest rates, credit availability, crisis dynamics, and geopolitical power. Their “secrets” lie not in mystery but in complexity: a decentralized, offshore network built on trust in the U.S. dollar, sustained by regulatory arbitrage, and reinforced by global financial centers. Understanding this system is essential for grasping how global finance truly works—and why events in distant financial havens can have profound effects on economies everywhere.

The Global Showdown of the Banking SystemFoundations of the Global Banking System
At its core, the global banking system connects central banks, commercial banks, investment banks, and financial institutions across borders. Central banks regulate money supply, interest rates, and financial stability, while commercial banks handle deposits, loans, and payment services. For decades, this system was dominated by trust in institutions, fiat currencies, and centralized control. However, repeated financial crises have exposed its vulnerabilities, forcing governments and regulators to constantly adapt.
Legacy of Financial Crises
The 2008 global financial crisis marked a turning point. Bank failures, liquidity shortages, and government bailouts shattered public confidence. Although regulatory frameworks such as Basel III were introduced to strengthen capital adequacy and risk management, the scars of the crisis remain visible. More recently, pandemic-driven economic shutdowns and rapid interest rate hikes reignited stress within banking systems, highlighting how fragile global financial interconnectedness can be.
Each crisis adds pressure to banks to balance profitability with stability. Excessive risk-taking threatens systemic collapse, while overregulation limits growth and innovation. This tension defines much of the current global banking showdown.
Interest Rates and Monetary Policy Conflicts
Central banks play a crucial role in shaping banking stability. Over the past decade, ultra-low interest rates supported economic growth but compressed bank margins. When inflation surged globally, central banks were forced into aggressive rate hikes. This sudden shift created valuation losses on bonds, liquidity mismatches, and credit stress.
Different regions face different challenges. Developed economies struggle with aging populations and high debt, while emerging markets face currency volatility and capital outflows. As central banks pursue domestic priorities, their policies often clash on the global stage, intensifying financial volatility and exposing weaknesses in cross-border banking operations.
Geopolitics and Fragmentation
Geopolitical tensions have become a defining factor in the global banking showdown. Sanctions, trade conflicts, and regional wars directly affect banking flows, reserve currencies, and payment systems. The use of financial infrastructure as a geopolitical weapon has accelerated efforts toward de-dollarization and alternative settlement systems.
Countries are increasingly prioritizing financial sovereignty, leading to fragmentation of the global banking network. While this reduces dependency on dominant systems, it also increases inefficiencies, compliance costs, and systemic risks. Banks must now navigate political risk alongside credit and market risk.
Technology vs. Traditional Banking
One of the most disruptive forces in the global banking showdown is technology. Fintech companies, digital wallets, and decentralized finance platforms challenge traditional banks by offering faster, cheaper, and more accessible services. Blockchain technology questions the very need for centralized intermediaries, while digital currencies redefine money itself.
Banks are responding by investing heavily in digital transformation, automation, and artificial intelligence. However, legacy systems, cybersecurity risks, and regulatory uncertainty slow progress. The battle is not just about innovation, but about who controls data, trust, and financial infrastructure in the digital age.
Rise of Central Bank Digital Currencies
Central Bank Digital Currencies (CBDCs) represent a critical front in this showdown. Governments see CBDCs as tools to improve payment efficiency, enhance financial inclusion, and maintain control over monetary policy. At the same time, CBDCs raise concerns about privacy, surveillance, and the role of commercial banks.
If widely adopted, CBDCs could disrupt traditional deposit models, forcing banks to rethink funding structures and lending strategies. The balance between innovation and stability will determine whether CBDCs strengthen or destabilize the banking ecosystem.
Regulation and Compliance Pressure
Regulatory scrutiny has intensified worldwide. Banks face stricter capital requirements, stress testing, anti-money laundering rules, and environmental, social, and governance (ESG) obligations. While regulation aims to protect consumers and maintain stability, it also increases operational costs and reduces flexibility.
Smaller banks struggle to compete, leading to consolidation across the industry. Larger institutions gain scale but also become “too big to fail,” perpetuating moral hazard. Regulators must walk a fine line between preventing systemic risk and stifling competition.
Consumer Trust and Changing Behavior
Public trust is a critical yet fragile component of the banking system. Scandals, data breaches, and perceived inequality in financial access erode confidence. At the same time, consumers demand seamless digital experiences, transparency, and ethical practices.
Younger generations are less loyal to traditional banks and more open to alternative financial platforms. This shift forces banks to rethink customer engagement, product design, and brand credibility. Trust, once assumed, must now be continuously earned.
The Future Balance of Power
The global showdown of the banking system is ultimately about balance—between stability and innovation, control and freedom, globalization and sovereignty. Banks that adapt to technological change, manage risk prudently, and align with evolving regulatory and social expectations will survive. Those that resist change may fade into irrelevance.
The future banking landscape is likely to be more diversified, digitally driven, and regionally fragmented. Collaboration between banks, regulators, and technology providers will be essential to prevent systemic shocks. The outcome of this showdown will shape global economic growth, financial inclusion, and the very nature of money in the decades to come.
In conclusion, the global banking system stands at a crossroads. Pressured by crises, challenged by innovation, and reshaped by geopolitics, it faces a defining moment. The decisions made today will determine whether the system emerges more resilient and inclusive—or more divided and fragile.

BRICS Thriving: The Rise of a New Multipolar Economic PowerThe Foundations of BRICS Growth
The strength of BRICS lies in its diversity combined with shared strategic interests. These nations span multiple continents, cultures, political systems, and economic models, yet they are united by a common objective: increasing their influence in global decision-making. Together, BRICS countries account for a significant share of the world’s population, global GDP (in purchasing power parity terms), natural resources, and industrial capacity. This demographic and economic scale gives the group a strong foundation that few alliances can rival.
Another key factor behind BRICS thriving is the complementary nature of its economies. China serves as a global manufacturing hub and technology powerhouse, India contributes a rapidly expanding services sector and demographic advantage, Russia offers energy and strategic resources, Brazil strengthens the bloc with agricultural and commodity exports, and South Africa acts as a gateway to the African continent. This economic complementarity allows BRICS to enhance intra-bloc trade and reduce dependence on traditional Western markets.
Expansion and Global Appeal
One of the most significant indicators of BRICS thriving is its expansion. The growing interest of other emerging and developing nations in joining BRICS reflects dissatisfaction with existing global institutions and a desire for alternative platforms. Expansion signals credibility: countries see BRICS as a viable counterbalance to established power structures such as the G7 and Bretton Woods institutions.
This expansion also strengthens the bloc’s geopolitical reach. By including nations from the Middle East, Africa, and Asia, BRICS enhances its influence over global energy markets, trade routes, and regional diplomacy. A larger BRICS means broader representation of the Global South, giving voice to economies that have long felt marginalized in international forums.
Financial Independence and De-dollarization
A crucial reason BRICS is thriving lies in its efforts to reshape global finance. For decades, the global financial system has been heavily centered around the US dollar, exposing emerging economies to currency volatility, sanctions risk, and external shocks. BRICS has increasingly focused on reducing this dependence by promoting local currency trade, strengthening financial cooperation, and building alternative payment systems.
The establishment and growing role of the New Development Bank (NDB) symbolize this shift. Unlike traditional development banks, the NDB prioritizes infrastructure and sustainable development projects in emerging economies without imposing rigid policy conditions. This approach resonates strongly with developing nations seeking growth without external political pressure.
Local currency settlements among BRICS members are also gaining momentum. This trend enhances financial sovereignty, lowers transaction costs, and shields economies from external monetary tightening cycles. While the dollar remains dominant, BRICS initiatives signal a gradual, structural diversification of the global monetary system.
Trade, Supply Chains, and Economic Resilience
Global supply chains have faced unprecedented stress due to pandemics, geopolitical conflicts, and protectionist policies. In this environment, BRICS countries are actively strengthening trade cooperation and supply chain resilience. Intra-BRICS trade has grown steadily, supported by bilateral agreements, logistics investments, and regional trade corridors.
BRICS nations are also leveraging industrial policy to boost domestic manufacturing and technological capabilities. India’s focus on production-linked incentives, China’s advances in high-end manufacturing and green technology, Brazil’s agribusiness strength, and Russia’s energy infrastructure collectively enhance the bloc’s resilience against global disruptions.
By prioritizing South-South cooperation, BRICS reduces overreliance on traditional export destinations. This strategy not only stabilizes growth but also empowers member countries to move up the value chain rather than remaining raw material exporters.
Technology, Innovation, and Digital Power
BRICS thriving is not limited to traditional sectors; it is increasingly evident in technology and innovation. China and India, in particular, are driving digital transformation across fintech, artificial intelligence, telecommunications, and space technology. Collaborative efforts in research, digital infrastructure, and innovation ecosystems are positioning BRICS as a serious competitor in the global technology race.
Digital public infrastructure, cross-border payment technologies, and e-commerce integration are opening new avenues for economic cooperation. These developments allow BRICS nations to leapfrog older systems and adopt next-generation solutions tailored to their unique development needs.
Political Influence and Global Governance Reform
Beyond economics, BRICS is thriving as a political force advocating for reform in global governance institutions. Member nations consistently call for more inclusive representation in international bodies such as the United Nations, International Monetary Fund, and World Bank. This push resonates with many developing countries that feel underrepresented despite their growing economic weight.
BRICS provides a platform for diplomatic coordination on global issues ranging from climate change and energy security to development financing and peace initiatives. While internal differences exist, the bloc’s ability to maintain dialogue and cooperation enhances its credibility as a stabilizing force in a fragmented world.
Challenges and the Road Ahead
Despite its success, BRICS faces challenges. Economic disparities among members, geopolitical tensions, and differing national priorities can complicate consensus-building. Managing expansion without diluting effectiveness will also test the bloc’s institutional strength. However, the very ability of BRICS to function despite these differences highlights its maturity and adaptability.
The future of BRICS will depend on how effectively it translates ambition into concrete outcomes—stronger institutions, deeper trade integration, technological collaboration, and sustainable development. If these goals are achieved, BRICS could redefine global power dynamics for decades to come.
Conclusion
BRICS thriving is a reflection of a changing world order. It represents the collective aspiration of emerging economies to shape their own destinies and participate more fairly in global decision-making. Through economic cooperation, financial innovation, political coordination, and expansion, BRICS has moved beyond a symbolic grouping to become a meaningful force in global affairs. As the world transitions toward multipolarity, BRICS stands not just as a challenger to existing systems, but as a builder of new pathways for growth, stability, and shared prosperity.

NiftyImportant support based on 4hr time frame is 26000 and reistance 26050.If break and sustain above for 15 minutes we may see 26150 to 26200.

Stop Hunt or True Breakout?If you've ever entered a trade in the right direction but still got your SL swept right before price rocketed… congratulations — you've witnessed one of gold’s most sophisticated market maneuvers: the Stop Hunt.
The problem isn’t that the market is unfair.
The real issue is: we can’t tell when price is hunting liquidity and when it’s genuinely breaking out.
1. Stop Hunt — A calculated trap
On XAUUSD, stop hunts usually happen around levels that almost every trader draws the same way: short-term highs/lows, obvious support/resistance, or tight consolidation zones.
Typical behavior:
Price spikes through the level fast and aggressively, but shows no follow-through (no candle closes confirming outside the zone). After sweeping stops, price reverses cleanly — as if the breakout never happened.
The objective? Grab liquidity from clustered SL orders sitting above/below key levels before the big players push price in the real direction.
2. True Breakout — The real declaration of control
A real breakout doesn’t need to look dramatic.
It’s not one lightning-strike candle spearing through a level — it’s a sequence of price action proving that buyers or sellers have fully taken over.
How to identify it:
Price breaks the level, then:
A candle clearly closes outside the level
A retest respects the level without slipping back into the old range
Market structure continues in the new trend (HH-HL for bullish, LH-LL for bearish)
At this point, the breakout is no longer a “test” — it’s a true shift in capital flow.
3. The 5-second rule to spot the difference
Breaks level but closes back inside the old zone → Stop Hunt
Breaks level, closes outside, retest holds → True Breakout
No indicator needed. No complex patterns.
Just answer this: Did price hold its ground after the break?
If no → liquidity got hunted.
If yes → a new trend is born.
4. Survival tactics when trading gold
Don’t place SL right above obvious highs or below clear lows
Wait for a confirming candle close before entering
A retest that respects the level is the safest entry
Breakouts with no retest are often fakeouts
Gold is a market driven by liquidity first, technique second.
Those who understand this don’t just avoid getting stopped out — they trade alongside the real institutional flow.

ENA/USDT at a Critical Demand Zone – Bounce or Breakdown Ahead?ENA/USDT is currently in a strong bearish phase on the 3D timeframe. After failing to hold the distribution area above 0.80, price experienced a sharp and sustained decline, returning to a highly significant historical demand zone. The yellow zone at 0.212 – 0.190 is a critical area that will determine the next major move.
---
Market Structure & Price Action
Overall structure remains Lower High – Lower Low (bearish trend)
Strong breakdown from the 0.40 → 0.28 area confirms bearish continuation
Price is now testing a major multi-month demand zone
Market reaction here will define whether we see a technical rebound or further breakdown
---
Pattern Explanation
1. Descending Market Structure (Bearish Continuation)
Price has formed consistent lower highs since the 0.80 peak, showing dominant selling pressure.
2. Strong Demand Retest The 0.212 – 0.190 zone represents:
Previous accumulation area
Historical strong bounce level
Last major demand before potential deeper price discovery
3. Potential Dead Cat Bounce (if volume remains weak) A weak bounce without strong volume may only be a temporary pullback before continuation lower.
---
Key Levels
Support (Demand Zone):
0.212 – 0.190 (major demand / yellow zone)
Resistance (Supply Levels):
0.245
0.285
0.400
0.500
0.615
0.805
---
Bullish Scenario
The bullish scenario is valid only if price reacts strongly from the demand zone.
Conditions:
Price holds above 0.190
Clear rejection or bullish candle formation
Ideally supported by increasing volume
Potential upside targets:
0.245 (minor resistance)
0.285
0.400 (major resistance)
0.500 (extension target if momentum builds)
Note:
This bullish move would be considered a technical rebound, not a full trend reversal unless a higher-low structure is established.
---
Bearish Scenario
This scenario activates if the demand zone fails.
Conditions:
Daily / 3D candle close below 0.190
Lack of meaningful buying reaction
Downside risk:
Demand breakdown → bearish continuation
Potential capitulation phase
Lower prices become likely due to the absence of strong historical support below
---
Conclusion
ENA/USDT is currently at a critical decision zone.
A strong reaction from 0.212 – 0.190 could trigger a technical rebound
A confirmed breakdown would reinforce the broader bearish trend with deeper downside risk
Patience and confirmation are key due to elevated risk conditions.
---
#ENAUSDT #ENA #CryptoAnalysis #TechnicalAnalysis
#Altcoin #Binance #Downtrend #DemandZone
#SupportResistance #PriceAction

RIVN- UpdateRIVN- Update
.
Plan has run and pull pack as expected.
New buying pull back entry.
US STOCKS- WALL STREET DREAM- LET'S THE MARKET SPEAK!

CFX/USDT At Major Support — Last Line Before a Deeper Drop?CFX/USDT on the Daily (1D) timeframe is still trading within a medium-term bearish trend, characterized by a clear sequence of lower highs and lower lows since the peak around the 0.27–0.28 area.
Price has now declined back into a historically strong demand zone at 0.072 – 0.063, which previously acted as an accumulation base before a strong bullish impulse.
This area represents a critical decision zone for the next major move.
---
Pattern & Technical Structure
1. Descending Trendline (Bearish Control)
A well-defined descending trendline connects the major swing highs since August.
Each touch of this trendline resulted in strong rejection, confirming persistent seller dominance.
2. Descending Channel / Bearish Continuation
Price structure forms a descending channel, reflecting gradual distribution.
Current price action is located near the lower boundary of the channel, close to key support.
3. Strong Horizontal Demand Zone
The yellow zone at 0.072 – 0.063 represents:
A strong historical reaction area
Previous rebound levels
A psychological deep discount zone
This zone has the potential to act as a base for reversal if buyers step in aggressively.
---
Key Levels
Support
Major Support (Key Demand): 0.072 – 0.063
Critical Breakdown Level: 0.059
Resistance
Minor Resistance: 0.085
Mid Resistance: 0.104
Major Resistance: 0.125
Upper Resistance / Distribution Zone: 0.165 – 0.185
Macro Resistance: 0.230
---
Bullish Scenario
Bullish conditions require:
Price holding above 0.072
Formation of a base / consolidation
Appearance of a bullish daily close (pin bar, engulfing, or strong bullish body)
Potential bullish move:
1. Rebound from the 0.072–0.063 demand zone
2. Break above minor resistance at 0.085
3. Upside targets:
0.104
0.125
Strong momentum continuation → 0.165 – 0.185
Bullish Conclusion:
This area offers a high-risk, high-reward accumulation opportunity for swing traders, as long as the key support remains intact.
---
Bearish Scenario
Bearish confirmation occurs if:
A strong daily close below 0.063
Breakdown accompanied by increasing volume
Failure to reclaim the 0.072 level
Potential bearish continuation:
Further downside toward:
0.059
Possible deeper liquidity zones if panic selling occurs
Note: A breakdown of this zone confirms that the bearish continuation phase remains active.
---
Conclusion
CFX/USDT is currently trading at a major decision zone.
Bounce from 0.072 – 0.063 → potential relief rally or trend reversal
Breakdown below this area → confirmation of bearish continuation
Market is at a critical turning point.
Strict risk management is essential in this region.
---
#CFX #CFXUSDT #CryptoAnalysis #Altcoin #DailyChart #DescendingTrend #SupportResistance #DemandZone #BearishTrend #PotentialReversal
