WTI OIL on its 1D MA50 again. Sell signal.Last week (December 17, see chart below) we gave a strong Buy Signal on WTI Crude Oil (USOIL) after it hit and rebounded on the 8-month Support.
The resulting rally easily hit our $58.50 Target and today the price tests the 1D MA50 (blue trend-line) for the first time since the previous Lower High of the 5-month Channel Down. This is an automatic technical Sell Signal as at the same time the 1D RSI is reversing near its 4-month Resistance Zone.
Our short-term Target is again the $55.20 Support.
---
** Please LIKE 👍, FOLLOW ✅, SHARE 🙌 and COMMENT ✍ if you enjoy this idea! Also share your ideas and charts in the comments section below! This is best way to keep it relevant, support us, keep the content here free and allow the idea to reach as many people as possible. **
---
💸💸💸💸💸💸
👇 👇 👇 👇 👇 👇
Harmonic Patterns

26/12/2025 $BTC - $DXY -$SPX - $NDX - $GOLD forecastPositive energy across all indexes except CRYPTOCAP:BTC which will see a negative inflexion starting 9:00 am utc to fully develop after the post 12:00 utc session

26 Dec 2025 — BTR Report- No Trading Day📌 BTR Indicator did NOT generate any signal today in BSE LTD.
➡️ That means Today is a NO Trading Day.
➡️ No Signal = No Trade.
➡️ No Trade = No Loss.
This is exactly how professional trading discipline looks.
We don’t chase trades.
We don’t force entries.
We simply follow the system.
🔑 Key Reminder
The strength of BTR is clarity.
Some days we book profits.
Some days we protect capital by doing nothing.
In trading, doing nothing is also a trade — the right one.
🚫 No Emotion • No FOMO • Only Rules
BTR Indicator is designed for:
✔ Intraday Traders
✔ Options Traders
✔ Rule-Based Discipline
❌ No Noise
❌ No Overtrading
📍Where to Find BTR
👉 Open my TradingView Profile → Scripts
👉 Add BTR Indicator to your charts
👉 Trade with confidence, not guesses
Follow BTR.
Follow Discipline.
Trade Smart. 📈
NSE:BSE

EthereumETHUSD
- Bearish Channel as an corrective pattern in Long Time Frame
- RSI - Divergence
- Break of Structure
- Symmetrical Triangle in Short Time Frame
- Change of Characteristics

Nifty Harmonic Bull Cycle: Channel Breakout Targets Ahead✅ 1. Price Structure & Trend Channel Analysis
Long-Term Rising Channel
Nifty continues to respect the multi-month rising channel.
Current price trades near the midline of that channel — typically a zone where continuation moves often launch toward the upper boundary (your TG2/TG3 zone).
Second Phase Bull Formation
Your harmonic sequence (X-A-B-C-D) shows a completed retracement and re-entry into bullish swing.
The upward symmetry of Phase 1 and Phase 2 suggests a mirrored target projection — exactly where TG2 & TG3 sit.
Critical Trend Line
The diagonal corrective trend line is being tested repeatedly.
As long as candles do not close below this, bullish continuation probability remains strong.
📈 2. Indicator-Based Probabilities (Derived From Price Behavior)
A. Momentum Structure
After the recent retracement, the bullish impulse candles remain larger than the bearish pullback candles → continuation bias.
B. Volume & Volatility Behavior
Pullback volume looks weaker while bullish legs show expansion → accumulation phase still active.
C. Multi-Timeframe Confluence
H4 + Daily both align with higher-high, higher-low swing construction.
Daily close above 25,950–26,020 zone will trigger a momentum breakout.
🎯 3. Target Timing Projection (Your Requested Part)
Based purely on the chart price action:
⏳ Reaching TG2 – 26325
High probability within the current month, due to:
Compression against trendline → breakout behavior typical
Strong harmonic leg projection
No major resistance until 26,300 zone
December seasonality historically favors bullish continuation
Probability: ~70–75% based on price structure alone
⏳ Reaching TG3 – 26474
Most likely around mid-next month, because:
TG3 lies near the upper channel boundary
Markets often consolidate after reaching TG2
Break to TG3 usually needs:
Follow-through buying
A fresh momentum push (often seen early next month)
Probability: ~60% based on extension leg geometry
📌 4. Key Levels to Watch
Immediate Supports
25,780 / 25,650 (trendline retest)
25,400 (swing invalidation level)
Breakout Confirmation
Daily candle close above 26,020
Upside Targets
TG1 – 26089 → Done/Very near
TG2 – 26325 → Likely this month
TG3 – 26474 → Likely mid-next month
📝 5. Summary
Structure remains strongly bullish inside a rising channel.
Harmonic pattern suggests another upward impulse is pending.
TG2 this month: High chance
TG3 mid-next month: Moderate-High chance
As long as Nifty holds above the critical diagonal trendline, the bullish roadmap remains intact.
⚠️ Disclaimer
I am not a SEBI-registered analyst. This study is for educational purposes only. The chart analysis is my own perspective; ChatGPT only helped refine the wording and format. Please do your own analysis before trading.

SiLVER: $75| Building a Short Positiona Billionaire once said that
when you see something parabolic
coupled with coordinated news releases
in major networks
thats the time to BOOK YOUR GAiNS on the way up
or eyeball the mylti year channel to Size in Your SHORTS
for Contrarian Speculators only
as when you see it on Social Media and Prints
you are probable late to the PARTY
Risk OFF Silver time to upsize on BiTCOiN

HUDCO Swing Trade Setup📊 Price Action & Trend Analysis
Analyzing market trends using price action, key support/resistance levels, and candlestick patterns to identify high-probability trade setups.
Always follow the trend and manage risk wisely!
Price Action Analysis Interprets Market Movements Using Patterns And Trends On Price Charts.
👉👉👉Follow us for Live Market Views/Trades/Analysis/News Updates.

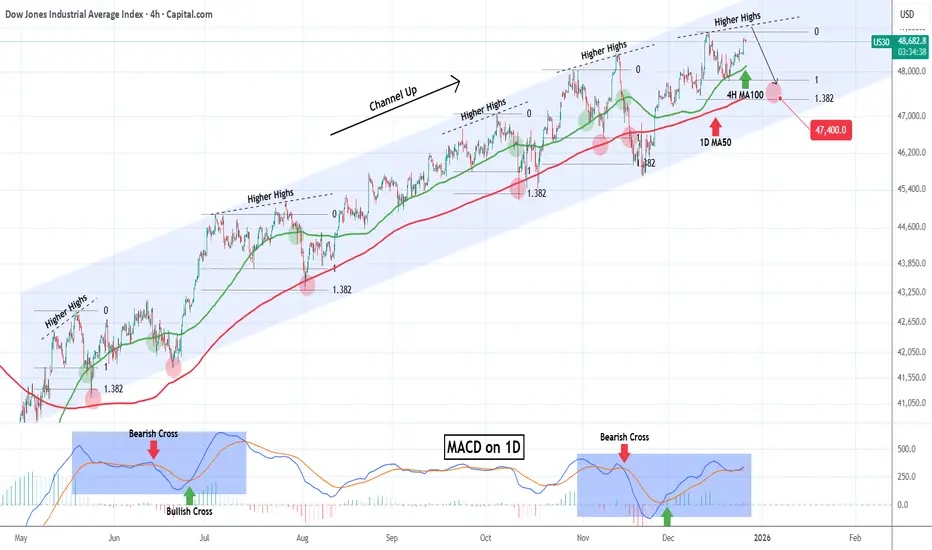
DOW JONES headed towards a rejection.Dow Jones (DJI) has been trading within a nearly 8-month Channel Up and is close to its All Time High (ATH) after rebounding last week on its 4H MA100 (green trend-line).
This pattern is cyclical and every time the latter support broke after a medium-term rally from its 1D MA50 (blue trend-line), the index got rejected on a Higher Highs trend-line and corrected back to the 1D MA50. Even the 1D MACD is printing a sequence similar to June - July.
As a result, we expect the new year to find Dow on its 1.382 Fibonacci extension at 47400 at least, which is the Fib level that every such correction pulled back to.
---
** Please LIKE 👍, FOLLOW ✅, SHARE 🙌 and COMMENT ✍ if you enjoy this idea! Also share your ideas and charts in the comments section below! This is best way to keep it relevant, support us, keep the content here free and allow the idea to reach as many people as possible. **
---
💸💸💸💸💸💸
👇 👇 👇 👇 👇 👇
Gold Trade Plan 24/12/2025Dear Traders,
XAUUSD (Gold) Technical Analysis – 30-Minute Timeframe
📅 December 24, 2025
Market Structure
The short-term trend is bullish.
Price is moving inside a well-defined ascending channel (blue lines).
A rising trendline (black) is acting as a dynamic support.
Key Levels
Major Support Zone:
Highlighted blue box around 4450 – 4460
This zone represents:
Lower boundary of the ascending channel
Strong horizontal support
Previous reaction area
Resistance Levels:
Minor resistance: 4500 – 4510
Major resistance: 4550 – 4560 (upper boundary of the channel)
Possible Scenarios
🔹 Bullish Scenario (Primary Scenario)
Price pulls back toward the 4450–4460 support zone
Support holds and a bullish reversal candle forms (Pin bar / Engulfing)
Price resumes upward movement toward:
Target 1: 4510
Target 2: 4550 – 4560 (channel high)
📌 This scenario aligns with the overall bullish market structure and has a higher probability.
🔹 Deeper Correction Scenario (Less Likely)
A strong breakdown below 4460 with candle close
Price exits the ascending channel
Further downside correction (not confirmed yet)
Trading Summary
Market Bias: Buy on dips
Best opportunities:
Long entries near channel support
Short positions only if:
Support breaks clearly, or
Strong rejection appears at channel resistance with confirmation
Regards,
Alireza!

GOLD - The market may update its ATH after a correction...FX:XAUUSD bounces off 4475 and updates its local maximum in the distribution phase to 4519.4. Against the backdrop of low liquidity associated with the end of the calendar year, movements may be sharp and unpredictable...
The fundamental background remains unchanged, supporting gold: a weak dollar, tense geopolitical situation, mixed data from the US. However, the main problem at the moment is low liquidity due to the holidays.
The Asian market bought up the supply and drove up the price. After such a strong movement, the market may enter a consolidation or correction phase, during which it may test 4508-4500 before rising.
Resistance levels: 4519, 4526, 4550
Support levels: 4508, 4500
A low-liquidity market is easier to manage (in terms of manipulation). Accordingly, use strong setups and short targets for trading, as movements can be sharp and unpredictable.
I expect the bull market to continue after the correction.
Best regards, R. Linda!

Solana Analysis | Strong Demand Zone and 145% Long‑Term UpsideSolana remains one of the most closely watched cryptocurrencies by market participants. Price has reacted multiple times from the
111
–
111–
117 support zone, as well as the $95 swing low, confirming strong buying interest in this area.
Based on the long‑term structure, a potential move toward $270 is projected, representing approximately 145% upside from current levels.

Gold Trade Plan 26/12/2025Dear Traders,
The price is still moving upward toward higher highs.
At the moment, price is interacting with a weak resistance around 4520.
I expect that after breaking this level, the price will move toward 4600.
Regards,
Alireza!

BTCUSD Below a Downtrend Line: Don’t Rush to Trust the BounceBTCUSD is still trading in a bearish-leaning environment , as neither the news backdrop nor the technical structure supports a clear bullish reversal yet. Profit-taking from large players, combined with cautious year-end sentiment, means recent Bitcoin rebounds are more technical in nature rather than the start of a new uptrend. In a thin-liquidity environment, the market tends to favor selling rallies instead of chasing higher prices.
On the chart, price remains below the descending trendline and capped by the Ichimoku cloud, confirming that sellers continue to control the primary trend. Upside attempts have been shallow and quickly sold into, reflecting a lack of conviction from buyers. The 89,500 area stands out as a key resistance zone, where price has tested multiple times without a decisive breakout.
In the short term, the most reasonable scenario is for BTC to rebound into resistance and then weaken, before revisiting support around 86,800. A clean break below this level could open the door for further downside extension. Conversely, only a strong breakout and sustained hold above 89,500–90,000 would truly invalidate the current bearish structure.

XAUUSD-Continue to be bullishGold continues its strong bullish momentum today, refresh the all-time high around $4531
The upward trend is intact, and dips are opportunities to go long.
#XAUUSD
Focus remains on 4490 going forward
This former morning resistance has flipped into strong support via top-bottom conversion.
Bullish outlook unchanged around this level.
#GOLD
Resistance: 4525-4530 / 4550
Secondary support: 4470
If Asian/European sessions hold steady without deep retracements, aggressively add to longs for the next leg up—stick firmly to the bullish rhythm!

XAUUSD-Guaranteed Profit StrategyIf the price holds above the 4500-4495 support zone, it will likely continue its upward trend towards 4530-4533, followed by 4550-4555.
#XAUUSD
If it falls back to the 4500-4470 zone, the next support level will be around 4470-4465, with a further target of the 4455-4457 level, the four-hour moving average.
#GOLD
Based on this, we expect gold prices to continue rising, with further upside targets at 4530-4535, followed by 4550-4555.

GPB/USD M30 I 12/26Observation Tips:
Monitor the price reaction when it touches the bottom blue band (VAL zone).
Keep an eye on the descending trendline; bullish sentiment will only truly return if the price breaks above this line and climbs back over the POC.

CADJPY→ Trade Analysis | BUY SetupCADJPY is moving in an UP trend channel.
The chart broke through the dynamic Resistance line, which now acts as support.
We expect a decline in the channel after testing the current level which suggests that the price will continue to rise
Hello Traders, here is the full analysis.
I think we can soon see more fall from this range! GOOD LUCK! Great BUY opportunity CADJPY
I still did my best and this is the most likely count for me at the moment.
-------------------
Traders, if you liked this idea or if you have your own opinion about it, write in the comments. I will be glad 🤝

XAUUSD TP 5146On the weekly chart, XAUUSD continues to rise, showing a clear bullish trend. Currently, the AB=CD pattern is worth watching, with a target of $5146.

EURUSD POSSIBLE BUY SETUP 📌 Trade Plan (EUR/USD – Long Setup)
🟢 Entry Reason
Market structure remains bullish with multiple BOS at the highs.
Price pulled back and respected a demand zone after a CHoCH, indicating buyers defending structure.
Current consolidation suggests re-accumulation before continuation.
🟢 Entry
Buy on confirmation inside the 1.1770–1.1760 demand zone.
Conservative entry after bullish reaction / rejection from this zone.
🛑 Stop Loss (SL)
Below demand and structure low:
1.1755–1.1760
🎯 Take Profit (TP)
Target prior highs and external liquidity:
1.1805–1.1820
(Aligned with the upper liquidity zone and projected move)
📈 Why This Trade Makes Sense
Higher-timeframe bullish bias intact.
Pullback into discount + demand
Expecting continuation toward buy-side liquidity above highs.

Investing in Future TechnologyBuilding Wealth in the Age of Innovation
Investing in future technology is one of the most powerful ways to participate in long-term economic growth. As the world moves rapidly toward digitalization, automation, and sustainability, technology-driven sectors are reshaping industries, consumer behavior, and global markets. From artificial intelligence and biotechnology to renewable energy and space exploration, future technologies offer investors the potential for high growth, diversification, and strategic positioning for the decades ahead.
Understanding Future Technology Investing
Future technology investing focuses on identifying innovations that are still in their early or growth stages but have the potential to disrupt existing systems or create entirely new markets. Unlike traditional investments that rely heavily on stable cash flows and established demand, future tech investments often emphasize scalability, intellectual property, data advantage, and network effects. This type of investing requires a forward-looking mindset, patience, and the ability to tolerate volatility.
Technological revolutions tend to follow exponential adoption curves. Early investors in the internet, smartphones, cloud computing, and e-commerce benefited significantly once these technologies became mainstream. Future tech investing seeks to identify the next wave before it becomes obvious to the broader market.
Key Future Technology Sectors
One of the most important areas is Artificial Intelligence (AI) and Machine Learning. AI is no longer limited to research labs; it is embedded in finance, healthcare, manufacturing, education, and defense. Companies developing large language models, autonomous systems, predictive analytics, and AI chips are shaping the next productivity revolution. AI improves efficiency, reduces costs, and enables entirely new business models, making it a core long-term investment theme.
Robotics and Automation represent another major frontier. As labor shortages rise and manufacturing becomes more complex, automation is becoming essential. Industrial robots, warehouse automation, autonomous vehicles, and drones are transforming logistics, production, and transportation. Robotics also plays a key role in healthcare, agriculture, and disaster management.
Biotechnology and HealthTech are redefining how diseases are diagnosed and treated. Innovations such as gene editing, personalized medicine, mRNA therapies, AI-driven drug discovery, and wearable health devices are expanding both lifespan and quality of life. Aging populations and rising healthcare demand make this sector structurally strong for long-term investors.
Renewable Energy and Clean Technology are critical to the global transition toward sustainability. Solar, wind, hydrogen, battery storage, electric vehicles, and smart grids are gaining momentum as governments and corporations commit to net-zero targets. Clean tech investments are supported not only by innovation but also by regulation, subsidies, and changing consumer preferences.
Blockchain, Web3, and Digital Infrastructure are reshaping finance and data ownership. Beyond cryptocurrencies, blockchain technology supports decentralized finance (DeFi), smart contracts, digital identity, and supply chain transparency. As trust, security, and efficiency become more important in digital transactions, blockchain-based solutions are likely to see wider adoption.
Space Technology is emerging as a new investment frontier. Satellite communication, earth observation, space tourism, and defense applications are creating a commercial space economy. Declining launch costs and private sector participation are making space more accessible, opening opportunities that were once limited to governments.
Why Future Tech Matters for Investors
Future technology investments offer high growth potential. Disruptive technologies often capture large market share quickly once adoption accelerates. They also provide portfolio diversification, as tech-driven growth can be less dependent on traditional economic cycles.
Another key benefit is inflation resilience. Many technology companies rely on intellectual capital rather than physical assets, allowing them to scale efficiently and maintain pricing power. Additionally, future tech investments align well with global megatrends such as digital transformation, urbanization, climate change mitigation, and demographic shifts.
Risks and Challenges
Despite their potential, future tech investments come with significant risks. High valuations, uncertain profitability, rapid technological obsolescence, and regulatory changes can impact returns. Many early-stage companies may fail before achieving commercial success.
Volatility is another challenge. Technology stocks often react sharply to interest rate changes, policy decisions, or earnings expectations. Investors must be prepared for periods of underperformance and avoid short-term speculation.
Investment Strategies for Future Technology
A long-term approach is essential. Investors should focus on businesses with strong research capabilities, visionary leadership, and scalable platforms rather than short-term hype. Diversification across multiple tech themes reduces the risk of betting on a single innovation.
Investors can access future tech through equities, exchange-traded funds (ETFs), venture capital funds, or thematic mutual funds. For retail investors, ETFs focused on AI, robotics, clean energy, or biotech provide broad exposure with lower risk.
Another effective strategy is staggered investing, where capital is deployed gradually over time. This helps manage volatility and reduces the impact of market timing errors. Fundamental analysis, combined with an understanding of technological trends, is crucial for selecting quality investments.
The Role of Policy and Regulation
Government policies play a major role in shaping future technology investments. Supportive regulations, research funding, tax incentives, and infrastructure development can accelerate adoption. Conversely, strict regulations around data privacy, AI ethics, or environmental compliance can slow growth in certain sectors.
Investors should closely monitor global policy trends, especially in major economies, as regulatory clarity often determines which technologies scale successfully.
Conclusion
Investing in future technology is not just about chasing innovation; it is about positioning capital for the next phase of global economic growth. While risks are inevitable, disciplined investing, diversification, and a long-term vision can help investors benefit from transformative technologies that redefine industries and societies.
As the pace of innovation accelerates, future tech investing will increasingly separate passive market participants from forward-thinking investors. Those who understand the trends, manage risks wisely, and remain patient are more likely to build sustainable wealth in the age of technological transformation.

Top 10 Sentiment Tools in the Global Trading Market1. AAII Sentiment Survey (American Association of Individual Investors)
The AAII Sentiment Survey is a weekly survey that gauges the mood of retail investors in the U.S. stock market. It measures the percentage of investors who are bullish, bearish, or neutral on the stock market over the next six months.
Key Features:
Provides a clear snapshot of retail investor sentiment.
Historical data allows identification of contrarian signals; extremely high bullishness often signals market tops, while extreme bearishness signals market bottoms.
Useful for equity traders and portfolio managers to understand retail behavior versus institutional activity.
Applications in Trading:
Contrarian strategy: Using extremes in sentiment to anticipate reversals.
Risk management: Gauging potential overbought or oversold conditions in retail trading.
2. CBOE Volatility Index (VIX)
Known as the "fear gauge," the VIX measures expected volatility in the S&P 500 over the next 30 days. It is derived from options prices and reflects market expectations for short-term risk.
Key Features:
Real-time indicator of investor fear or complacency.
High VIX readings indicate high uncertainty and potential market corrections.
Low VIX readings suggest market stability and bullish sentiment.
Applications in Trading:
Hedging: Traders often use VIX futures or options to protect portfolios.
Sentiment-based trading: Extreme VIX readings can indicate potential reversal opportunities.
3. Fear & Greed Index (CNN Money)
The Fear & Greed Index aggregates multiple market indicators, including stock price momentum, market volatility, and bond demand, to quantify investor emotion on a scale from 0 (extreme fear) to 100 (extreme greed).
Key Features:
Provides a simple, visual representation of market sentiment.
Combines market volatility, momentum, safe-haven demand, and stock performance indicators.
Updates daily, allowing traders to respond to shifting investor psychology quickly.
Applications in Trading:
Contrarian trading: Extreme greed levels may indicate market tops, while extreme fear can signal buying opportunities.
Risk monitoring: Helps traders avoid entering overextended markets.
4. Trade The News / News Sentiment Tools
Platforms such as RavenPack, Benzinga, and MarketPsych analyze news headlines, financial reports, and social media to gauge market sentiment in real time. They use natural language processing (NLP) to classify news as positive, negative, or neutral.
Key Features:
Real-time sentiment scoring based on news flow.
Quantifies market reactions to geopolitical events, corporate announcements, and macroeconomic reports.
Can process vast volumes of data faster than manual research.
Applications in Trading:
High-frequency trading: News sentiment can trigger automated trades.
Event-driven strategies: Traders can react quickly to unexpected news, earnings releases, or central bank announcements.
5. StockTwits Sentiment Analysis
StockTwits is a social media platform for traders where market participants post opinions on stocks and indices. Advanced sentiment tools analyze these posts for bullish or bearish trends.
Key Features:
Crowd-sourced sentiment from retail and professional traders.
Tracks trending topics, ticker mentions, and sentiment ratios.
Offers sentiment heatmaps and trend alerts.
Applications in Trading:
Short-term trading: Identifies momentum or contrarian opportunities based on social sentiment.
Retail behavior tracking: Helps understand herd mentality in specific sectors or stocks.
6. Investor Intelligence Survey
The Investor Intelligence Survey tracks the opinions of professional newsletter writers, reflecting market sentiment among seasoned investors. Like the AAII survey, it categorizes respondents as bullish, bearish, or neutral.
Key Features:
Monthly survey provides insights into professional investor psychology.
Historical extremes often serve as contrarian indicators.
Focuses on U.S. equities but is influential globally due to its professional audience.
Applications in Trading:
Contrarian market timing: Extremes often precede reversals.
Portfolio allocation decisions: Understanding professional sentiment can inform risk exposure adjustments.
7. Commitment of Traders (COT) Reports
Published by the Commodity Futures Trading Commission (CFTC), the COT report provides a breakdown of long and short positions held by commercial traders, non-commercial traders, and retail speculators in futures markets.
Key Features:
Shows the positioning of different market participants in commodities, currencies, and indices.
Weekly release allows traders to identify shifts in speculative or hedging behavior.
Valuable for understanding trends in large-scale futures markets.
Applications in Trading:
Trend analysis: Divergence between commercial and non-commercial positions can indicate upcoming market moves.
Sentiment shifts: Detecting changes in speculator positions helps anticipate momentum.
8. Google Trends
Google Trends measures search interest for specific terms, which can serve as a proxy for public attention and sentiment toward stocks, cryptocurrencies, or commodities.
Key Features:
Tracks search volumes and trends over time.
Can detect rising interest in certain assets before price movements occur.
Free and globally accessible.
Applications in Trading:
Retail interest tracking: Surges in searches often precede market moves.
Cryptocurrency and meme stock analysis: Useful for gauging online hype-driven markets.
9. TipRanks
TipRanks aggregates analyst ratings, insider trading activity, and hedge fund holdings to measure market sentiment on specific stocks. It provides a “Smart Score” to quantify bullish or bearish consensus.
Key Features:
Combines professional analyst opinions with real-time market actions.
Tracks insider buying and selling as a sentiment indicator.
Offers performance metrics to verify analyst accuracy.
Applications in Trading:
Long-term investment decisions: Identifies stocks with strong institutional or insider support.
Contrarian trading: Discrepancies between analyst sentiment and stock performance can highlight opportunities.
10. Alternative Data Sentiment Platforms (e.g., Dataminr, Accern, Kensho)
These platforms leverage AI and alternative datasets to provide real-time sentiment analysis across multiple asset classes. They track everything from social media chatter to supply chain disruptions and satellite imagery.
Key Features:
Real-time insights from unconventional data sources.
AI-powered predictive analytics to detect market-moving trends.
Covers equities, commodities, forex, and crypto markets.
Applications in Trading:
Event-driven strategies: Traders can act on early signals before mainstream news impacts prices.
Risk management: Early warnings from alternative datasets help mitigate downside risk.
Conclusion
In the modern global trading market, sentiment analysis has become indispensable. The tools above range from surveys like AAII and Investor Intelligence to advanced AI-driven platforms such as RavenPack and Dataminr. While no single tool guarantees success, combining multiple sentiment indicators can enhance market understanding and improve decision-making. Traders who effectively integrate sentiment analysis with technical and fundamental analysis can better anticipate market reversals, identify trends, and manage risk efficiently.
Sentiment tools are particularly valuable in volatile markets, where emotions can drive irrational price moves. Whether using retail-focused tools like StockTwits or institutional-grade platforms like COT reports, these resources provide actionable insights into market psychology, making them essential for any serious trader or investor.


DOLO/USDT: Golden Zone Pullback Sets the Stage for the Next BullDOLO is holding a bullish structure after a strong impulsive move up. Price has pulled back into the Fibonacci golden zone (0.5–0.618), indicating a healthy retracement rather than a trend reversal.
Bias: Bullish continuation
Entry Zone: ~$0.0395 (golden zone support)
Invalidation: Clean break below $0.0343 (SL)
Upside Levels:
Target 1: $0.03930 (near-term reaction)
Target 2: $0.04350 (prior structure resistance)
Final Target: $0.04680 (range high / liquidity zone)
As long as price holds above the golden zone, the setup favors buy-the-dip continuation toward higher targets. A loss of $0.0343 would invalidate the bullish setup.
